Football Table Simulation Visualization Tool

Information
A simulator is developed to easily test new algorithms without depending on the actual robot. Also, tests can be performed at a faster pase. This makes it easier to study problems such as higher level gameplay strategies. This simulation is created with use of MORSE, which is a Multiple Open Robot Simulation Engine.
Together with this simulator, a visualization tool (GUI) is developed to visualize the sensor data of the football table. This tool is connected with the simulator or the table and provides the interface to the user.
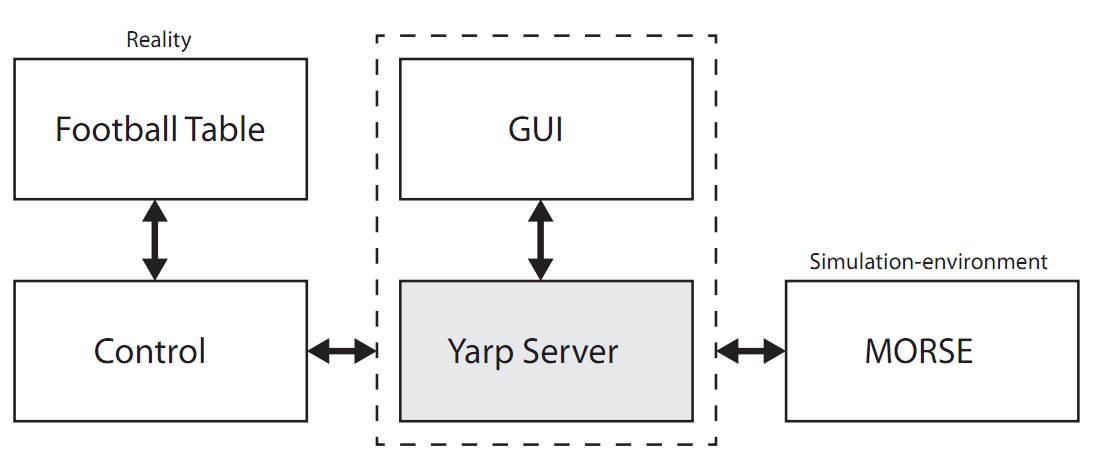
These different systems: Simulator, Football Table and the GUI are connected with use of the Yarp Middleware.
External Documentation
- Report: Development of a Simulation and Visualization Tool for an Autonomous Football Table - Rein Appeldoorn
- MORSE Installation Guide with Yarp support - Ubuntu 10.04 LTS x86
Structure

Data flow
The current network-structure of the project is shown in Figure 2. Three connections are needed:
• Control ←→ Simulator (Actuators/Sensors)
• Simulator ←→ GUI (Visualization)
• Control ←→ GUI (Visualization)
Middleware
This data-communication is established with use of the Yarp Server (which is integrated in the GUI). It creates the link between the multiple subsystems. Further information about this communication can be found in the report.
Tool
The tool contains two elements: Visualization and Simulation. It communicates with the real football table or simulator to visualize the sensor data during a work-out. Starting simulations with use of this tool is not yet possible but can be implemented in the future. For now, the simulations has to be started with use of the MORSE simulator and after that, a connection can be established to visualize the sensor-data of the simulator.
Graphical User Interface
The GUI is made with use of two main elements: QT (UI Framework) and OGRE (3D Graphics Engine). With use of the visualization, the user can see what information the robot obtains during a work-out. This part of the GUI visualizes the sensor data that comes from the GUI-client. Updating this visualization and receiving data is done at a frequency of 50 hertz. This provides a smooth playback of the sensor data of the (simulated) robot to the user.
Simulation

The simulation is build with use of MORSE. This robot simulator is based on Blender's Gamelogic module (Module for game-creation). This module is entirely scriptable with use of Python. These python-scripts can interact with the simulated environment.
The MORSE addition to this module makes it possible to communicate with these python scripts with use of middlewares or simple sockets. Local variables of these scripts can be modified or read; which results in a control of the simulated environment with use of an external client.
An overview of this communication in case of the football table is given in the report. It also contains an overview of the MORSE workflow which gives more insight in the working principle of MORSE.
Info
Hardware
Software
Repository