PRE2024 3 Group5
Group Members
| Name | Student ID | Department | |
|---|---|---|---|
| Anton Veshnyakov | 1866508 | Electrical Engineering | a.veshnyakov@student.tue.nl |
| Luuk Kool | 1883542 | Electrical Engineering | l.j.c.kool@student.tue.nl |
| Anh That Tuan Ton | 1816209 | Electrical Engineering | a.ton.that.tuan.anh@student.tue.nl |
| Luca Rutz | 1781294 | Electrical Engineering | l.d.rutz@student.tue.nl |
| Simon van Valkengoed | 1881361 | Electrical Engineering | s.h.v.valkengoed@student.tue.nl |
Problem Statement
The hull of an ocean-going vessel is subjected to immense forces and the unforgiving conditions of the ocean. As a result, these vessels must undergo hull inspections twice within every five-year period in a dry dock. These regulations originate from the SOLAS convention and are overseen by the Maritime Safety Committee of the IMO[1]. For bulk carriers and oil tankers, an example is Resolution MSC.461(101), which mandates that their hulls be inspected twice every five years in a dry dock, with certain exceptions[2].
A key challenge for shipyards conducting these inspections is the inability to accurately predict how long a vessel will remain in dry dock. This uncertainty stems from what the inspection would uncover, as the extent of necessary repairs remains unknown until the inspection process is completed. Consequently, it is difficult for shipyards to efficiently plan and allocate their dry dock facilities.
To mitigate this issue, it would be advantageous for shipyards to conduct preliminary inspections that identify serious structural concerns in advance. This proactive approach would allow shipyards to anticipate potential repair needs, improve scheduling, and optimize dry dock usage.
User Interview
Damen Group
To better understand what the industry, and thus the users of this product, would want, it was decided to reach out to the Damen Group here in the Netherlands because of their vast knowledge in building, inspecting, and using dry docks.
After reaching out to them we came into contact with Klaas Kuper how is a Area Sales Manger of the Netherlands, Poland and the Baltic states. Mr. Kuper kindly answered our questions via the email and invited us for a teams meeting which we gladly accepted.
In the team meeting, we discussed the potential use cases for an underwater hull inspection robot. Specifically, we explored the advantages of a survey robot that can assess the structural integrity of a ship's hull with greater accuracy than the current robots, which rely on cameras.
The original concept for the underwater robot was to replace dry dock inspections of the hull. However, Mr. Kuper pointed out that the time saved during dry dock stays would be minimal since the ship would still need to enter dry dock for other inspections and to access areas the robot cannot reach.
He suggested that the robot could be more useful in assessing the ship's hull before it enters dry dock. This would allow the shipyard and the shipowner to better estimate the duration of the dry dock stay and identify necessary repairs in advance. The main advantage of this approach is that the shipyard could better schedule dry dock availability and prepare for upcoming repairs, while shipowners would gain a clearer understanding of the inspection costs and potential repair expenses.
| Question | Answers |
|---|---|
| How often are ship hull inspections needed, and what types of inspections are required? | On average A seagoing vessel is docked 2 times every 5 years. Sometimes one of the dockings can be a so called in water survey.
Type of class survey’s: Periodical surveys:
https://english.ilent.nl/topics/seagoing-vessels https://rs-class.org/en/services/classification-surveys/#:~:text=Classification%20surveys%20of%20various%20purpose,retainment%20and%20confirmation%20of%20the |
| How expensive are hull inspections, and what factors influence the cost? | Depends on the scope and the age of the vessel. At a new vessel the scope is limited. If the vessel gets older more items need inspection. |
| What are the most expensive or least reliable parts/methods to inspect? | Hull thickness measurement.
https://www.mme-group.com/nl/scheepvaart/ https://www.mme-group.com/nl/maritieme-surveys/ultrasone-diktemetingen-utm/ |
| What are the most challenging areas of the hull to inspect and why? | Flat bottom. Due to groundings. Ballast tanks (inside the hull) due to corrosion |
| What are the most commonly used methods for ship inspections today? | Drydocking or divers. |
| How often are divers used for inspections, and what are the risks involved? | Only for intermediate or bottom survey. Risk that damages are missed / mis interpretated |
| What are the most common defects found during hull inspections, and how are they
detected? |
Dents, cracks, punctures, cavitation etc. visually or by 3D measurement. |
Users requirements summery
The primary users for this product would be the ship owners and the shipyards.
The shipyards want to keep the cost as low as possible since they are the ones paying for the preliminary inspection. For this inspection, it is important to the shipyards that the data collected allows them to make an informed prediction about how long the vessel will remain in dry dock and what materials will be needed to repair the hull. The required data includes measurements of hull thickness as well as information on both superficial and internal metallurgical fractures.
Shipowners and operators have different priorities than shipyard owners. Their main concern is the amount of time the vessel will be out of service for the inspection. Minimizing inspection time is a top priority for them. Ideally, the inspection would be carried out while the ship is docked in port or waiting to enter, to avoid disrupting operations. For shipowners in particular, it is also important that inspections utilize non-destructive testing methods to prevent any damage to the vessel.
Secondary users could include insurance companies or potential buyers of the vessel. Their requirements would align closely with those of the shipyard owners, as cost is also a significant factor for them—especially since the inspection is not essential for their purposes, but rather an added advantage.
State of the art
The current state of the art for remote underwater inspections can be subdivided into two types of submersibles, Hull crawlers and free-floating submersibles. The main difference between these technologies is that free-floating submersibles have a greater mobility and can better reach the entirety of the hull of a vessel, whereas hull crawlers have a distinct advantage when it comes to preforming testing onto the hull of a vessel because it makes direct contact with the hull.
Hull crawler
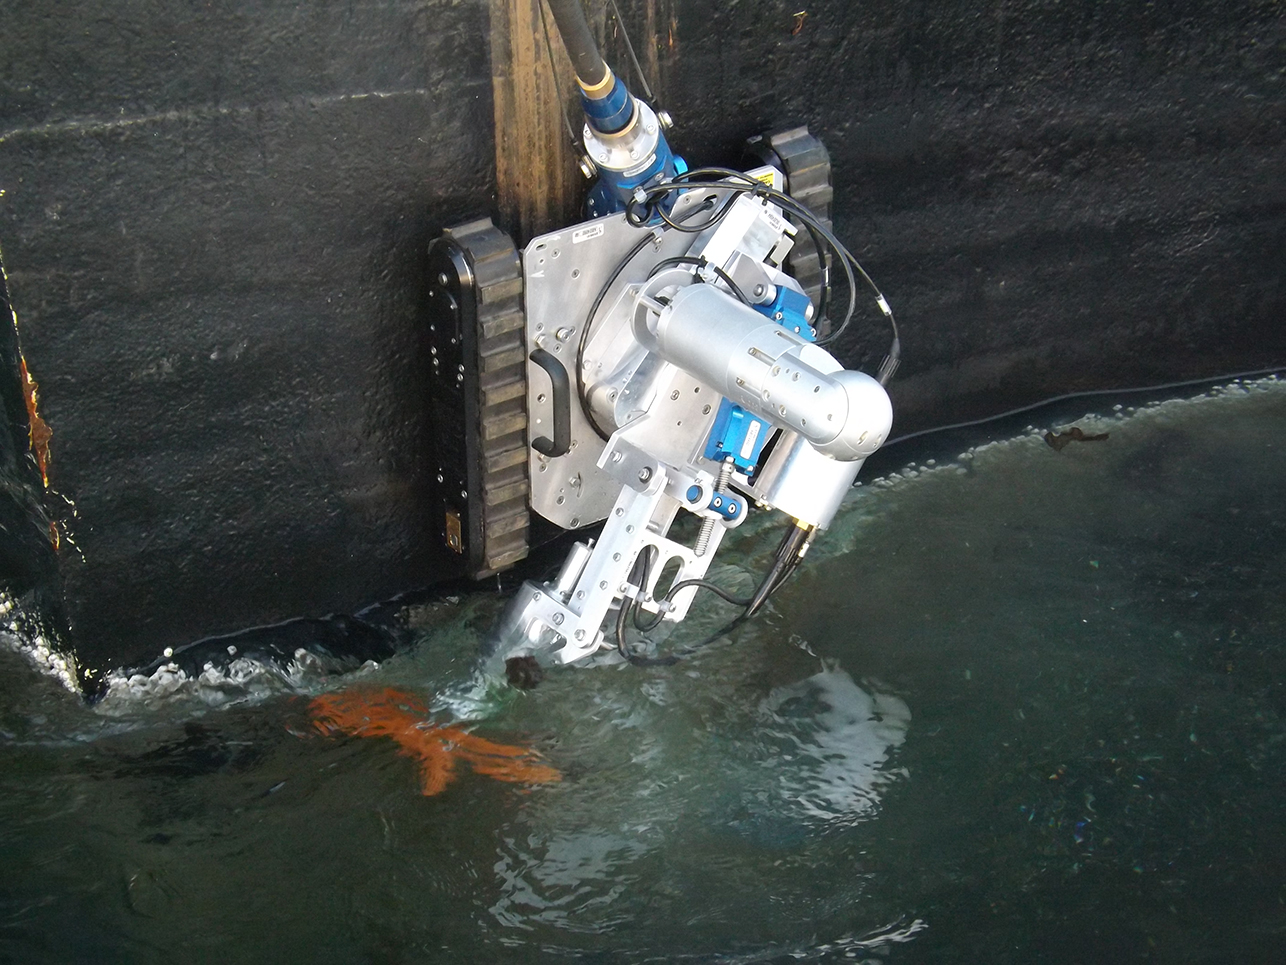
Two examples of state of the art crawlers are the MAG Crawler of Deep Trekker[5] and the VERSATRAX M480 of Eddyfi[4]. These crawlers use magnetic forces to attach themselves to metal structures like the hull of ships. This gives the crawlers also a distinct advantage above free-floating submersibles because these crawlers can both operate above and below the waterline as long as the can attach themselves to a ferrous surfaces.
With there close proximity to the hull these robots typically use a type of ultrasound and or a magnetic based probe which usually a alternating current field measurement sensor (ACFM), and while these robots are also usually equipped with cameras for visual inspection it is not there strongest point because of the aforementioned mobility of these robots.

Deep Trekker MAG Crawler
The MAG Crawler of Deep Trekker is a battery-operated crawler that uses a pair of rear earth magnetic wheels to move around. While the robot is battery-operated it still needs a tether for data transmission to a control station for operation. This is because the radio signals which are usually used to operate remote controlled vehicles like drones attenuate significantly faster in water then in air. For this reason, almost all remote-controlled submersibles use a tether to stay connected to control station from which they are operated.
The MAG Crawler has a footprint of 710 mm by 406 mm with a height of 228 mm and a mass of 16.6 kg. The robot is rated for a depth of 50 meter and the tether has a maximum length of 400 meters[5]. It comes standard equipped with a camera and can be equipped with other tools and sensor. These can be mounted on top of the frond side of the robot. This makes it more than suitable of inspecting small ocean-going vessels. The biggest drawback of the MAG crawler approach to crawlers is that it has a limited operational time because of the battery which makes it more difficult to inspect larger ships and to equip it with more energy intensive probing like ACFM.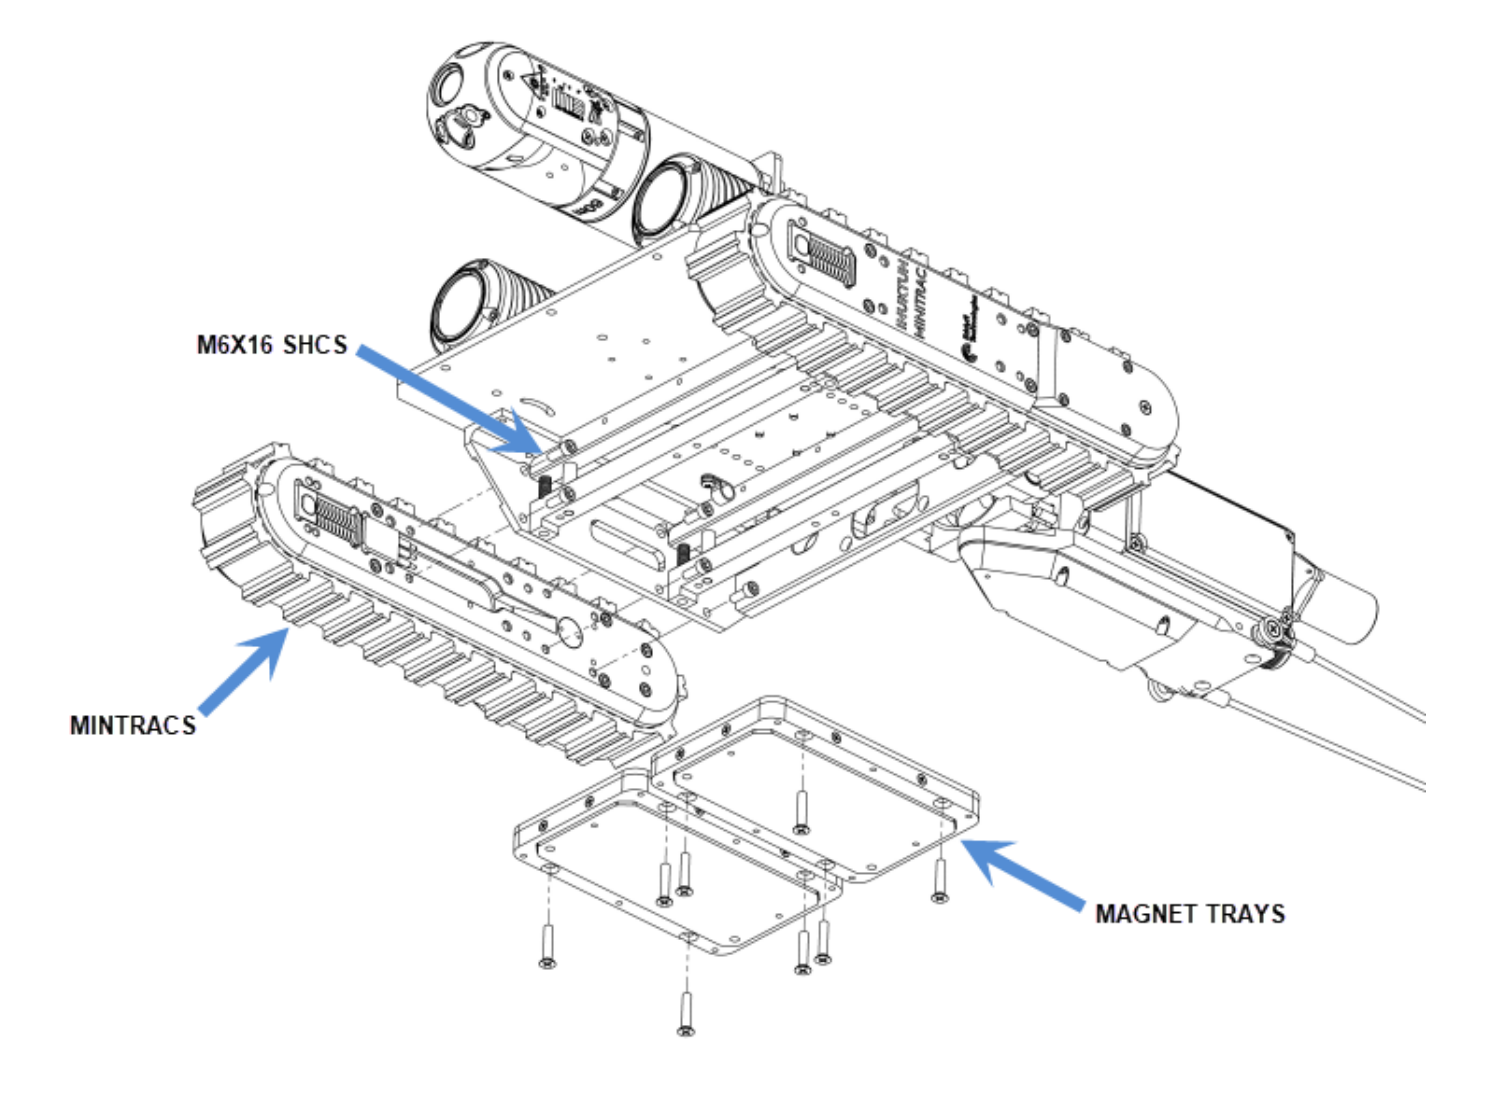
VersaTrax VT-M480 (Eddyfi Technologies)
he VersaTrax M480 from Eddyfi Technologies is a high-end, magnetically adhering crawler designed for more advanced inspections then the MAG Crawler on large steel structures such as ship hulls, storage tanks, and offshore platforms. Like other hull crawlers, it uses rare earth magnets to secure itself to ferrous surfaces, allowing it to operate on vertical and inverted surfaces both above and below the waterline.
The crawler’s chassis is robust and designed to accommodate vertical payloads of up to 24 kg. The robot itself is around 480mm wide and around a mass of 36 kg[6], with the length dependent on the configuration. It uses tracked propulsion for movement which gives it greater traction than the wheel-based crawlers. The magnetic adhesion in combination with the tracked propulsion enables the vehicle to support heavier inspection payloads while maintaining a stable position on the inspection surface.
The VT-M480 is powered through a tethered system that supplies high voltage DC power (400 VDC) and supports data transmission for camera feeds, control signals and real-time probing information. Because of this tether-based design, the VT-M480 can operate at depths up to 60 meters and has a maximum tether length of 1000 meters[6], making it suitable for inspecting large, ocean-going vessels. It is controlled via a surface station using Eddyfi’s ICON™ software, which also handles real-time HD video, camera control, and NDT data logging.
Like the MAG Crawler, the VT-M480’s close contact with the hull allows it to support a range of non-destructive testing tools. These include for the VersaTrax series ultrasonic thickness probes, eddy current arrays, and alternating current field measurement (ACFM) sensors[7].
Overall, the VT-M480’s combination of strong adhesion, heavy payload support, high-quality imaging, and NDT integration make it one of the most capable and versatile hull crawlers available on the market today, particularly well-suited for thorough and reliable hull inspections on large vessels.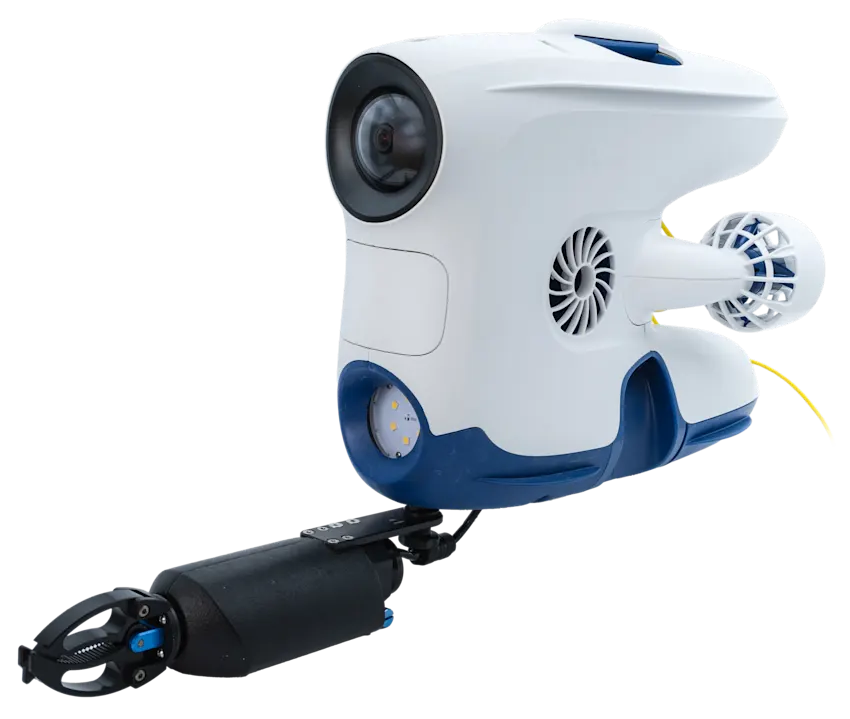
Free-floating submersible
Free-floating submersibles, often referred to as ROVs (Remotely Operated Vehicles), inspection platforms that can navigate freely through the water column. Their primary advantage over hull crawlers lies in their superior mobility and ability to access difficult-to-reach areas, including complex geometry sections of ships where hull crawlers can’t navigate over. These submersibles are not reliant on direct contact with the hull, allowing them to inspect both ferrous and non-ferrous surfaces. However, because they lack physical attachment to the structure, they are generally not used for conducting physical tests like ultrasonic thickness measurement or ACFM, which require stable surface contact.
Most free-floating ROVs are equipped with high-definition cameras, onboard lighting, and sensors for navigation and imaging. Some models also support sonar systems and limited payloads for environmental monitoring. Their control is typically achieved through a tether that transmits video, command signals and sometimes also power. Some newer models are experimenting with wireless communications in water[9].
Our concept
The idea
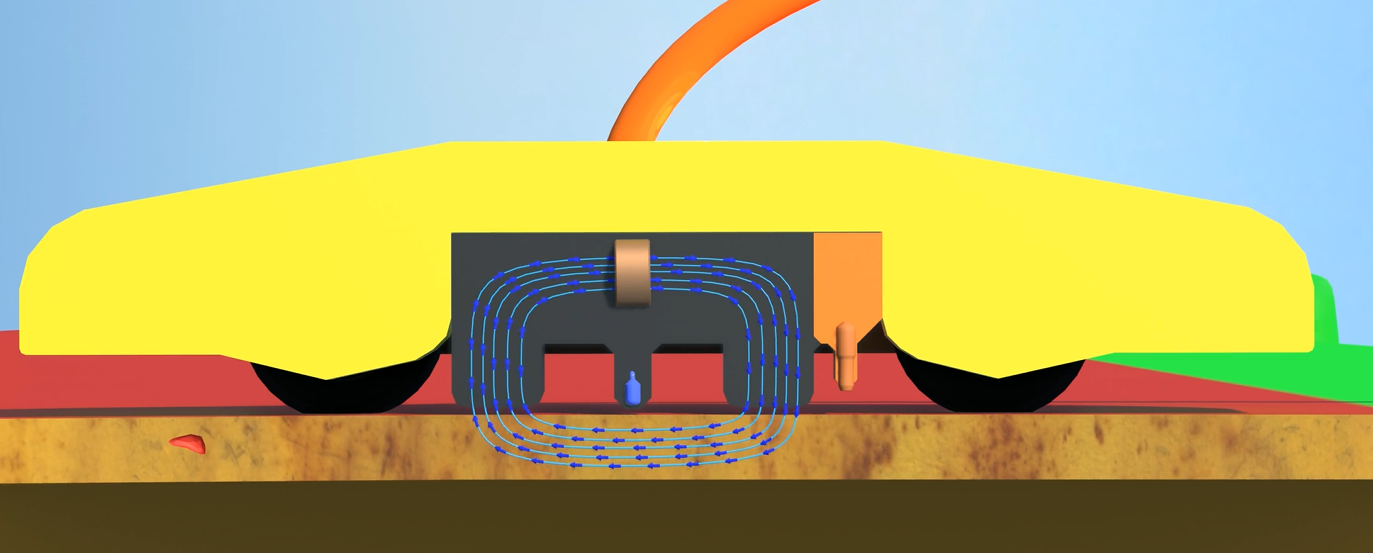
The final design consists of a smooth outer shell, four wheels, a magnetic flux leakage sensor, an ultrasonic sensor, an electromagnet, and a tether. The outer shell has a streamlined shape that reduces drag while driving through the water. Furthermore, the four wheels are located on the corners of the robot, and all allow rotation for better movability. The electromagnet and the sensor are placed in the center of the robot because they are heavy, and by having them in the center, the robot stays balanced. The electromagnet and the magnetic flux leakage sensor are placed slightly in front of the center, and the ultrasonic sensor is placed right after them. This setup allows the magnetic flux leakage sensor to detect the crack first, and the ultrasonic sensor can be used right after that. Lastly, the robot is connected with a tether to the control station. This tether provides the robot with power and can also be used to send data to and from the robot.
Robot operation
The robot would operate as follows. First, an operator would take the robot to the hull off the ship. The operator then places the robot in a predetermined location on the ship. The coordinates of this location are known to the robot and operator and can later be used for localization. By placing the robot on the hull, the robot magnet turns on, and the robot would stick to the hull. The operator would then move back to the control station and press the start button. After pressing the start button, the robot would initialize its variables and start driving. The robot would drive in a vertical zigzag pattern over the ship. When the robot reaches an edge, it turns 90 degrees, moves a bit, and turns 90 degrees back. This pattern would repeat over the entire hull or a specified part. While driving over the hull, the robot uses the Magnetic Flux Leakage sensor to check for any cracks or other hull problems. When a crack is found, the crack position and the Magnetic Flux Leakage data are saved in the robot. The robot then moves a bit forward and positions the ultrasonic sensor above the crack and uses the sensor the take another measurement. This measurement is also saved, and together with the other crack data, it is sent to the operator over the tether. The operator then receives a notification that a crack is found and that data is available. After sending the data, the robot would continue its course and keep sensing for more hull defects. During operation, the robot could be stopped at any time and removed from the hull. The robot's scanning area could also be changed while the robot is operating. When the robot finishes scanning the specified area, it would stop all its movement and upload all the data to the control station. In the control station, a full list of all cracks with data is created and shared with the operator. After this, the operator can go back to the robot, turn off the magnet, and grab the robot from the hull. The robot can then be stored for later use.
Robot forces
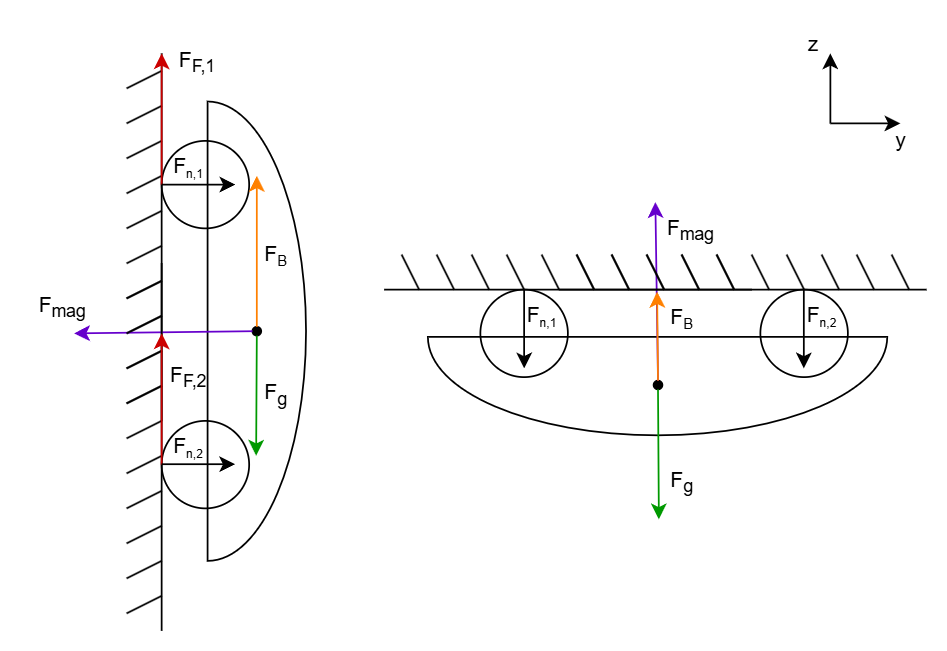
tTo check whether it is possible to use a(n) (electro)magnet, a force analysis was done. The force analysis tries to specify the needed magnetic force in order for the robot to stick to the hull and keep its position. This analysis is done for two scenarios one where the robot is placed against a vertical hull and one where the robot is place on the underside of the hull. For the analysis the robot was assumed to have a mass of 20 kg and a volume of 0.026 m3. The volume was obtained by taking a rough estimate of the volume of the robot 3d model. For both scenarios the velocity and acceleration are assumed to be zero.
The first scenario can be characterized by the following equations.
(1) ΣFz = FF + FB - Fg = 0
(2) ΣFy = Fn - Fmag = 0
(3) FF = FF,1 + FF,2 = μFn
(4) Fn = Fn,1 + Fn,2
(5) Fg = mg
(6) FB = ρVg
Where FF is the friction force, Fn is the normal force, Fg is the gravitational force, FB is the buoyancy force, and Fmag is the magnetic force. The robot mass is represented by m and the robot volume is represented by V. μ is the friction coefficient of the tire, which in this case is set to 0.1. This coefficient is the same as the coefficient of a wet car tire. ρ is the density of water, which is 1000 kg/m3 at a temperature of 4o C. Lastly, g is the gravitational acceleration, which is 9.81 m/s2. Solving these formulas gives that the needed magnetic force 588.6 N. Solving the formulas also shows that the friction is in the wrong direction, because the buoyancy force is larger then the gravity.
The second scenario can be characterized in the same way as the first scenario. The only difference is with the sum of the forces in the y and z direction. The resulting equations are described below.
(7) ΣFz = Fmag +FB - Fg - Fn = 0
(8) ΣFy = 0
When the buoyancy, the gravity and the magnetic force are in perfect equilibrium the normal force will be zero, because the normal force scales with the resulting force applied on the hull. Given this the magnetic force can be calculated with equation 7. Solving the equations show that the buoyancy force is bigger than the gravitational force, meaning that there is no magnetic force needed. However it is always useful to have a magnetic force in the up direction to make sure the robot stays still when being pushed by currents.
In conclusion, the magnetic force needs to be at least 588.6 N to fulfill the requirements in scenario one. This amount is reasonable (proof can be read in the next section), meaning that the concept of using a magnet to stick to the hull is useable.
Magnetic Flux Leakage (MFL) detection
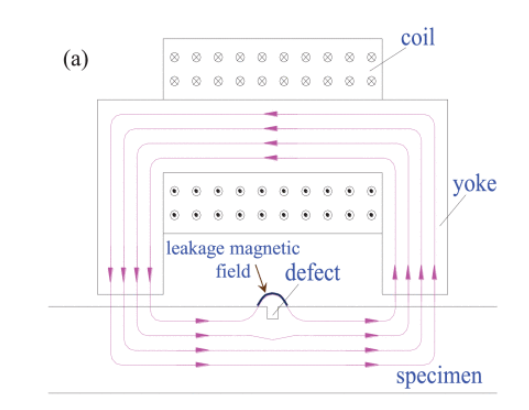
Today, the main energy sources that most people rely on, such as gas and oil, are being transported using pipes running in all kinds of environments. It is crucial to maintain the structural integrity of the pipes as a leak can potentially cause a catastrophe. However, it is impossible to inspect hundreds of thousands of kilometers of pipes visually, both due to the sheer size of them and also due to the fact that some of them run under ground or under water. To tackle this problem, engineers came up with a robot that can enter a pipe and scan it from the inside, looking for potential abnormalities. One of the main tools to accomplish this task is using the Magnetic Flux Leakage technique. Since most pipes are built out of steel, which is ferromagnetic, meaning it conducts magnetic fields within itself, it is possible to recognize a defect in the pipe by measuring the magnetic field that passes through a certain point in a pipe[11]. In a similar manner, this technology can be used on the hulls of ships since they are also made of ferromagnetic materials, usually steel and steel alloys. Since the idea of using MFL for ships is quite novel, little research has been done on implementing the system on a robot or similar machine to carry out the inspection. As a result, we base our research on models and experiments that have been conducted on land based objects, such as pipes and train rails. The assumption here is that using the equations that govern those models and experiments, it is possible to adjust the technique to be used under water.
What is Magnetic Flux Leakage?
In order to understand what magnetic flux leakage is and how it can be useful for detecting cracks and metal defects, we first need to understand the concept of magnetic flux in general. Magnetic flux is the measure of the total magnetic field passing through a given area. Mathematically, magnetic flux is defined as: Φ = B · A · cos(θ), where B is the magnetic field strength [Tesla], A is the area [m2], and cos(θ) is the angle between the area and the magnetic field. Magnetic flux is measured in units of Weber and can be created by magnets that are put in-line with the ferromagnetic material, or by using current carrying wires that induce a magnetic field as can be seen in Figure 1. While most of the magnetic flux is following the shape of the ferromagnetic material, some of it will jump through the gaps that are present in the loop, which is called leakage or fringing. As can be seen in Figure 1, a surface defect, such as a crack, will cause some of the flux to "leak" or take a different path than the straight line it should usually follow. Small amounts of leakage also happen in the gaps between the flux producing yoke and the specimen itself but those can be neglected as they are not usually picked up by the sensors. The sensor used to detect the magnetic field leakage is called a Hall Effect Sensor.
Hall Effect Sensor
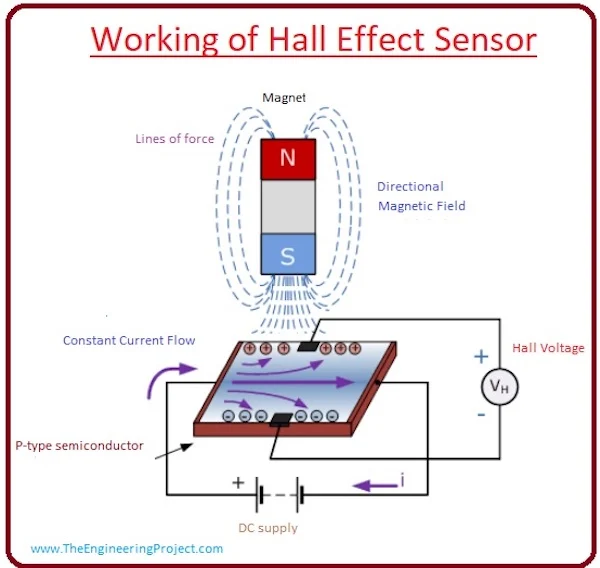
To pick up the magnetic leakage from a defect on a surface, a Hall Effect sensor is utilized. The hall effect is the interaction between a current carrying conductor and a perpendicularly moving magnetic field, when the later exerts a force on the moving charge, making it concentrate on one side of the conductor. As a result of that concentration, a voltage can be created and measured on the transverse side of the conductor. By utilized a Hall effect sensor, it is possible to detect not only the presence of a magnetic field, but also its strength, as it would be proportional to the strength of he induced voltage. The Hall Effect voltage is described by the following equation: VH = IB / qnd, where I is the current through the conductor, B is the magnetic field strength, q is the charge of an electron, n is the charge carrier density, and d is the thickness of the conductor in the direction of the magnetic field.
MFL application in the industries
Magnetic flux leakage (MFL) detection is one of the most popular methods of inspection of structures made out of ferromagnetic materials. It is a nondestructive testing technique which uses magnetic sensitive sensors to detect the magnetic leakage field of defects on both the internal and external surfaces of given structures. [13] The inspection of those structure is often important due to the safety and health risk that small fatigue cracks can cause, especially when talking about oil and gas pipes, or the tanks of a oil carrier ship. IN addition to fatigue cracks, MFL can be used to detect such things as corrosion, erosion and metal loss, although there are more reliable and easier methods to go about detecting those defects. For the pipeline reliant industries, MFL is useful as it can be mounted on a special robot that goes inside the pipe and by suing the MFL can detect defects both on the inside and outside of the pipe without requiring a direct human access to the entirety of the pipe. In the train industry, MFL can be used to detect early-stage fatigue cracks on the wheels, which is crucial for the safety of the train and its passengers, as broken wheels can lead to derailments and catastrophic consequences.[10]
Influence of crack orientation on MFL
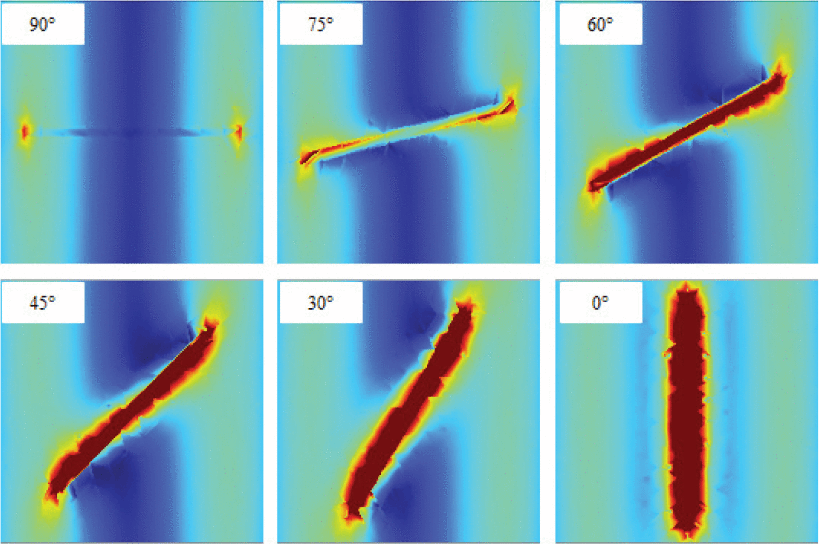
Due to the 3D nature of our world, cracks can be created and then propagate in different direction in the material. When using one MFL sensor it is sometimes hard or impossible to get a strong enough leakage so that it can be detected by the sensor. Additionally, even when using a linear arrangement of of sensors it is still not enough if the crack is perpendicular to the sensor array. [14] As stated in the research paper [14], it is advised to use a circular sensor array in order to achieve the best crack detection and orientation. Figure 3 demonstrates the different digitalized read-outs from the MFL sensor with relation to the angle of the crack to the sensors. The difference of the crack detection as a result of its orientation is explained by the following equation: B' = B · cos(β), where B' is the resulting magnetic flux density across the crack, B is the original flux density, and β is the crack's relative angle with respect to the magnetization direction. Additionally, it has been shown that deeper or wider cracks result in stronger leakage fields, as well as changing the amplitude and spatial distribution of the signal, which makes FML highly suitable for detecting cracks [15].

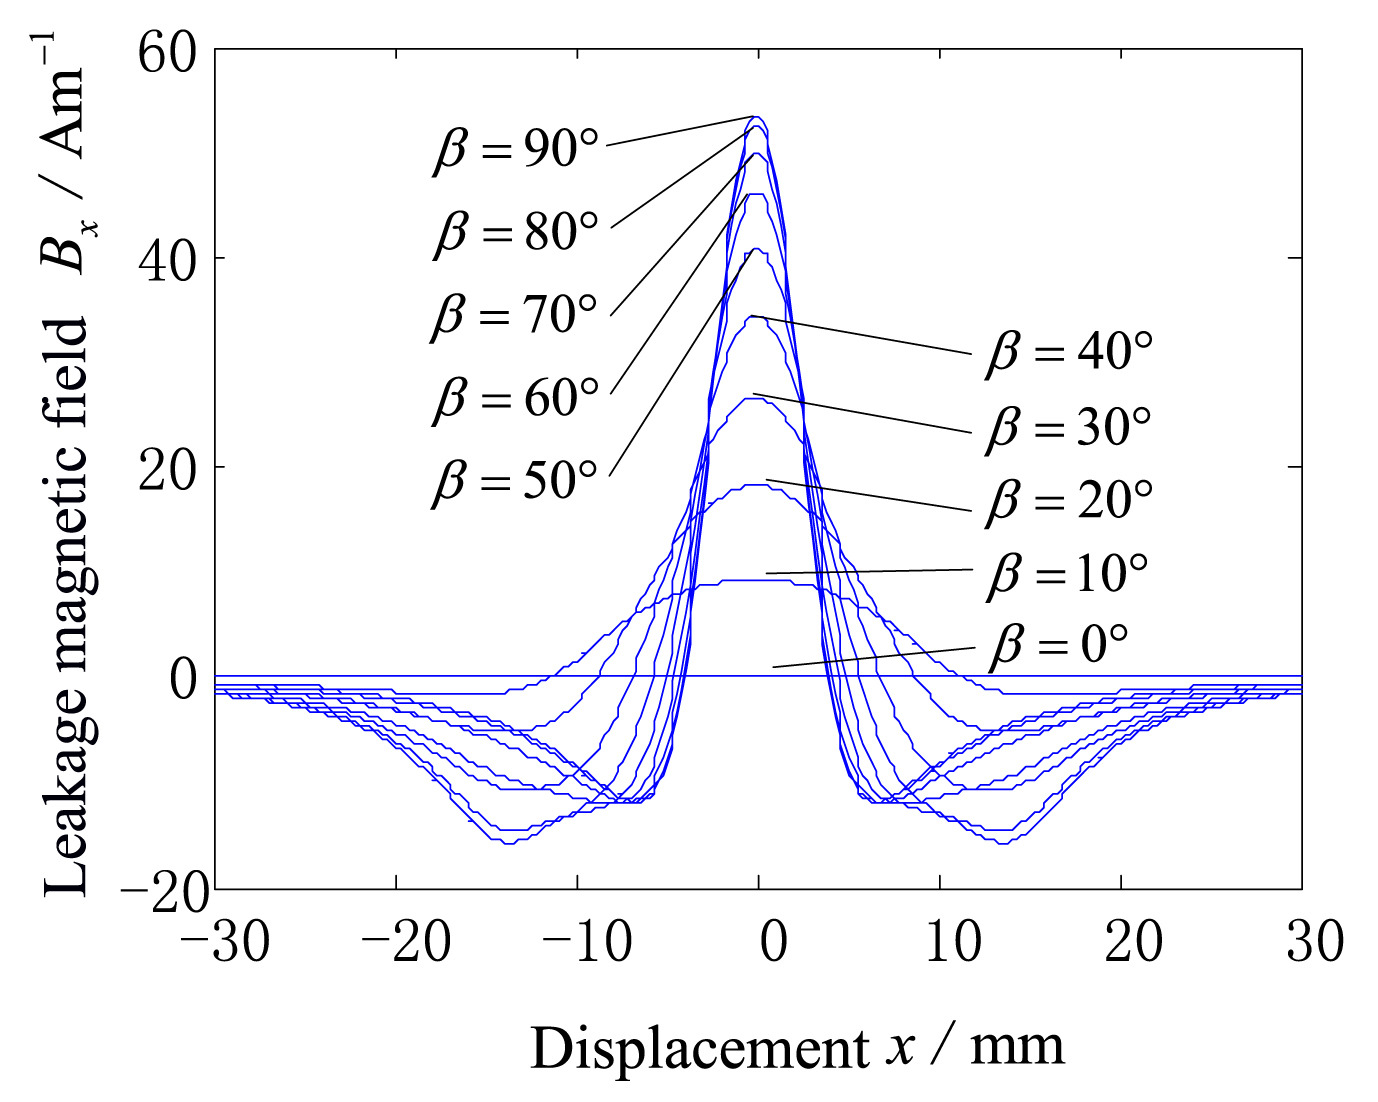
Expanding the equation for the magnetic flux across the crack, the strength of the flux can be expressed as demonstrated in Figure 4. The flux strength relies further on other parameters of the crack, such as its width, length, and depth, where β is the most important variable [16]. Figure 5 Shows how the orientation of the crack in relation to a linear detector influences the strength of the detected flux leakage.
Sensor placement and Scanning techniques
When utilizing MFL for crack detection, there are a variety of different ways to position the sensors. The simplest way is to arrange the sensors in a linear array which allows for a large area coverage while requiring minimal space utilization, making the entire scanner fairly compact. Researchers have built such a sensor array and demonstrated that it can detect cracks in mild steel plates with ease [18]. Furthermore, the detection can indicate the depth and orientation of the crack as signals reach sensors at different times. Another way to arrange the sensors is in a circular pattern. As shown in Figure 3, a circular array of sensors will allow not only for crack detection but also for easier orientation detection. But "looking" at a crack from multiple angles, the circular array can at once indicate the crack orientation without the need to swab the whole area, unlike the linearly arranged sensors [14]. Another less common, and as of yet experimental, way to use MFL is called Pulsed MFL, or PMFL. By pulsing the external magnetic field by means of an electromagnet, PMFL offers better defect localization and sizing by using features in the time-frequency domain. A research paper on the topic showed that it is the best solution overall for both on-surface and sub-surface crack detection, which makes it suitable for applications where access is limited to only one side of the inspected surface [19].
Remanent Magnetic Flux Leakage
Another way to use magnetic flux leakage is to rely on a property of ferromagnetic materials called remanent magnetization. Remanent magnetization occurs when ferromagnetic materials are exposed to strong magnetic fields. When the external magnetic field is removed, instead of going back to being neutrally magnetically charged, ferromagnets will retain some of the magnetic filed and will become "magnetized" themselves [20]. When a crack is present in a ferromagnetic material, it may be hard to detect it with regular MFL detection techniques due to the already high magnetic field present in the observed section and the inherent flux leakage that happens in all materials. However, when the external magnetic field is removed but the material remains magnetized, the flux leakage across the crack will be more pronounced in relation to the weakened background magnetization. This allows sensors to pick up any cracks and defects easier, even if their size is fairly small [20].
Current applications
While being available for some time already and having some substantial research done on it, not many companies have developed MFL sensors that re available of the shelf. The most prominent company to integrate MFL sensors into its products is Eddyfi. According to the company's website, Eddyfi provides the highest performance Non-Destructive Testing (NDT) inspection technologies in the world, helping OEMs, asset owners and service companies enhance productivity, save lives, and protect the environment [21].
Eddyfi uses MFL technologies primarily for pipeline inspection and has a line of products that perform the same role but at differing size points.
For example, the Pipescan HD is a portable sensor array that can be used for pipe inspections. According to Eddyfi, Pipescan HD is the highest resolution MFL scanner on the market. With a high Probability of Detection (PoD), the Pipescan HD is an effective and reliable pipe inspection solution for corrosion and pitting detection [22]. The scanner module requires almost no surface preparation and no couplant, which is a substance that helps transmit energy. Scanning speed of the Pipescan HD can be up to 1m/s, and it has an adjustable reporting threshold to define the depth at which the scanner works.
Maximal theoretical speed of movement
In a paper published by a research team from Nanjing University of Aeronautics and Astronautics, China, the speed limits of detection using MFL were explored [23]. In their test setup, the researchers used a spinning wheel, which had pre-made cracks for simulation purposes, as their test subject. Near the wheel, 2 magnetizing yokes were attached with their polarities being opposite to each other. Three perpendicular Hall Effect sensors were attached to the yoke that is placed against the direction of the spinning wheel. That way, the wheels surface is first magnetized by the yoke without the sensors and then the polarity of the magnetization is reversed by the yoke with the sensors, which increases the flux leakage and makes it easier for the hall sensors to pick it up. In testing, the team spun the wheel in speeds ranging from 5 m/s (18 km/h) up to 55 m/s (198 km/h) and recorded the results. The results indicate that the flux leakage detection is getting better, although non-linearly, as the speed was increased [23], meaning there is a good feasibility for high speed MFL detection to be applied in crack detection industries.
Design choices for ship hull inspection
Based on the conducted research and based on already existing technological achievements that were proven to work in the field, some technical design choices can be made for the next generation of ship hull inspection robots.
Size - From the research conducted, the decision was made to use a circular array of hall sensors. The size of the array will be 20 [cm] to adequately cover enough area for good scanning pace and at the same time aid at both crack localization and orientation for higher quality information. The electro-magnet responsible for creating the magnetic flux will be nestled on top and around the hall sensors. The electro-magnet consists primarily of a yoke shaped core that would be divided into sections for ease of saturation. The yokes width would be also 20 [cm], the height is [5cm], and the length is [25cm]. Since the yoke is the largest part and dictates the dimensions of the sensor assembly, the final size come to be 0.25x0.2x0.05 [m].
Weight - The heaviest part of the sensor is the yoke that needs to provide adequate magnetic flux to saturate the underlying surface. For that purpose, 5 yokes of equal size will be used. Each of the yokes has to have a uniform cross-sectional area hence it is chosen to be 3x3 [cm]. Each of the yokes hence would be the size of 0.25x0.03x0.05 [m] and weigh roughly 2 [kg]. To cover the entire 20 [cm] by sufficient magnetic flux, 5 yokes are used with spacing of 1.5 [cm] to accommodate the wires required for the magnetic field. The weight of the hall sensors is very low and can be considered negligible compared to the yokes. In total, the weight of the MFL detection system can be estimated to be 11 [kg], accounting for the necessary wiring and sensors.
Integration into the robot - The MFL sensor system is going to be mounted in the middle of the robot, slightly moved towards the front to make room for the ultrasound sensor. The decision to place the MFL system in the middle of the robot stems from the fact that it will be one of the heaviest parts in the robot assembly, hence we want to distribute its weight as equally as possible across all axis' of rotation. While ideally the MFL sensor would be mounted exactly in the middle of the robot, we need to reserve some space for the much lighter ultrasonic sensor, hence the slight shift forward. Considering that the overall length of the robot is roughly 60 [cm] and the length of the sensor assembly is 25 [cm], it would be placed 12.5 [cm] from the "nose" of the robot (a 5 [cm] shift forward compared to total center position).
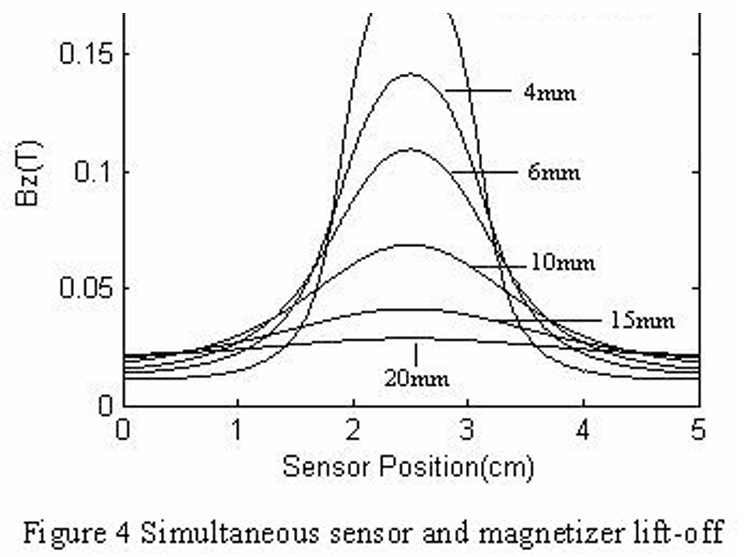
Lift-off distance - The lift-off distance of both the Hall Effect sensors and the magnetic yokes dictates how sensitive the first will be and how well the later an saturate the the hull of the ship. The further both of them are from the surface, the readings will be less accurate and more susceptible to noise and other EMI forms. We need to insure that the sensors and the yokes are close enough to the surface for good readings. That can be done by placing the sensor system roughly 6-8 mm from the surface of the hull and installing a scraping tool that will insure that even if some biofouling is present on the hull, it will get scraped away and not interfere with the sensor.
Power requirements - Doing some calculations to find the MMF required to generate 1.8 [T] of flux in a hull 5 [cm] in thickness and 8 [mm] lif-off distance, it is found that we need about 11500 [A · Turns]. to generate the required MMF. We will use 2000 turns of wire to keep the current low, and find that we need 5.75 [A] of current. Next, using 18awg wire and knowing the total length of the required wire (0.12 · 2000 = 240 [m]) and its cross-section, we can calculate the total resistance of the current carrying wire, which amounts to 4.95 [Ohm]. From here, using the formula P = I2 · R, we get that we need roughly 165 [W] per yoke or 825 [W] in total to power the MFL sensors. The power required by the Hall Effect sensors themselves is miniscule and is hence neglected.
Magnetic attraction force - Using some calculations derived from the used power in the electro magnet, we can calculate the amount of attraction force that the magnet would generate. Assuming full power is used, the attraction force between the magnet and the hull will reach roughly 5800[N]. That amount of attraction force is enough to keep the robot attached to the hull and also provide enough friction between the wheels and the hull to keep the robot attached in strong underwater currents. Since the electromagnet is relatively close to the hull, the lift-off distance doesn't impact the force in a significant way.
EMI shielding - While the whole system can't really be completely isolated from EMI producing devices inside the ship, like Variable Frequency Drives (VFD) or electrical generators, a base line can be established by either passing another robot that will measure the background magnetic field strength to then filter out the noise, or by letting our robot run over the whole ship twice if the time allows it. That way, most of the EMI will be filtered out and not influence the readings of the MFL sensors.
Work time estimation
Based on the conducted research, crucial parameters for the MFL detection system can be compiled to better understand its integration into the robotic system. In order to do so, some assumptions will be made, taking the largest ship possible to make a case for the "worst" possible scenario.
| Length [m] | Height [m] | Beam [m] |
|---|---|---|
| 400 | 32 | 60 |
Total hull area: 400 · 32 · 2 + 60 · 400 = 25600 + 24000 ≈ 50000 [m2]. Another 25% will be added to this area to account for things such as the bow, stern, and various extrusions such as the bow flare and hull curvature.
Final total hull area comes to 60000 [m2].
Taking an Ultra Large Container Vessel (ULCV), like the Maersk Triple E-class ships, we can correlate the total hull area to the MFL scanner effective area and the scanners speed to calculate the amount of time it would take. In the hull area calculations, the underside of the ship is also taken into account as big container ships usually have flat bottoms that the robot would be able to stick onto.
| Robot and scanner parameters | |
|---|---|
| Velocity | 5 m/s (as an upper limit) |
| Scanner dimensions | Circular scanner with 0.2m diameter for precise crack detection. |
| Scanned area per second | Treating the scanner as a line scanner, 1 [m2/s] |
Taking into account those assumptions, its possible to calculate the amount of time it would take for a robot to scan an entire ship, which calculates to roughly to 17 hours.
That amount of time accounts solely for the ability of the MFL sensor to reliably pick up cracks and defects on the hull of the ship. In practice, the system might be limited by other, more mechanical, factors. With that in mind, the MFL sensor would not present a technical limit on the speed of work of the robot.
| Size | 0.25x0.2x0.05 [m] |
| Weight | 11 [kg] |
| Scanning diameter | 0.2 [m] |
| Placement in the robot | Shifted 0.05 [m] to the front from the absolute center of the robot |
| Lift-off distance | 6-8 [mm] |
| Power requirement | 875 [W] |
| Attraction force | ~6000 [N] |
| Maximum speed | 5 [m/s2] |
| Work completion time (maximum) | 17 [hours] |
Non-destructive inspection using ultrasound system
Ultrasonic testing (UT) is a non-destructive testing method widely used for ship hull inspection that enables thorough assessment without damaging the vessel structure. This technique employs high-frequency sound waves (typically 0.5-25 MHz) to detect internal flaws, measure thickness, and evaluate material integrity of hull plating and structural members. The process relies on the principle that sound waves travel through homogeneous materials at predictable velocities but reflect or scatter when encountering interfaces, discontinuities, or defects. Within this method, various techniques were developed[26]:
- Ultrasonic Thickness Measurement (UTM): UTM is a non-destructive technique that measures the local thickness of a structure by analyzing the difference in arrival times between direct and reflected waves. This method requires ultrasonic sensors to be in direct contact with the hull surface, which must be cleaned of coatings, corrosion, and biofouling. The final measurement locations are chosen based on a comprehensive survey to ensure they represent the average hull condition.
- Pulse-Echo Ultrasonic Testing (PEUT): PEUT is used to analyze internal defects within a structure. It employs a system where one sensor generates and receives ultrasonic waves. By examining the maximal amplitude and velocity of echoes reflected by defects, the size, location, and nature of the defects can be determined. This technique is commonly used for inspecting hull welds, constituent materials, and measuring thickness.
- Phased Array Ultrasonic Testing (PAUT): PAUT is advantageous for complex structures as it uses an array of ultrasonic elements to focus and scan the area of interest without moving the probe. By controlling each element in the array, the energy of the wavefront can be bent, deflected, and focused to produce cross-sectional images of defects, making it easier to analyze intricate structures.
- Guided Wave Ultrasonic Testing (GWUT): GWUT is designed for long plate-like structures and uses guided ultrasound waves, such as Lamb waves, to detect and locate defects at remote locations. These waves can propagate over significant distances with minimal attenuation and energy loss, making them suitable for inspecting thin-wall structures. However, GWUT may not be applicable to curved structures or those with varying geometries.
- Time-of-Flight Diffraction (TOFD) Ultrasonic Testing: TOFD determines the position and size of defects by measuring the time of flight of ultrasonic pulses rather than the amplitude of the reflected signal. This method uses a pair of ultrasonic probes, with the transmitter emitting a pulse and the receiver picking it up. If a crack is present, the waves are diffracted from the crack tip, allowing the size of the crack to be calculated.
- Air-Coupled Ultrasonic Testing (ACUT): ACUT uses air as the coupling medium instead of traditional liquid couplant like water or gel. This non-contact method eliminates the drawbacks of contact ultrasonic testing, making it more efficient for health monitoring and non-destructive testing. ACUT is particularly suitable for inspecting large-scale hulls made of metal or composite materials.
Working principle of UTM
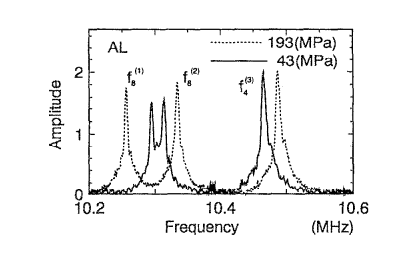
In this project, it is decided that the MFL is used for localization of cracks and deformations on the vessel due to its advantages mentioned above. However, it is quite difficult to measure the depth of deformation, or the thickness loss due to corrosion with just MFL. Such challenge is resolved by using a simpler yet robust method: the UTM technique. There exists three main principle of UTM: resonance method, Lamb Law method and pulse reflection method. In the first method, by emitting ultrasonic waves of varying frequencies onto a workpiece, resonance occurs when the thickness equals a multiple of half the wavelength[27]. This method achieves high accuracy (≤0.1mm) with smooth surface finishes, which is not always the case for ship hull due to biofouling. For the second one, Lamb waves occur when ultrasonic frequency relates to both incident angle and workpiece thickness. These waves propagate in thin plates with wavelengths that are comparable to the plate thickness. The key to thickness measurement is that their propagation characteristics (velocity, dispersion) depend directly on the frequency-thickness product[28]. While they excel at measuring thin materials, when Lamb wave modes propagate in a fluid medium, they may suffer leakage by mode conversion into the fluid. Lastly, the pulse echo method sends ultrasound through homogeneous materials, with propagation time proportional to thickness. This method works on rougher surfaces, making it versatile for various material conditions.
UTM using resonance method
UTM using Lamb Law method
Another method that is also popular due to its measurement accuracy in thin metal plates is to use Lamb waves. These waves are guided elastic waves that propagate through the entire thickness of a thin plate or shell structure. They exist in two basic modes: symmetric (S) modes, in which the plate deforms symmetrically about the midplane, and asymmetric (A) modes, in which the plate deforms asymmetrically[32]. Lamb waves are highly dispersive, meaning their velocity depends on the frequency and plate thickness. This dispersion relationship is described by the Rayleigh-Lamb equations: tanh(qh) / tanh(ph) = -[4k2qp / (k2 - q2)2]a, where ℎ denotes the half-thickness of the plate in m, 𝑘 = 2𝜋 /𝜆 is the wavenumber, 𝜆 is the wavelength in m; p and q are determined by p2 = 𝜔2 / c2L - k2; q = 𝜔2 / c2L - k2, in which 𝜔 is the pulsation in rad/s, 𝑐L and 𝑐T are respectively the longitudinal and transverse velocities related to the material in m/s. For S mode, a = 1 while a = -1 for A mode waves. There are three ways to get the thickness of the material from the echoed Lamb waves: dispersion curve method[33], cut-off frequency method[34], and zero-group velocity method[35]. For this course, it is not necessary to dive deeper to the technical details of these methods. One difficulty of this technique is mode conversion at structural features such as wields and fasteners. To overcome this challenge, various solutions have been studied, ranging from signal filtering with finite element modelling[36] to deep learning[37]. Another problem fluid medium where leakage may occur during the measurement, making the pulse propagates into the water at a radiation angle dictated by Snell's law[38]. Therefore, the ultrasonic transducers array needs to be watertight during the measurement. Lastly, the characteristics of Lamb waves are also influenced by the roughness of the surface. It has been found that phase velocity of Lamb waves is slightly affected by surface roughness, whereas Lamb wave attenuation increases with surface roughness and frequency[39].
UTM using pulse reflection method
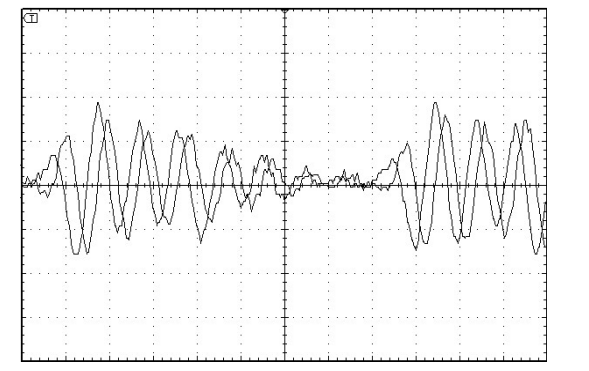
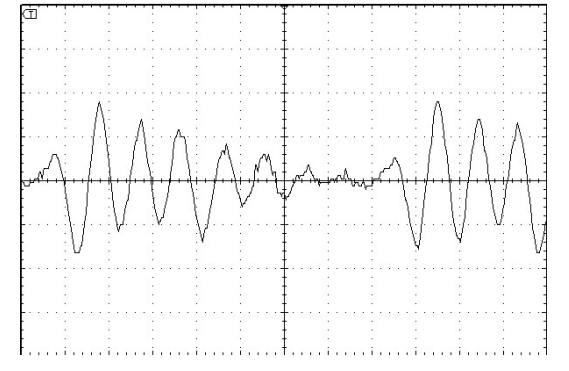
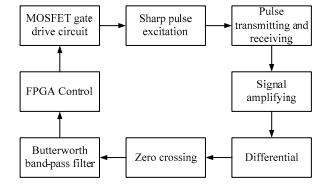
In actual field measurements, where flat surfaces are not always the case, marginal errors were expected from the implementation of the aforementioned method. For instance, some operators reported large fraction of erroneous result in repeatability and reliability test[42], while a paper found that the 95% thickness confidence interval in some measurements was as wide as ±1.1 mm[43]. One method that can mitigate such effect is the pulse reflection method. Fundamentally, the thickness in m D of the workpiece can be determined by D = ½ v(T0 - 2si / vc), where v is the velocity of the ultrasonic wave in the steel plate in m/s, T0 is the time delta between the transmission of the wave and its first echo, si is the length of the probe and and vc is the velocity of the wave in the probe. Depending on the medium (i.e., underwater, in air), vc will hold different values. One drawback of this method comes from the complexity of signal processing caused by the attenuation of some composite sound [40]. Also in [40], one method to solve such problem has been studied. For this method, the system employs four key approaches to improve accuracy: Extracting peak echo signal values to minimize amplitude fluctuations from noise; Using differential circuits with zero-crossing comparators to effectively isolate peak echo signals; Measuring time between echo signals via dual peak detection, eliminating the need to measure ultrasonic propagation in the probe. In other words, when the initial pulse reaches the bottom surface of the vessel, part of it is reflected back to the transducer while the rest continues to oscillate within the material and then getting reflected back little by little. The time difference between the first and and second echo determines the round trip time of the signal within the material, which leads to its thickness. From this discussion, the thickness equation can be calculated by D' = ½ v(T1 - T0), where T1 and T0 are the time between the first echo and the second echo respectively. The pulse reflection method extracts secondary echo signals for analysis, requiring minimal surface quality. This allows measurement of materials with rough, concave, or painted surfaces while maintaining good echo signal quality. Another problem that is proprietary to this design is its dependency to the surface's normal vector. If the deformation leads to the inner surface being at an extreme angle compared to the outer surface, it would result in a delay in round trip time, affecting the accuracy of the measurement.
Design choices for ship hull inspection
Measuring method - From the information above, a summary of the advantages and drawbacks of the three methods is derived. Firstly, the resonance method offers high accuracy for thin materials by measuring standing waves but struggles with thicker or multi-layered structures. Secondly, Lamb waves method excels at detecting flaws in plate-like structures and can cover large areas efficiently, though it requires complex signal interpretation and is sensitive to material properties. The pulse-echo method, widely adopted in maritime applications, provides reliable measurements across varying thicknesses by timing reflected ultrasonic pulses, though it may have limitations in very thin materials or those with high attenuation. Therefore, it has been decided that the pulse reflection method will be implemented.
Construction - Since the robot is a single unit with all peripherals attached to it, the ultrasonic sensor needs to be compact while providing robust and accurate measurements. Most ultrasonic transducers uses technology such as piezoelectric crystal[45] or electromagnetic vibration induction[29], therefore proper electromagnetic shielding is important to protect the sensors from potential interference or damages. For the pulse echo method, piezoelectric crystals based sensor comes with smaller size while providing the same result as other transducer technologies. The sensor is then placed in a probe made from aluminium or copper, and it is also grounded to shield the internal components from the electromagnetic interference caused by the MFL during operation. Standard contact probes are often cylindrical, measuring approximately 25-40 mm in diameter and 50-80 mm in length. Since the height of the MFL is 50 mm, the probe is also chosen to be at the same height for easier design process of the robot. The diameter can be designed at 40 mm, since its radiating surface influences the narrowness of the beam pattern. A larger diameter transducer will produce a narrower beam, which can improve resolution by focusing the sound waves more precisely[46]. The weight typically ranges from 200-500 g, depending on the material and internal construction. Currently, some underwater ultrasonic thickness measurement device can provide high resolution readings of 0.01 mm, such as an underwater ultrasonic sensor from Checkline Europe B.V.[47]
Integration - As the sensor probe needs to be in contact with the measuring surfaces, the sensor probe can be attached to a motorized arm that extends or retracts depending on the situation. The arm should be able to provide a height support for up to 10 cm. Due to the construction and location of the MFL sensor, the thickness sensor can be positioned behind it, and the distance between the two sensors needs to be taken into account. Therefore, a distance of 2 cm from the wall of the MFL magnet can be chosen. To increase measurement accuracy, 5 pulses is generated with a time difference of 0.2 ms between them and the average value is taken, allowing the echoes from a pulse to be attenuated to a negligible amplitude before feeding another pulse to the workpiece. Therefore, for each measurement a total duration of 4 s is possible, accounting the additional time taken to move the robot arm and to settle the probe to touch vessel with minimal vibration.
| Properties | Parameters |
|---|---|
| Size of probe (diameter x height) | 40 mm x 50 mm |
| Weight | 400 g |
| Type | Piezoelectric transducer |
| Placement in the robot | 2 cm behind the MFL sensor |
| Arm height support | Up to 10 cm |
| Time for each measurement | 4 s |
| Resolution | Up to 0.01 mm |
| Power consumption | Negligible |
Localization
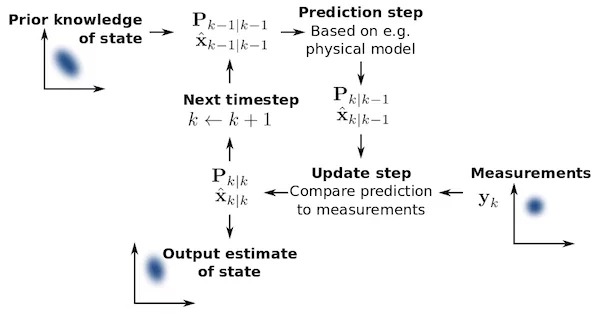
One of the sensors that are normally used to find an orientation and position in robotics is the inertial measurement unit. This sensor measures the linear acceleration and angular velocity of the robot. These can be integrated to find the linear position, linear velocity and angular orientation. With this the position of the robot can be estimated at every timestep. Over time this measurement becomes inaccurate due to the imperfect digital integration methods as well as imperfections in the sensor itself. Another method to find the location of the robots is by using a model and track the position by remembering the amount of rotation applied to the wheels. This method will also be imprecise in the long run due to things like slippage in the wheels and imperfections in the model. These methods can be combined in what is called a Kalman filter. The Kalman filter takes the measurement data and the previous knowledge of the state and estimates the next state using a physical model.[48]
The state in this implementation would be position, speed, acceleration and orientation. The starting conditions of this can be found by putting the robot where the position is already known, such as on one of the hull markers. The physical model would be an estimation of the position when the robot moves forward in a straight line on the curved surface of the hull.
Simulation
In order to check if the robot movement is feasible, a simulation was performed. From research, two viable options came forth. The first option was Matlab combined with a render and physics engine, which would be Unreal Engine or Unity 3D. The other option was the Gazebo simulator. After some discussion the Gazebo simulator was chosen. The Gazebo simulator has more widespread use and has more examples online. Gazebo also allows the robot to be programmed in C++, in contrast to the simulink control of the other option. The version used for this simulation was Gazebo Harmonic (LTS).
The team started by downloading Gazebo Harmonic and creating a GitHub repository, which can be found here. After that, the 3D models for the ship and robot were created. These models were made in Blender and exported to OBJ files. After that, the team split into two parts: one that worked on movement and the other that worked on localization. Movement involved having the robot move over the surface as well as having the robot stick to the hull, which were both done by applying forces and torques to the robot. The localization involved setting up the IMU sensor in the simulation, and reading and processing the data.
The movement started off by having the robot sticking to the hull, as this already turned out to be a challenge. In order for the robot client code to add force to the robot, a connection with the simulation needs to be established. In Gazebo, this works via topics. Topics can have subscribers and publishers. A publisher creates messages and posts them to the topic. A subscriber then subscribes to the same topic and reads the messages that are posted there. The subscribing and publishing to a topic in C++ is done through the Gazebo msgs.hh and transport.hh libraries, which are relatively straightforward and were not a problem to implement. However, subscribing to a topic in the Gazebo simulator turned out the be very difficult. There a two main ways of subscribing to a topic in the Gazebo sim. The first way is by adding a built-in plugin from the GUI, which can not be saved and has to be opened every time the simulation is opened. The second way is by making a plugin and adding it to the sdf file. The team started by first trying to make a plugin. This plugin would run when opening the simulation and would subscribe to the right topic. This is where the problems started to arise. The plugin did not want to subscribe to the topic and add the force to the robot. After a lot of tries, a decision was made to use the built-in plugin, because the creation of our own plugin took a lot of time without results, and the other parts of the movement still needed to be made. Our own plugin can still be found in the GitHub repository under the folder "ForceSubPlugin". With this decision made, the magnetic force could be added to the robot via C++. To debug the robot client code a function that printed the location, velocity, applied force, applied torque, and the time since simulation start was added.
The localization consists of two parts and can be implemented in the C++ program. In the gazebo sdf world file sensors can be added that publish their result in a topic when the simulation is running. The code can then read these measurements to predict a position on the ship hull. The code can also read the ship hull model file and extract the information about the polygons. With some mathematical calculations the center of the polygons and the normal vector of the polygons can be calculated. In the physical model the robot moves forward over the curved surface just calculated and predicts the location of the robot. These results can then be combined through the Kalman filter to get a more accurate estimate of the position. With the estimation of the location of the robot itself the location of the cracks can be found.
Next, the team star created the main loop of the robot client. This main loop consists of an initialization function and a run function. The initialization sets up the topic subscribing and publishing as well as the variable and data needed for robot operation. The run function runs continuously and waits each time for the start of a new tick in the simulation. The run contains the code for adding the magnetic force, the algorithm for driving the robot, and the code for publishing the forces and torques. The robot movement is implemented as follows. The robot starts off in the begin state, where it saves the time. Then, the robot moves into the straight state. During the straight state, a force scaled by the speed is applied to the robot in the forward direction of the robot. This continues until the robot has moved for a certain amount of time, after which the state will change to turning. While in the turning state, a constant torque is applied to the robot in the robot upward direction until the robot has rotated 90 degrees. The robot client knows when the robot has rotated 90 degrees by comparing the current forward vector with the forward vector before rotating. After rotating, the robot will move forward for a short time by changing its state to straight. Then, the robot changes its state back to turning and rotates another 90 degrees. When these rotations are finished. the robot will change the state to begin and repeat the pattern. During testing, some problems arose. The robot would sometimes overshoot when rotating or when changing state from straight to turning. To counteract this problem, a force or torque was applied in the opposite direction when switching states. A waiting time was also added between the state switching to ensure the robot would stop. More testing showed that the robot would still sometimes overshoot when rotating. However, after overshooting, the robot would move in the correct direction instead of the direction it was facing. Investigating the pose parameter in the simulation showed that this problem was only a visual proble because the robot was facing the right direction in the pose data. Following this bug, another problem showed up. The robot would often not be in a standstill when rotating. To fix this bug, code was added that would apply a braking force to the robot when the robot needed to stop. This solved the problem.
At the end, a check was added that would simulate the finding of a crack/defect in the hull, after which the robot would stop movement, and the simulation would finish. When the crack was found, a message would appear with the location of the crack, and the location would also be written to a file. Pictures containing possible data from the utrasonic and MFL sensors were also added to the files. For the presentation a video was made of the simulation. This video also contained two animation which show robot operation and sensors. The video can be watche from this link.
In conclusion, the simulation shows that the movement using the magnet and wheels, and the localization using the IMU sensor is a feasible method for robot movement along the ship hull. The simulation did sometimes run into some problems like the visual bug with rotating and that the robot would sometimes randomly fly of into the distance. However, most of the time the robot would run without problems.
Conclusion
In our research we focused on exploring the feasibility and technical side of an autonomous robotic system for ship hull inspection using a Magnetic Flux Leakage sensor and an Ultra-Sonic sensor. We surveyed users to better understand the needs and requirements of the people who are going to make use of our system. Afterwards the survey, the best solutions were identified based on the feedback, such as fast sensing ability as well as precision when localizing the defect. After some literary research, the decision was to use the MFL sensor for its fast scanning ability, augmented by the circular Hall Sensor array for better crack orientation identification, and an Ultra-Sonic sensor for high precision crack inspection for maximum information extraction, making it easier for users to interpret the data and plan maintenance or repairs more effectively.
After having an idea of what the robot needs to do and its specification, a simulation in the Gazebo software was made to both illustrate and verify the ability of the robot to move along the hull, localize the cracks, and report on them. The simulation showed promising results for the identification and localization of cracks.
In conclusion, the team made a deep theoretical feasibility study about a ship hull inspection robot and showed good results.
Logbook
| Name | Total Time (Hours) | Work Description |
|---|---|---|
| Anton Veshnyakov | 7 | Attended lecture (3h), Organized and structured the wiki page (1h), Group meeting (1h), Organizing the planning chart (1h), Research of problem statement and objectives (1h) |
| Luuk Kool | 7 | Attend lecture (3h), search for papers (1h) / meeting (1h)/ research sensors(2h) |
| Anh That Tuan Ton | 5 | Searched for relevant articles (1h), research paper (4h) |
| Luca | 5 | Attended lecture (3h), meeting (1h), research on needed components (1h) |
| Simon | 5 | meeting, reading about non-destructive inspection techniques for ship inspection. |
| Name | Total Time (Hours) | Work Description |
|---|---|---|
| Anton Veshnyakov | 10 | Meeting with group and company research (4h), Research of relevant literature (4h), Second group meeting (2h) |
| Luuk Kool | 8 | Meeting with group (4h), meet again (1h), read papers (3h) |
| Anh That Tuan Ton | 7 | Meeting with group (4h), research for additional company (1h), second group meeting (2h) |
| Luca | 5 | Meeting with group (4h), messaging companies (1h) |
| Simon | 9 | meeting with group (4h), communicating with the company Damen (1h) research for the cost of the actual inspections of the ships (4h) |
| Name | Total Time (Hours) | Work Description |
|---|---|---|
| Anton Veshnyakov | 18 | Meeting with group (4h), Robot simulation software research (4h), Meeting with simulation researcher (2h), Second meeting with the group (2h), Research and summery of MFL (6h) |
| Luuk Kool | 11 | Meeting with group (4h), second meeting with group (2h), installing and getting to know gazebo (4h), find 3d model for hull (1h) |
| Anh That Tuan Ton | 12 | Meeting with group (4h), second meeting with group (2h), research on ultrasonic testing methods (4h), study other state of the art papers (2h) |
| Luca | 8 | Meeting with group(4h), getting familiar with gazebo (3h), creating a 3d model for the robot(1h) |
| Simon | 12 | inverviewing Damen (2h), revising the problem statement (1h), meeting with the team(4h), Researching maritime law and regulations (3h) |
| Name | Total Time (Hours) | Work Description |
|---|---|---|
| Anton Veshnyakov | 9 | Meeting with group (3h), research and writing about MFL (6h) |
| Luuk Kool | 12 | meet with group (4h), second meeting (2h), work on gazebo (6h) |
| Anh That Tuan Ton | 9 | Meeting with group (3h), sensor research and writing wiki (6h) |
| Luca | 8 | Meeting with group (3h), working on movelment in gazebo(4h), do a force analysis of the robot(1h) |
| Simon | 6 | writing the interview with Damen (2h) meeting with the team (4h) |
| Name | Total Time (Hours) | Work Description |
|---|---|---|
| Anton Veshnyakov | 13 | Meeting with group (4h), MFL research and wiki writing (9h) |
| Luuk Kool | 10 | Meeting with group (4h), working on gazebo (6h) |
| Anh That Tuan Ton | 12 | Meeting with group (4h), writing wiki and sensor research (8h) |
| Luca | 12 | Meeting with group (4h), Working on the gazebo sim (8h) |
| Simon | 12 | meeting with group (4h) working on the state of the art(2h) working on the blender render for presentation (4h) |
| Name | Total Time (Hours) | Work Description |
|---|---|---|
| Anton Veshnyakov | 10 | Team meeting (7h), MFL integration writing (3h) |
| Luuk Kool | 12 | meeting with group (6h), working on gazebo (4h), writing wiki (2h) |
| Anh That Tuan Ton | 10 | Meeting with group (6h), writing wiki (4h) |
| Luca | 14 | Meeting with group(6h), working on gazebo sim(8h) |
| Simon | 14 | meeting with group (6h), working on the blender render for presentation (8h) |
| Name | Total Time (Hours) | Work Description |
|---|---|---|
| Anton Veshnyakov | 9 | Group meeting (6h), presentation (3h) |
| Luuk Kool | 13 | Meeting with group (4h), presentation(3h), work on wiki (6h) |
| Anh That Tuan Ton | 10 | Group meeting (6h), presentation (3h), work on wiki (1h) |
| Luca | 10 | Meeting with group (4h), Presentation (3h), Work on wiki (4h) |
| Simon | 11 | meeting with group (4h), presentation (3h), working on the state of the art (4h) |
Bibliography
- ↑ International Maritime Organization. (n.d.). Maritime Safety Committee (MSC). IMO. Retrieved March 15, 2025, from https://www.imo.org/en/MediaCentre/MeetingSummaries/Pages/MSC-Default.aspx
- ↑ THE MARITIME SAFETY COMMITTEE. (2019). RESOLUTION MSC.461(101) (adopted on 13 June 2019) AMENDMENTS TO THE INTERNATIONAL CODE FOR THE ENHANCED PROGRAMME OF INSPECTIONS DURING SURVEYS OF BULK CARRIERS AND OIL TANKERS, 2011 (2011 ESP CODE). https://wwwcdn.imo.org/localresources/en/KnowledgeCentre/IndexofIMOResolutions/MSCResolutions/MSC.461(101).pdf
- ↑ Eddyfi. (n.d.). VT-M460, Large Class Crawler. https://www.eddyfi.com/doc/ProductsDetails/Magg-480.jpg
- ↑ 4.0 4.1 Eddyfi Technologies VersaTraxTM inspection crawlers. (n.d.). Eddyfi. Retrieved March 3, 2025, from https://www.eddyfi.com/en/product/versatrax-inspection-crawlers#OnSpec
- ↑ 5.0 5.1 5.2 MAG Utility Crawler For Sale | Deep trekker. (n.d.). Deep Trekker. Retrieved March 13, 2025, from https://www.deeptrekker.com/products/utility-crawlers/dt640-mag-utility-crawler
- ↑ 6.0 6.1 6.2 Eddyfi Technologies. (2023). Getting started with VERSATRAXTM M480. In Eddyfi. Retrieved March 16, 2025, from https://content.eddyfi.com/m/5ac27488f7ff1423/original/VersaTrax-M480-User-Manual.pdf?_gl=1*2hsnay*_ga*MTc1MTQ4MjY0LjE3NDQxNDE5NjE.*_ga_HHBGC3FWLF*MTc0NDI4NDAzMy4zLjAuMTc0NDI4NDAzMy42MC4wLjExMDk2OTA1OA..*_ga_Q4YHE7GCQH*MTc0NDI4NDAzMy4yLjAuMTc0NDI4NDAzMy42MC4wLjA.
- ↑ Eddyfi Technologies. (n.d.). Remote visual inspection and ultrasonic testing for corrosion assessment. In Eddyfi. Retrieved March 16, 2025, from https://content.eddyfi.com/m/4ab1dcdcf15db316/original/VersaTrax-NDT-Technical-Specification-Sheet.pdf?_gl=1*2on9at*_ga*MTc1MTQ4MjY0LjE3NDQxNDE5NjE.*_ga_HHBGC3FWLF*MTc0NDE0MTk2MC4xLjEuMTc0NDE0MjE3OS4xOS4wLjQ3MjgxNjczOQ..*_ga_Q4YHE7GCQH*MTc0NDE0MTk2MC4xLjEuMTc0NDE0MjE3OS4xOS4wLjA.
- ↑ Blueye Robotics. (n.d.). Blueye X1 | Underwater drone with gripper. https://www.blueyerobotics.com/rov/x1
- ↑ Achieving 1-Mbps/300-m underwater transmission and wireless remotely operated vehicle (ROV) using underwater acoustic communication- Progress towards the Extreme Coverage Extension that 6G-IOWN is aiming for - | Press Release | NTT. (2022, November 1). NTT | Nippon Telegraph and Telephone Corporation. https://group.ntt/en/newsrelease/2022/11/01/221101a.html
- ↑ 10.0 10.1 E. Li, Y. Chen, Z. Yuan and J. Wang, "Train Wheel Magnetic Flux Leakage Testing Method Based on Local Magnetization Enhancement," in IEEE Transactions on Instrumentation and Measurement, vol. 72, pp. 1-9, 2023, Art no. 6002409, doi: 10.1109/TIM.2023.3251393.
- ↑ Y. Long et al., "A Novel Crack Quantification Method for Ultra-High-Definition Magnetic Flux Leakage Detection in Pipeline Inspection," in IEEE Sensors Journal, vol. 22, no. 16, pp. 16402-16413, 15 Aug.15, 2022, doi: 10.1109/JSEN.2022.3190684.
- ↑ "Roundup: Automotive Hall Effect Sensors Find New Life," All About Circuits, accessed March 19, 2025. [Online]. Available: https://www.allaboutcircuits.com/news/roundup-automotive-hall-effect-sensors-find-new-life/
- ↑ Shi Y, Zhang C, Li R, Cai M, Jia G. Theory and Application of Magnetic Flux Leakage Pipeline Detection. Sensors (Basel). 2015 Dec 10;15(12):31036-55. doi: 10.3390/s151229845. PMID: 26690435; PMCID: PMC4721765.
- ↑ 14.0 14.1 14.2 14.3 W. Gong, M. F. Akbar, G. N. Jawad and F. Zhang, "Surface Crack Size Estimation Based on Quantification and Decoupling of Magnetic Flux Leakage (MFL) Signals of Circular Array Sensors," in IEEE Sensors Journal, vol. 24, no. 10, pp. 16752-16762, 15 May15, 2024, doi: 10.1109/JSEN.2024.3379401.
- ↑ Feng B, Wu J, Tu H, Tang J, Kang Y. A Review of Magnetic Flux Leakage Nondestructive Testing. Materials (Basel). 2022 Oct 20;15(20):7362. doi: 10.3390/ma15207362. PMID: 36295427; PMCID: PMC9610001.
- ↑ 16.0 16.1 Dehui Wu, Zhitian Liu, Xiaohong Wang, Lingxin Su, Composite magnetic flux leakage detection method for pipelines using alternating magnetic field excitation, NDT & E International, Volume 91, 2017, Pages 148-155, ISSN 0963-8695, https://doi.org/10.1016/j.ndteint.2017.07.002.
- ↑ Dehui Wu, Zhitian Liu, Xiaohong Wang, Lingxin Su, Composite magnetic flux leakage detection method for pipelines using alternating magnetic field excitation, NDT & E International, Volume 91, 2017, Pages 148-155, ISSN 0963-8695, https://doi.org/10.1016/j.ndteint.2017.07.002.
- ↑ Mohd Aufa Hadi Putera Zaini, Mohd Mawardi Saari, Nurul A'in Nadzri, Zulkifly Aziz, Detection of crack on a mild steel plate by using a magnetic probe incorporating an array of fluxgate sensors, Materials Today: Proceedings, Volume 109, 2024, Pages 74-80, ISSN 2214-7853, https://doi.org/10.1016/j.matpr.2023.06.428.
- ↑ Ali Sophian, Gui Yun Tian, Sofiane Zairi, Pulsed magnetic flux leakage techniques for crack detection and characterisation, Sensors and Actuators A: Physical, Volume 125, Issue 2, 2006, Pages 186-191, ISSN 0924-4247, https://doi.org/10.1016/j.sna.2005.07.013.
- ↑ 20.0 20.1 Haotian Wei, Shaohua Dong, Lushuai Xu, Fan Chen, Hang Zhang, Xingtao Li, Internal inspection method for crack defects in ferromagnetic pipelines under remanent magnetization, Measurement, Volume 242, Part A, 2025, 115907, ISSN 0263-2241, https://doi.org/10.1016/j.measurement.2024.115907.
- ↑ Eddyfi Technologies, “About Us.” [Online]. Available: https://www.eddyfi.com/en/aboutus. [Accessed: Mar. 23, 2025].
- ↑ Eddyfi Technologies, “Pipescan HD.” [Online]. Available: https://www.eddyfi.com/en/product/pipescan-hd. [Accessed: Mar. 23, 2025].
- ↑ 23.0 23.1 Ping Wang, Yunlai Gao, GuiYun Tian, Haitao Wang, Velocity effect analysis of dynamic magnetization in high speed magnetic flux leakage inspection, NDT & E International, Volume 64, 2014, Pages 7-12, ISSN 0963-8695, https://doi.org/10.1016/j.ndteint.2014.02.001.
- ↑ Yang, L., Zhang, G., & Liu, G. (2008). Effect of Lift-off on Pipeline Magnetic Flux Leakage Inspection. 17th World Conference on Nondestructive Testing, Shanghai, China, 25-28 Oct 2008. e-Journal of Nondestructive Testing Vol. 13(11). https://www.ndt.net/?id=6674
- ↑ “Triple-E Class Container Ship - Ship Technology,” Ship Technology, [Online]. Available: https://www.ship-technology.com/projects/triple-e-class-container-ship/?cf-view. [Accessed: Mar. 24, 2025].
- ↑ Bosen Lin, Xinghui Dong, Ship hull inspection: A survey, Ocean Engineering, Volume 289, Part 1, 2023, 116281, ISSN 0029-8018, https://doi.org/10.1016/j.oceaneng.2023.116281.
- ↑ Shi Yiwei. Ultrasonic detection[M]. Beijing: Mechanical Industry Press, 2005:94-96.
- ↑ K. R. Leonard, E. V. Malyarenko, and M. K. Hinders, “Ultrasonic lamb wave tomography,” Inverse Problems, vol. 18, no. 6, p. 1795, nov 2002. [Online]. Available: https://dx.doi.org/10.1088/0266-5611/18/6/322
- ↑ 29.0 29.1 29.2 M. Hirao, H. Ogi, H. Fukuoka; Resonance EMAT system for acoustoelastic stress measurement in sheet metals. Rev. Sci. Instrum. 1 November 1993; 64 (11): 3198–3205. https://doi.org/10.1063/1.1144328
- ↑ Fan, Wei, and Pizhong Qiao. "Vibration-based damage identification methods: a review and comparative study." Structural health monitoring 10.1 (2011): 83-111.
- ↑ S. A. Kudus, Y. Suzuki, M. Matsumura, and K. Sugiura, “Vibration- response due to thickness loss on steel plate excited by resonance frequency,” IOP Conference Series: Earth and Environmental Science, vol. 140, no. 1, p. 012123, apr 2018. [Online]. Available: https://dx.doi.org/10.1088/1755-1315/140/1/012123
- ↑ D. C. Worlton, “Ultrasonic testing with lamb waves,” General Electric Co., Hanford Atomic Products Operation, Richland, Wash., Tech. Rep., 09 1956. [Online]. Available: https://www.osti.gov/biblio/4356069
- ↑ Qi Chen, Kailiang Xu, Dean Ta, High-resolution Lamb waves dispersion curves estimation and elastic property inversion, Ultrasonics, Volume 115, 2021, 106427, ISSN 0041-624X, https://doi.org/10.1016/j.ultras.2021.106427.
- ↑ Sebastian Heinlein, Stefano Mariani, Josh Milewczyk, Thomas Vogt, Peter Cawley, Improved thickness measurement on rough surfaces by using guided wave cut-off frequency, NDT & E International, Volume 132, 2022, 102713, ISSN 0963-8695, https://doi.org/10.1016/j.ndteint.2022.102713.
- ↑ C. Prada, O. Balogun, T. W. Murray; Laser-based ultrasonic generation and detection of zero-group velocity Lamb waves in thin plates. Appl. Phys. Lett. 7 November 2005; 87 (19): 194109. https://doi.org/10.1063/1.2128063
- ↑ F. Yeo, P. Fromme; Guided Ultrasonic Wave Inspection of Corrosion at Ship Hull Structures. AIP Conf. Proc. 6 March 2006; 820 (1): 202–209. https://doi.org/10.1063/1.2184530
- ↑ Othmane-Latif Ouabi, Pascal Pomarede, Nico F. Declercq, Neil Zeghidour, Matthieu Geist, Cédric Pradalier, Learning the propagation properties of rectangular metal plates for Lamb wave-based mapping, Ultrasonics, Volume 123, 2022, 106705, ISSN 0041-624X, https://doi.org/10.1016/j.ultras.2022.106705.
- ↑ Y. Roh and B. T. Khuri-Yakub, "Finite element analysis of underwater capacitor micromachined ultrasonic transducers," in IEEE Transactions on Ultrasonics, Ferroelectrics, and Frequency Control, vol. 49, no. 3, pp. 293-298, March 2002, doi: 10.1109/58.990939.
- ↑ Damien Leduc, Bruno Morvan, Pascal Pareige, Jean-Louis Izbicki. Measurement of the effects of rough surfaces on Lamb waves propagation. NDT & E International, 2004, 37, pp.207 - 211. 10.1016/j.ndteint.2003.09.007. hal-04073344
- ↑ 40.0 40.1 40.2 J. Pan, F. Chen, Z. Song and Y. Feng, "Ultrasonic Pulse Reflection Method of Thickness Measurement System based on FPGA," 2020 5th International Conference on Mechanical, Control and Computer Engineering (ICMCCE), Harbin, China, 2020, pp. 2224-2228, doi: 10.1109/ICMCCE51767.2020.00482.
- ↑ J. Pan, F. Chen, Z. Song and Y. Feng, "Ultrasonic Pulse Reflection Method of Thickness Measurement System based on FPGA," 2020 5th International Conference on Mechanical, Control and Computer Engineering (ICMCCE), Harbin, China, 2020, pp. 2224-2228, doi: 10.1109/ICMCCE51767.2020.00482.
- ↑ van Roodselaar, Albert, et al. "Statistical modeling of some NDE measurement uncertainties." Inspector Summit Conference Proceedings. 2009.
- ↑ Wilson, P. T., D. P. Krouse, and C. J. Moss. "Statistical Analysis of UT Wall thickness data from corroded plant." Nondestructive Testing Australia 41.3 (2004).
- ↑ J. Pan, F. Chen, Z. Song and Y. Feng, "Ultrasonic Pulse Reflection Method of Thickness Measurement System based on FPGA," 2020 5th International Conference on Mechanical, Control and Computer Engineering (ICMCCE), Harbin, China, 2020, pp. 2224-2228, doi: 10.1109/ICMCCE51767.2020.00482.
- ↑ Z. Shen, S. Chen, L. Zhang, K. Yao and C. Y. Tan, "Direct-Write Piezoelectric Ultrasonic Transducers for Non-Destructive Testing of Metal Plates," in IEEE Sensors Journal, vol. 17, no. 11, pp. 3354-3361, 1 June1, 2017, doi: 10.1109/JSEN.2017.2694454.
- ↑ Massa, D. (2018) Understanding How Frequency, Beam Patterns of Transducers, and Reflection Characteristics of Targets Affect the Performance of Ultrasonic Sensors, Massa Products Corporation. Available at: https://www.massa.com/wp-content/uploads/2018/06/Massa-Whitepaper-3-DPM-160621.pdf
- ↑ https://www.checkline.eu/product/ti-umx2
- ↑ Zarchan, P., & Musoff, H. (2000). Fundamentals of Kalman Filtering: A Practical Approach. American Institute of Aeronautics and Astronautics.