Input: Difference between revisions
No edit summary |
No edit summary |
||
| (16 intermediate revisions by 3 users not shown) | |||
| Line 1: | Line 1: | ||
Back to main page: [[PRE2015_3_Groep4]] | Back to the main page: [[PRE2015_3_Groep4]] | ||
To the | To the algorithm: [[Algorithm]] | ||
To the output: [[Output]] | To the output: [[Output]] | ||
== Gathering Real-Time Data == | |||
Gathering Real-Time data is rather easy using the Arduino. When connected with a computer through USB, an Arduino can print values directly to a Serial Monitor. Thankfully, there is an add-on<ref>''Arduino Support for Matlab,'' http://nl.mathworks.com/hardware-support/arduino-matlab.html</ref> for Matlab, which enables Matlab to read the Serial Monitor, and also return commands to the Arduino. | |||
The Arduino needs some code to measure the input of the sound sensor and print the values to the Serial Monitor. A figure of the code can be found at the page [[code]]. | |||
The | |||
Our intent was to have as much of the program running on the Arduino itself. That means that you, in theory, would be able to have the Arduino as a standalone product. In our case, that would mean you start the program from your computer, and then would be able to unplug your Arduino since it is able to run the whole code by itself. This was however not possible because of multiple reasons. One of the reasons discussed here is saving the gathered data to read it. | |||
For a more accurate calculation of the wake-up moment, as many measurements as able should be saved. The problem is the size of the information, and saving that information on the Arduino. The used Arduino (Arduino Mega<ref>''The Arduino Mega,'' https://www.arduino.cc/en/Main/ArduinoBoardMega2560</ref>) has up to 256 KB of storage. Not all of this can be used since a lot would already be taken up by the program itself, and 8 KB for the bootloader. If we then want to review the last 30 minutes to choose the best moment to wake up (the larger the reviewed period, the more accurate the decision), the sample time has to be reduced dramatically. Reducing the sample time results in an inaccurate measurement, leading to the program not able to choose the correct moment to wake the person. For this reason, we chose to keep the laptop in the loop for this prototype, since a laptop has more than enough storage to store samples of the whole night. In our tests, the files containing all the measurements had a size of ~130 MB. | |||
< | So, the data will be stored on the computer. This will be done with the aid of the program Gobetwino <ref>''Gobetwino,'' http://mikmo.dk/gobetwino.html </ref>. This program logged the data in a .txt file. And this file can (while Gobetwino is still logging) be further processed in Matlab. | ||
In the figure below, the Arduino-code is shown for gathering data. See [[Measurement plan and experiments]] for the made trade-offs in for example sample frequency. | |||
[[File: | [[File:workingvarfreq.JPG]] | ||
== References == | == References == | ||
<references/> | <references/> | ||
Latest revision as of 20:12, 20 April 2016
Back to the main page: PRE2015_3_Groep4
To the algorithm: Algorithm
To the output: Output
Gathering Real-Time Data
Gathering Real-Time data is rather easy using the Arduino. When connected with a computer through USB, an Arduino can print values directly to a Serial Monitor. Thankfully, there is an add-on[1] for Matlab, which enables Matlab to read the Serial Monitor, and also return commands to the Arduino.
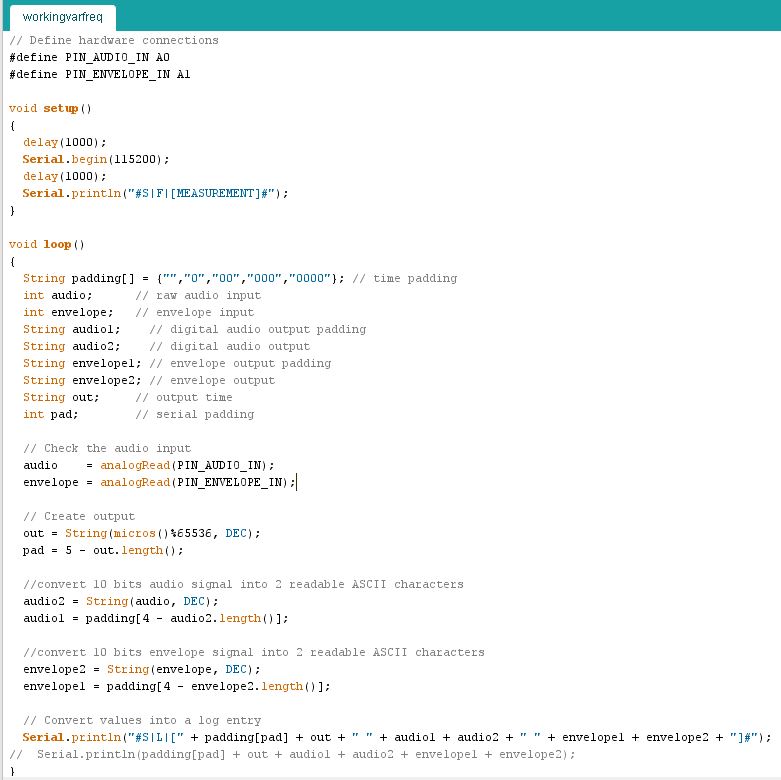
The Arduino needs some code to measure the input of the sound sensor and print the values to the Serial Monitor. A figure of the code can be found at the page code.
Our intent was to have as much of the program running on the Arduino itself. That means that you, in theory, would be able to have the Arduino as a standalone product. In our case, that would mean you start the program from your computer, and then would be able to unplug your Arduino since it is able to run the whole code by itself. This was however not possible because of multiple reasons. One of the reasons discussed here is saving the gathered data to read it.
For a more accurate calculation of the wake-up moment, as many measurements as able should be saved. The problem is the size of the information, and saving that information on the Arduino. The used Arduino (Arduino Mega[2]) has up to 256 KB of storage. Not all of this can be used since a lot would already be taken up by the program itself, and 8 KB for the bootloader. If we then want to review the last 30 minutes to choose the best moment to wake up (the larger the reviewed period, the more accurate the decision), the sample time has to be reduced dramatically. Reducing the sample time results in an inaccurate measurement, leading to the program not able to choose the correct moment to wake the person. For this reason, we chose to keep the laptop in the loop for this prototype, since a laptop has more than enough storage to store samples of the whole night. In our tests, the files containing all the measurements had a size of ~130 MB.
So, the data will be stored on the computer. This will be done with the aid of the program Gobetwino [3]. This program logged the data in a .txt file. And this file can (while Gobetwino is still logging) be further processed in Matlab.
In the figure below, the Arduino-code is shown for gathering data. See Measurement plan and experiments for the made trade-offs in for example sample frequency.
References
- ↑ Arduino Support for Matlab, http://nl.mathworks.com/hardware-support/arduino-matlab.html
- ↑ The Arduino Mega, https://www.arduino.cc/en/Main/ArduinoBoardMega2560
- ↑ Gobetwino, http://mikmo.dk/gobetwino.html
