File:GSD and litter size.png
Original file (428 × 792 pixels, file size: 138 KB, MIME type: image/png)
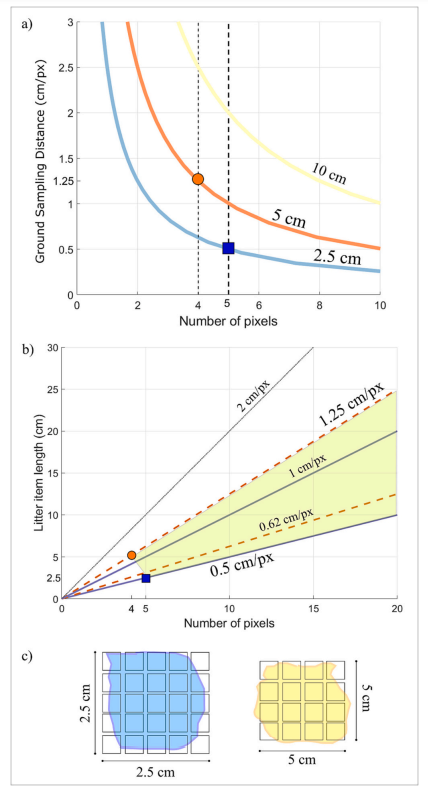
Relation between Ground Sampling Distance (GSD) and size of litter (Sz). a) Blue and orange curves represent the litter size Sz (2.5 cm and 5 cm, respectively) in the graph GSD-number of pixels (Npx). The yellow curve shows a 10-cm litter size in the graph GSD-number of pixels. Black shaded lines indicate the adopted thresholds of Npx = 4 and Npx = 5; b) GSD represented in the graph litter size Sz – number of pixels (Npx). Thick blue lines indicate GSD of 0.5 cm/px and 1 cm/px, and dashed orange lines indicate GSD of 0.62 cm/px and 1.25 cm/px. For comparison purposes, dotted black lines show the GSD of 2 cm/px. Shaded area delimitates the suitable GSD range. In both graphs, blue square indicates the intersection between Npx = 5 and Sz = 2.5 cm, while orange circle the intersection between Sz = 5 cm and Npx = 4; c) examples of stylized item of 2.5 × 2.5 cm, represented by 5 × 5 pixels on an image with GSD = 0.5 cm/px (left), and stylized item of 5 × 5 cm, represented by 4 × 4 pixels on an image with GSD = 1.25 cm/px (right)
File history
Click on a date/time to view the file as it appeared at that time.
| Date/Time | Thumbnail | Dimensions | User | Comment | |
|---|---|---|---|---|---|
| current | 13:15, 10 March 2025 | | 428 × 792 (138 KB) | L.kirkels@student.tue.nl (talk | contribs) |
You cannot overwrite this file.
File usage
The following page uses this file: