File:Exp3 max heat graph FINAL.png: Difference between revisions
Jump to navigation
Jump to search
No edit summary |
(No difference)
|
Latest revision as of 22:11, 11 April 2024
Image 2.6: Graph of the heating experiment with heat gun set to 550 oC temperature;
File history
Click on a date/time to view the file as it appeared at that time.
| Date/Time | Thumbnail | Dimensions | User | Comment | |
|---|---|---|---|---|---|
| current | 22:11, 11 April 2024 | 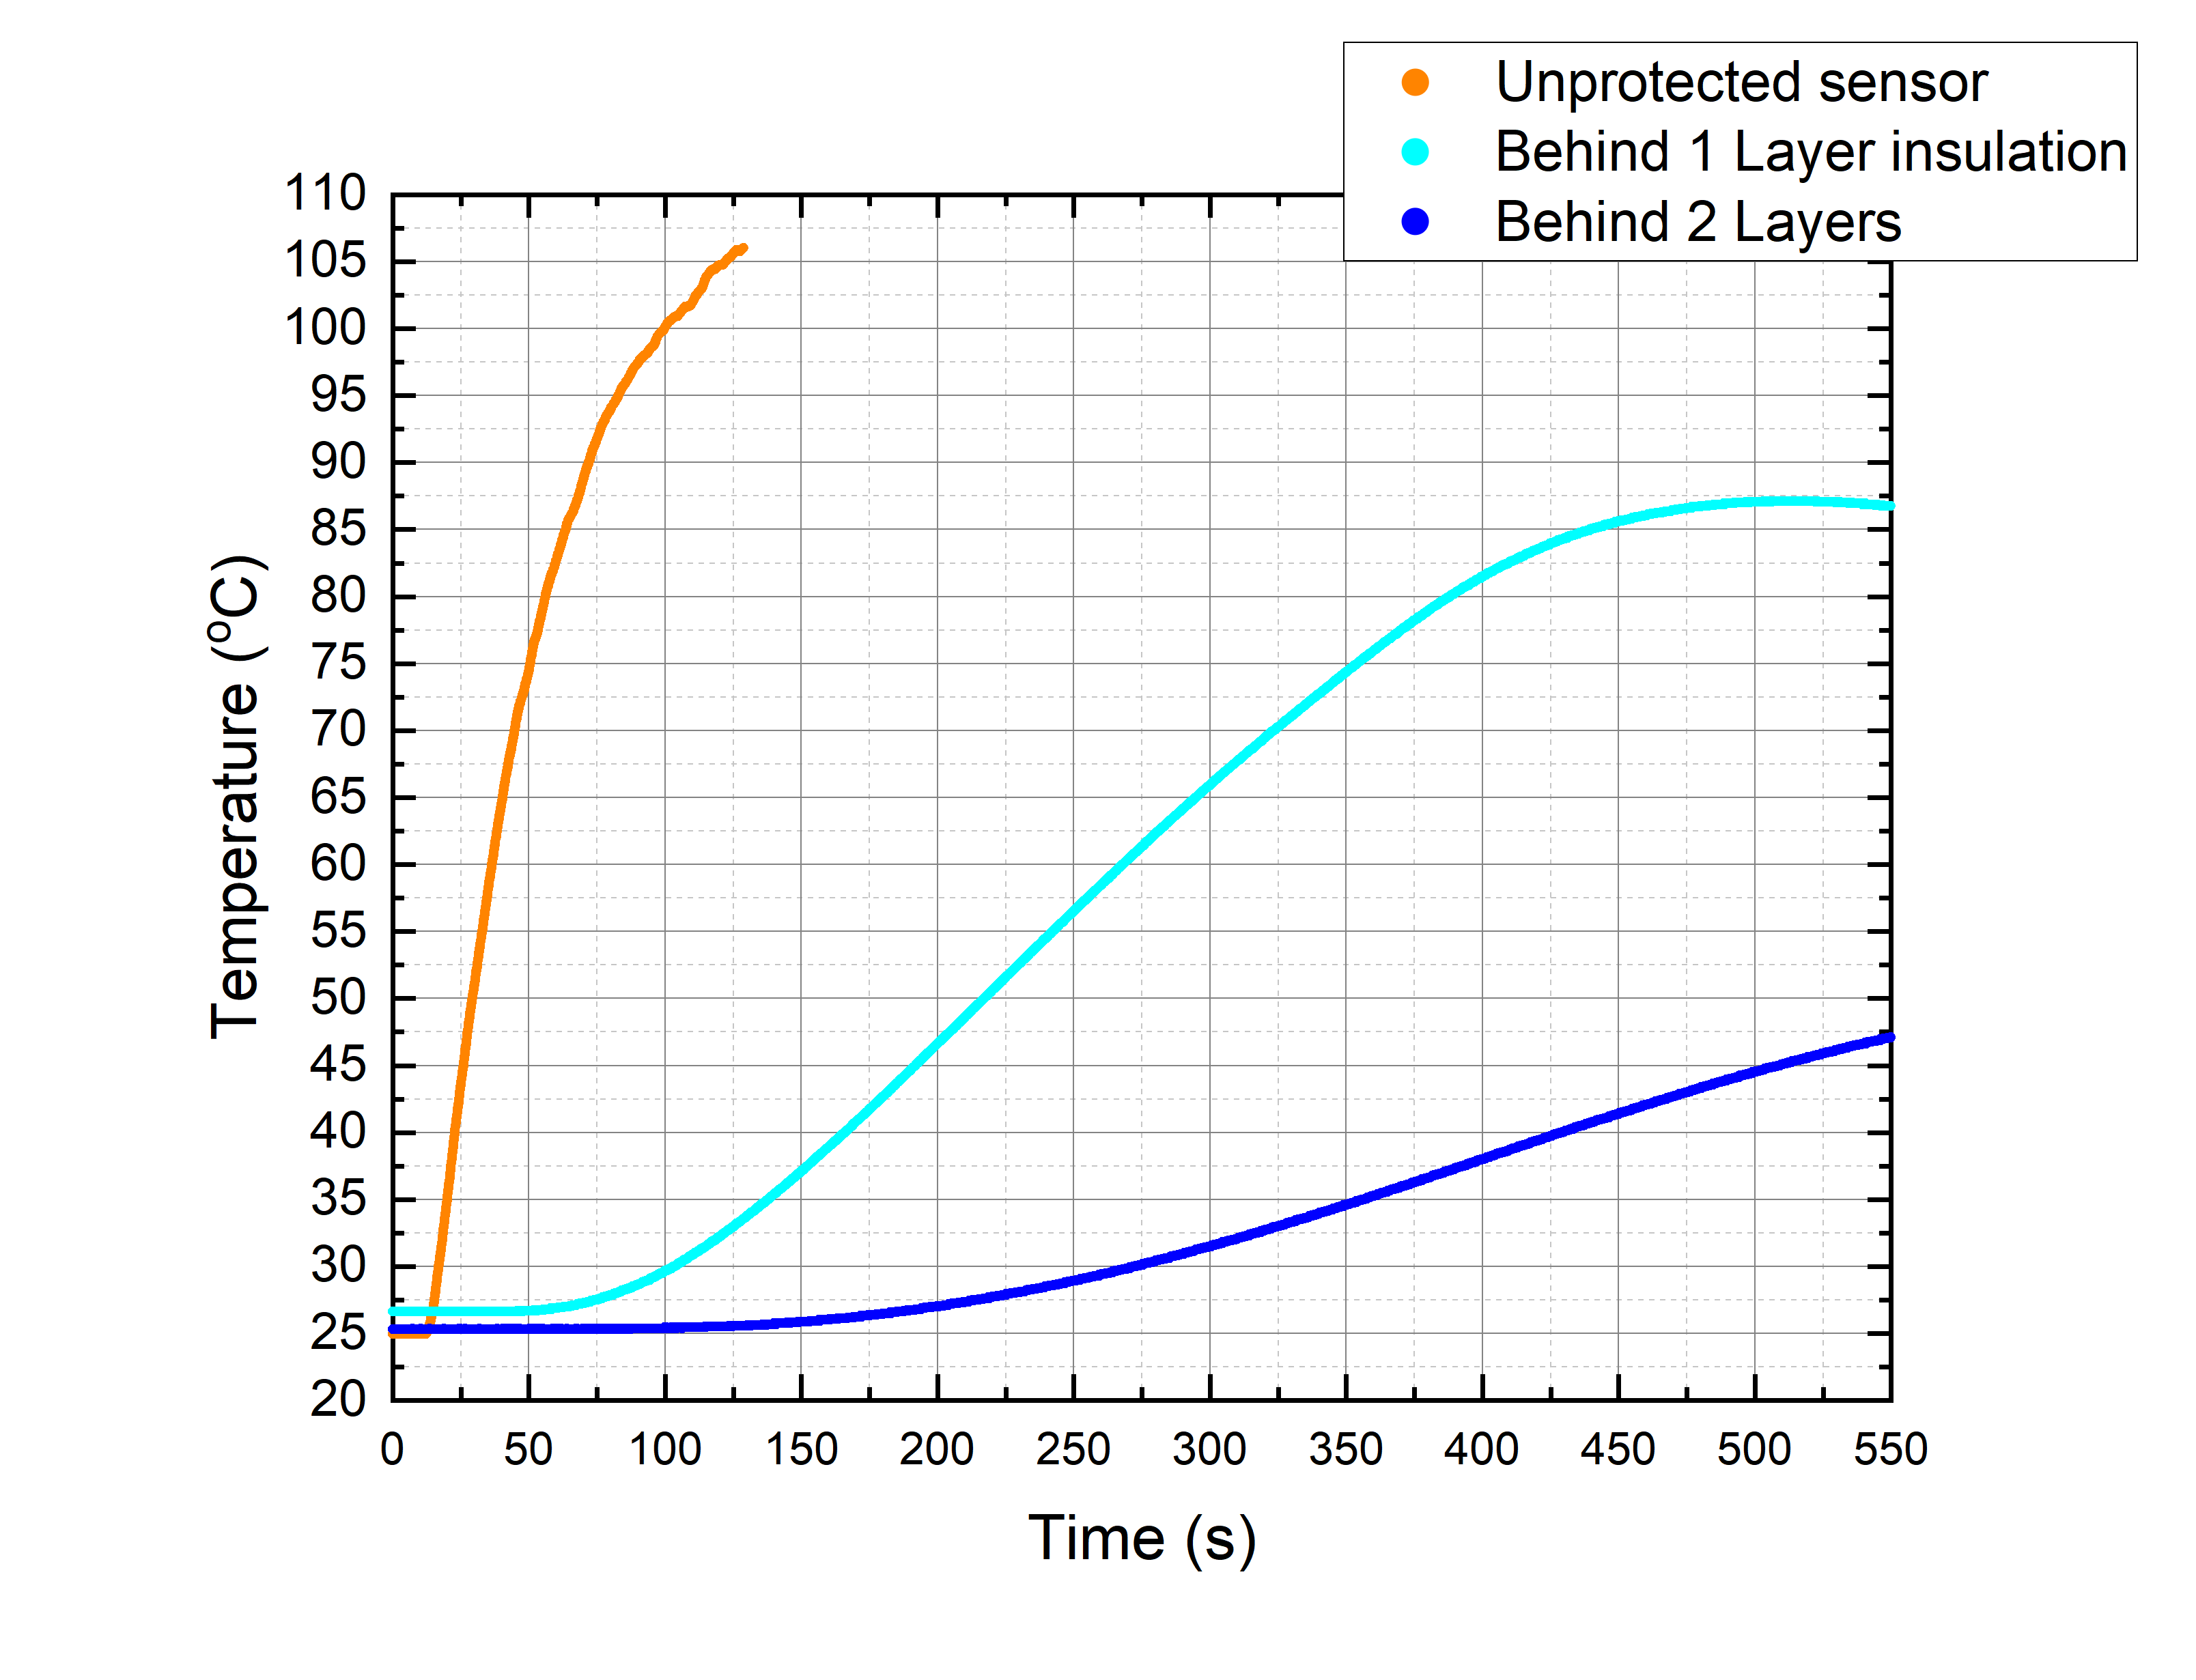 | 3,216 × 2,461 (122 KB) | R.sinickis@student.tue.nl (talk | contribs) |
You cannot overwrite this file.
File usage
The following page uses this file: