PRE2019 3 Group14
Team Members
Sven de Clippelaar 1233466
Willem Menu 1260537
Rick van Bellen 1244767
Rik Koenen 1326384
Beau Verspagen 1361198
Subject:
Due to climate change, the temperatures in the Netherlands keep rising. The summers are getting hotter and drier. Due to this extreme weather fruit farmers are facing more and more problems harvesting their fruits. In this project, we will develop a robot that will help apple farmers, since apple farmers especially have problems with these hotter summers. Apples get sunburned, meaning that they get too hot inside so that they start to rot. Fruit farmers can prevent this by sprinkling their apples with water, and they have prune their apple trees in such a way that the leaves of the tree can protect the apples against the sun.
This is where our robot, the Smart Orchard, comes in. Smart Orchard focuses on the imaging of apples. The robot will be used for two tasks, recognizing ripe apples and looking for sunburned apples. First, Smart Orchard will be trained with images of ripe/unripe/sunburned apples in order for it to understand the distinct attributes between them. It will then use this knowledge to scan the apples in the orchard by taking pictures of its surroundings. The robot will process the data and show the amount of ripe and sunburned apples via an app or desktop site to the user, who is the keeper of the orchard as well as the farmers that work there. The farmers can use this information quite well since the harvesting of fruit can be done based on the data. Furthermore, the farmers cannot sprinkle their whole terrain at once, because most of the time they have just a few sprinkler installations. With the data collected by the robot, the farmers can optimize the sprinkling by looking for the location with the most apples that have suffered from the sun, and thus where they can most efficiently place their sprinkler.
Also, Smart Orchard can be used to find trees that have too many unripe apples. Trees that have too many apples must get pruned so that all of the energy of the tree can be used to produce bigger, tastier apples. Since the robot will notify the farmers how many ripe and unripe apples there are at a given location, the farmers can go to that location directly without having to look themselves. This also increases the efficiency with which they can do their job.
Objectives
The objectives of this project can be split into the main-objectives and secondary-objectives.
Main
- The system, consisting of a drone equipped with a camera and a separate neural network, should be able to make a distinction between ripe and unripe apples.
- The neural network should be able to make this distinction with an accuracy of at least 70% whilst only having images of apple trees taken by the drone.
- The neural network must reach this accuracy with only limited data available, more specifically: at least 85% of the front of the apple tree is in the image and at least 75% of the total fruit of that row, when the row consists of 1 tree. When the row consists of 4 trees the total fruit, which can be seen is 18.75%.
- The neural network should be able to recognize sunburn with an accuracy of at least 70%, whilst at least 85% of the front of the apple tree is in the image and at least 70% of the total fruit of that row, when the row consists of 1 tree. When the row consists of 4 trees the total fruit, which can be seen is 18.75%.
- The data (classification of apples) obtained from the neural network should be processed into a model, particularly a coordinate grid of the orchard.
- The user must be able to interact with the system by means of a web application and through that make reliable agricultural decisions as well as being able to give feedback to the system.
- Depending on user preferences the system should be able to work autonomously to a certain degree. More specifically: as of boot up the drone should be able to start flying autonomously through the orchard and take images, the system must update its data and model, and the drone should return to its docking station.
- With the use of obtained data, the system should be able to create a list of recommended agricultural instructions/actions for the user like harvesting and watering.
Secondary
- The interface of the system should be clear and intuitive.
- The system should be an improvement in terms of efficiency and production of the apple orchard.
Argumentation of the percentages above
To get healthy and big enough elstar apples, the maximum amount of apples on a tree is around 100 apples[1]. When taking pictures with the drone, the camera sees the front of the tree, we visited the orchard and made pictures to see how the drone should fly as can be seen in a section below. Now when the tree is not blooming the tree can be seen fully in the picture at a distance of 3 meters, however when the tree is blooming, some twigs could be out of the picture. That is why the percentage of 85% is chosen. We also saw that the columns in the orchard consists of rows of either 4 trees or a single tree. When there is 1 tree in a row, because flying at both sides, the full tree can be seen. However due to overlapping fruits by leafes, other fruits, or twigs, the amount of apples, which will be seen is around 75%, so 75 apples. When the row consists of 4 trees, the drone will see 1 tree in total, because it sees the front of the first tree and the back of the last tree, it will see 75 apples of the 400 apples in total so 18.75%.
After doing tests with our neural network, the minimum accuracy that the neural network gave was 70%, this means that it was sure that the apple was ripe and healthy for 70%, and it actually was right (checked by us). That is why this accuracy of 70% was chosen. So when the neural network knows for 70% sure that the apple is ripe and healthy, it will be counted. This accuracy could be improved by using more training data and faster software as "normal" Tensorflow, which could not be run at the Raspberry pi.
Users
The main users that will benefit from this project are keepers of apple orchards, who will be able to divide tasks more efficiently. The farmers that work at the orchard also benefit from the application, since it will tell them where to go, such that they do not have to look for bad apples themselves. This product will help the farmers, which were complaining this last hot summer. For this reason after seeing some articles on different regional newspapers and tv broadcasters, we thought we could help the farmers with their problems. Due to the lot of media attention for farmers last summer, we have enough input from the farmers, got a good view of their problems and the impact of their problems. From the sources, which are cited below, we came to the following conclusions:
1) Last year there 5% of the apples was sunburned[2], some media even talk about 1 or 2 kilo damaged apples per tree[3] and farmers from Zeeland harvested around 20% less fruit than other years [4]. Farmers can protect their apples against the heat (sun), with sprinkling water over the trees. This could lead to less sunburned apples, so a higher amount of apples. Furthermore nowadays farmers have to take off the sunburned apples from the trees, so that all the energy of the apple tree goes to the healthy apples. This costs a lot of working hours and thus a lot of money, which could be saved.
2) So, to avoid damaged apples a farmer has to sprinkle their trees. This sprinkling costs money, that is why sprinkling has to be optimized, because there is a lot of competition from the former Eastern Bloc countries, where there are fewer rules and where European subsidies are still being granted[5]. Our application would give a good view and fast view of the sunburned apples, and thus the sprinkling can be optimized. Moreover, because the most farmers do not have enough sprinklers to sprinkle their, whole orchard at ones.
After doing some research on the internet, we also took an interview with a farmer Jos van Assche, where we asked for improvements on our concept idea and which additional problems, which could be solved with our product. This interview can be read in a separate section below.
State-of-the-art
Artificial neural networks and deep learning have been incorporated in the agriculture sector many times due to its advantages over traditional systems. The main benefit of neural networks is they can predict and forecast on the base of parallel reasoning. Instead of thoroughly programming, neural networks can be trained [6]. For example: to differentiate weeds from the crops[7], for forecasting water resources variables [8] and to predict the nutrition level in the crops[9].
It is difficult for humans to identify the exact type of fruit disease which occurs on the fruit or plant. Thus, in order to identify the fruit diseases accurately, the use of image processing and machine learning techniques can be helpful[10][11]. Deep learning image recognition has been used to track the growth of mango fruit. A dataset containing pictures of diseased mangos has been created and was fed to a neural network. Transfer learning technique is used to train a profound Convolutionary Neural Network (CNN) to recognize diseases and abnormalities during the growth of the mango fruit[12][13][14].
Adapting the technique of image recognition to this branch is a hard task which is currently still in development. Lots of research has been done in the automatization of the harvesting of fruits. For instance, in Holland, there has been designed a system that can track where in the orchard the apples are harvested and how many. It does this with the help of GPS and some manual labor [15].
Approach
Regarding the technical aspect of the project, the group can be divided into 3 subgroups. A subgroup that is responsible for the image processing/machine learning, a subgroup that is responsible for the graphical user interface and a subgroup that is responsible for configuring the hardware. In the meetings the subgroups will explain the progress they have made, discuss the difficulties they have encountered and specify the requirements for the other subgroups.
The USE aspect of the project is about gathering information about the user base that might be interested in using this technology. This means that we will need to set up meetings with owners of apple orchards to get a clear picture of what tasks the technology should fulfill. Furthermore, we shall need to inspect if the project is feasible from a business perspective. For this we will need to make an accurate production-cost approximation of the project and an approximation for the sale price of the project.
Interview with fruit farmer Jos van Assche
We interviewed a fruit farmer to get a good insight in what the user wants. These questions are necessary in the process of our product. The interview can be seen below:
Question 1: How many square meters of apple trees do you have in the orchard and how many ripe apples do you harvest on average per tree?
Answer 1: We have 130000 squared meters of apple trees, there is one tree on every 2.75 squared meters, so in total there are 47000 apple trees.
Question 2: Which apple diseases could you easily scan with the help of image recognizing?
Answer 2: Mildew (in dutch: Meeldauw) and damage of lice (luizenschade) are also useful to scan. However, it is more useful to check where the most ripe and colored apples are to see where we can start harvesting the apples.
Question 3: How do you determine nowadays when a row of apple trees is ready to be harvest?
Answer 3: We check the ripeness of apples by cutting them through and sprinkle it with iodine, when the black color of the iodine changes to white, it means that there is enough sugar inside the apple and that it is ready to harvest. Furthermore we check the color of the apple whether it is red enough or just tasting it. Moreover it is possible to detect ripe apples with sound waves to measure the hardness of the apple.
Question 4: How many sprinkler installations do you have and how do you determine where to place them?
Answer 4: We do not have fixed sprinkler installations, however we ride with water when needed. Useful would be to determine exactly which trees need water.
Question 5: In what kind of program would you like to view the data of the orchard: In a mobile app, a website or a computer program?
Answer 5: An app would be useful, however it would also be handy to see the overview/positioning of the ripe/sick apples on a computer (in the tractor) to determine where you have to be.
Question 6: Imagine our product will be available to buy, would it by an addition to the current way of working? Which additions/improvements would you suggest to our concept?
Answer 6: It would be a nice addition of the way of the current way of working. There is already a kind of computer program on the market called Agromanager (8000 euros), which is developed by a son of a farmer in Vrasene called Laurens Tack, this App makes administration easier for farmers. It tracks the water spray machine, so positioning, and it says where to dose more. But this is more a administrative application.
Conclusions after interview
After taking the interview with farmer Jos van Assche, the following conclusions and suggestions were taken/considered. In the first place, the farmer thought it was useful to get the application on both mobile phone and computer. That is why it was chosen to make a web application with .NET, this application can be opened in a web browser on both computer and mobile phone. The second remark of the farmer was that our concept would be quite useful to determine where to spray his apples with water, to prevent sunburned apples. Furthermore he gave us as a suggestion to also look at mildew and damage from lice. These two "diseases" are also important for the farmer, this we will explain in the section diseases below. However, our main focus will first be on the ripe and sunburned apples, because the farmer also confirmed that these were the main issues. The third conclusion of the interview is that the farmer on color and iodine test based, checks when to start harvesting the apple trees. With our application he does not need to check the color of the apples in the orchard anymore. He only has to check the sugar level if necessary with iodine. As last Jos suggested us to look at a existing application called Agromanager. This is more a administrative application, however for the design of our application it would be useful to get a look at it.
Diseases to check for
In this section, the "diseases" are discussed, which could be detected with our Smart Orchard. The following questions are discussed: What the disease is, why it is important for the farmer to check for it and what could be done to prevent the disease after it is noticed by the Smart Orchard. The three following diseases could be traced by the robot: Sunburned apples, Mildew and damage by lice.
Sunburned Apples
Apples can get sunburned due to the hot sun at warm days in the summer. The apple surface gets to hot, when hanging in the sun for too long. This leads to the death of cells at the surface of the apple and the color of the apple changes to brown. Then the apple starts to rot and it is not suited to harvest and sell anymore. When this problem could be solved the farmer has a bigger harvest. With our Smart Orchard the apples are scanned for this problem, when it sees a sunburned apple, the farmer will be noticed. Then the farmer can place shadow nets or can place his water spray installations on the most needed/critical parts on his orchard.
Mildew
Mildew is a mold, which lives on the leaves of the apple tree. It is a kind of white powder at the leaves and is therefore easy to scan. The Mildew is unwanted, because the Mildew propagates/spreads out fast and it takes nutrients from the tree. That is why trees after being infected by the mold do not grow any more, give no apples and the leaves are going to dry out. Finally the tree will die. With the Smart Orchard the Mildew can be spotted and the farmer can take actions to stop the Mildew. The farmer can spray the tree with water, when it is dry. Furthermore he can set out earwigs, which eat this mold. Moreover, the farmer can prune infected parts of the tree.
Damage by lice
Blood lice and other lice species are a bit harder to scan. Blood louse leaves a white "woolly" kind of dust behind on the leaves of the tree. When the tree is seriously attacked by the louse, galls can be formed on the trunk or in branches. This can cause irregular growth and tree shape, especially with young plant material. These galls can also form an entrance gate for other diseases and mold, such as fruit tree cancer. If the Smart Orchard can detect this woolly kind of dust of the louse, the trees can be saved from diseases. The farmer can set out ichneumon wasps ("sluipwespen") or earwigs, which eat these parasites or they can use chemical pesticides or herbicides to clean the tree from the lice.
Neural Network
Our neural network is an adaption of the SSD MobileNet v2 quantized model, using images we labeled ourselves as training data. The reason why we use the SSD MobileNet v2 model is that it is specifically made to run on less powerful devices, like a Raspberry Pi. The quantized model uses 8-bit instead of 32-bit numbers, further lowering the memory requirements. Initially, we trained the model using 121 training images and 30 test images. We only let the model classify between healthy apples and apples with sunburn, in order to test whether or not our approach is feasible. If so, we can train the model to classify ripe and unripe apples, and distinguish between multiple diseases.
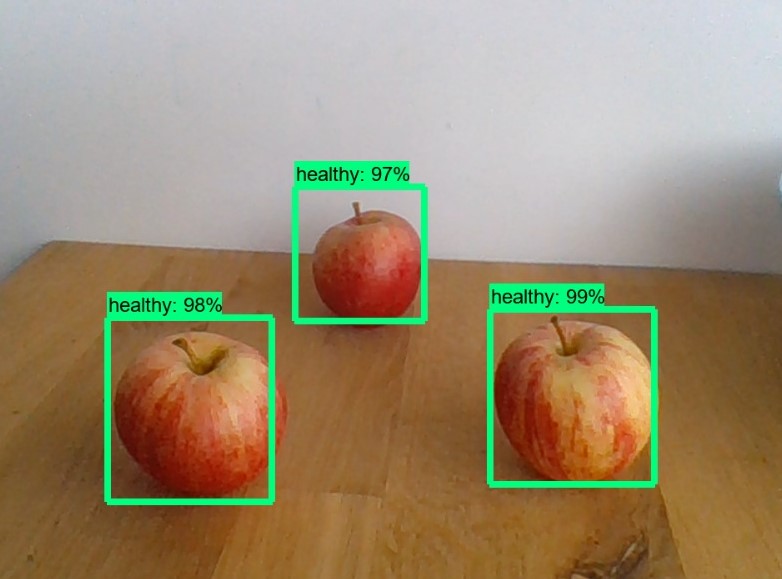
Before this model we used the faster RCNN model, which is a way more accurate, but also way more demanding model. We later came to the conclusion that this model would not be able to run on a Raspberry Pi, and thus it would not be applicable to our project. Figure 1 shows that this model was able to correctly classify healthy apples.
Figure 1: Classification of healthy apples using the faster RCNN model.
To create a working model and make it work on a Raspberry Pi, we followed a tutorial by EdjeElectronics, consisting of three parts [16][17][18]. First, we gathered training and test data, and manually labeled them using a program called labelImg. Then, we got the SSD MobileNet v2 quantized model from Tensorflow 1.13, and trained it using this training data. After the model had trained for about eight hours, it had achieved a loss of about 2.0. The loss function for the object detection model is a combination of localization loss, which is the mismatch between the ground truth box and the predicted boundary box, and the confidence loss, which is the loss for making class predictions[19]. In comparison, the faster RCNN model had a loss of about 0.05, which is a big difference in performance. After training the model, it had to be converted to a Tensorflow Lite model, and moved to the Raspberry Pi.
Below, images are shown of the performance with new images.
Figure 2: Classification of apples using the SSD MobileNet v2 quantized model
Two general problems can be distinguished from this exam ple. The first one is that the model is biased towards healthy apples. This is most likely because we have way more healthy apples as training data than unhealthy apples. To mitigate this issue, we could retrain the model using more images with sunburned apples. The second problem can be seen in the rightmost picture, namely that the model does not recognize more than ten apples. This issue is also present in other images with a full apple tree. Since we know of this issue, we will have to make sure that there are not too many apples in view at a given instance, such that the model can recognize them all. Therefore, we will have to make sure the drone flies relatively close to the trees.
Web application (User interface)
The web application is built on the Microsoft ASP.NET core framework. The framework is cross-platform meaning that the web app will be able to run on Windows, Linux and MacOS and also mobile platforms such as Android and IOS. ASP.NET uses #C as back-end language and with the new Blazor framework it is possible to inject C# logic alongside JavaScript in the browser. The framework uses dependency injection, where dependencies are injected when needed to avoid duplication. Furthermore, ASP.NET core has a modular HTTP request pipeline and optional client-side model validation for a faster response time. ASP.NET Core is a state of the art framework and there is a large community to support and maintain it.
A Microsoft SQL database is used to store client information. The database is handled using the Microsoft Entity framework Core. The Entity framework Core is designed to communicate with databases representing them as .NET objects making it easy to perform CRUD operations on them and inject them as dependencies. Furthermore, Language Integrated Query (LINQ) makes it easy to write database request in C#.
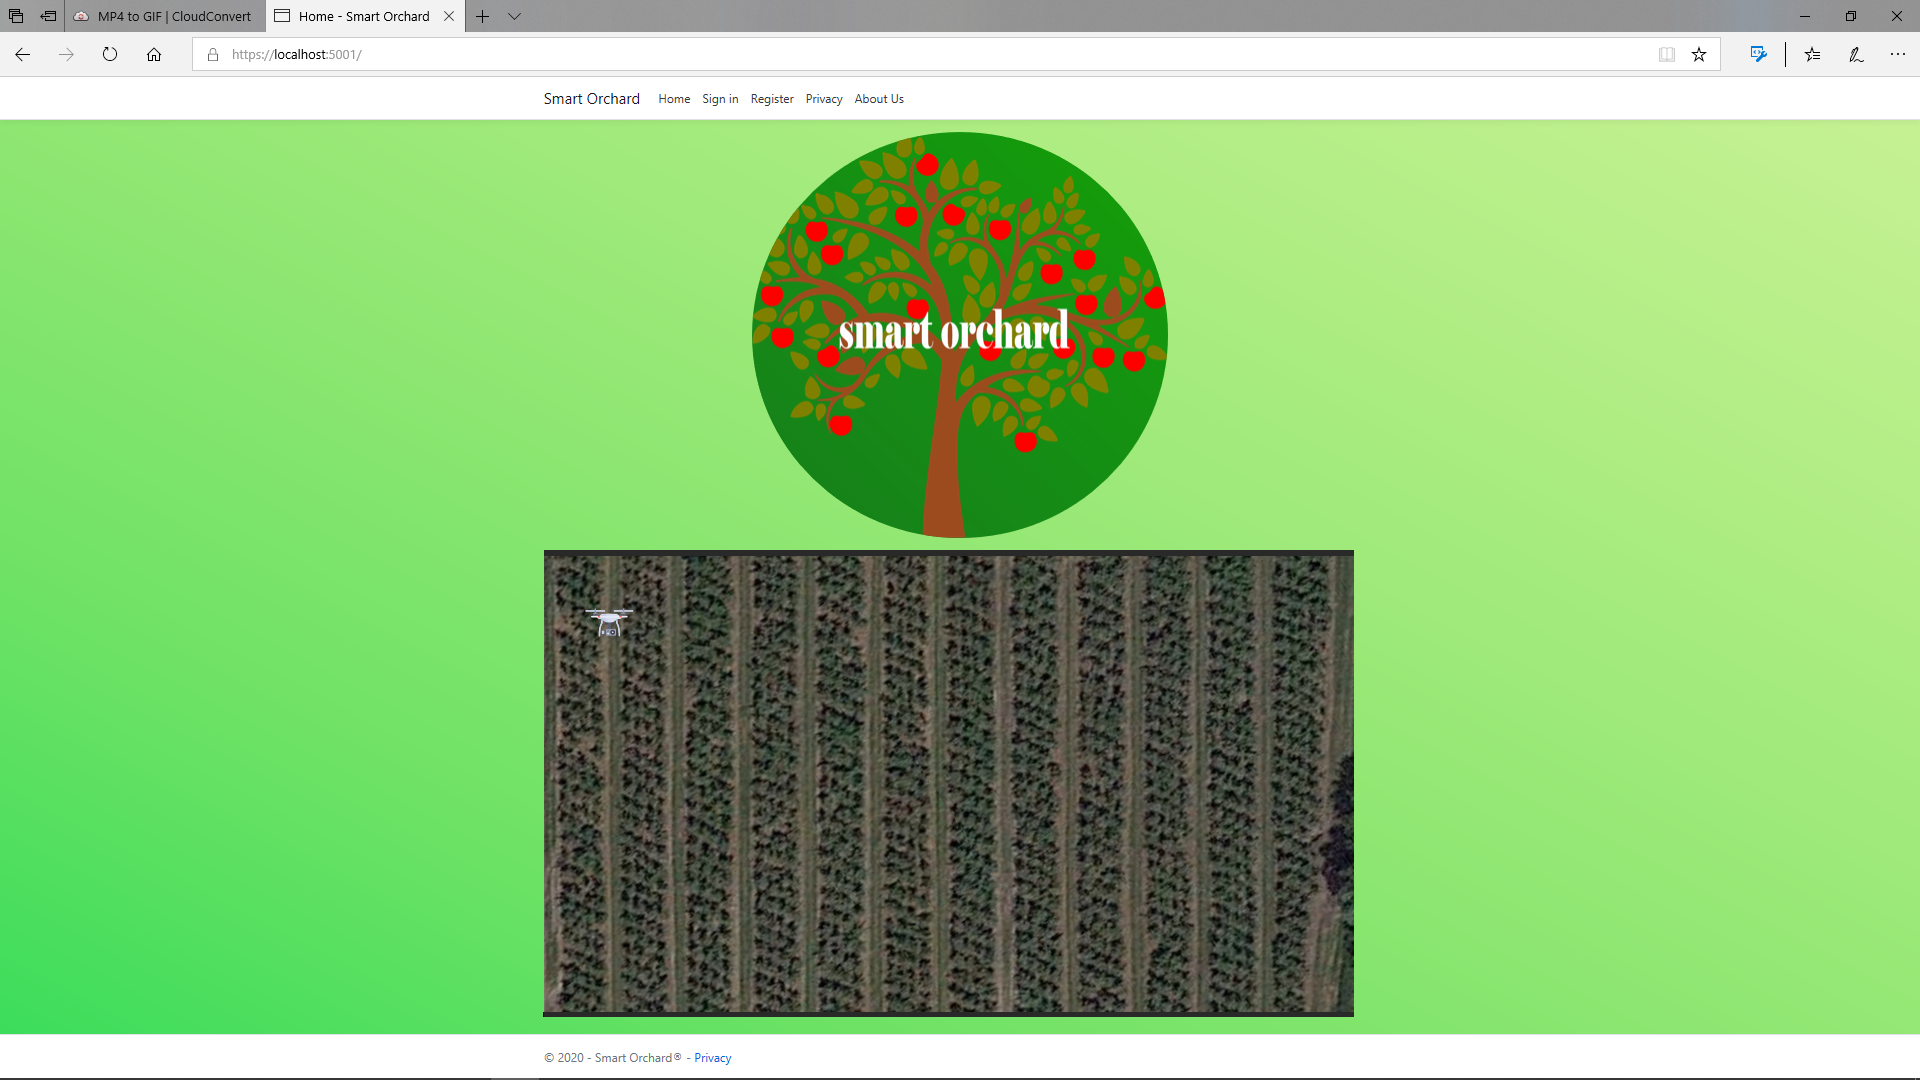
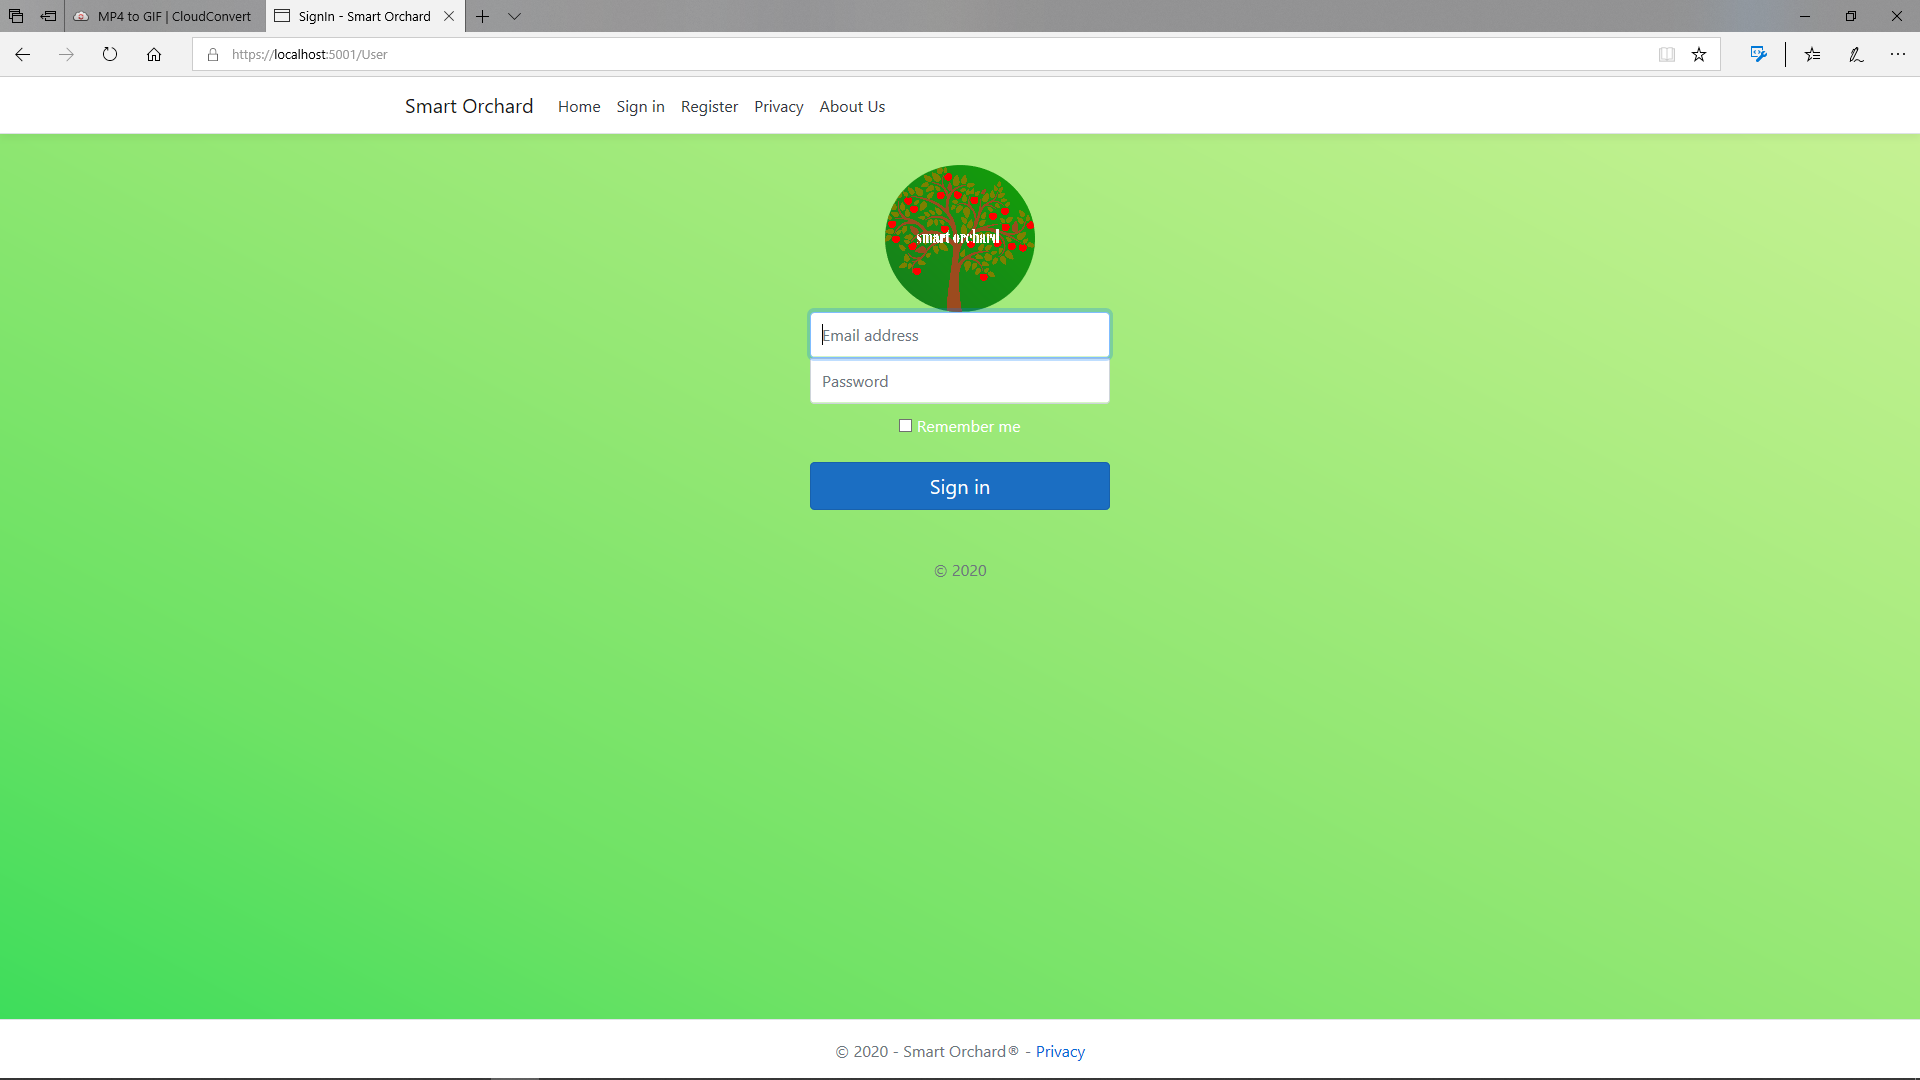
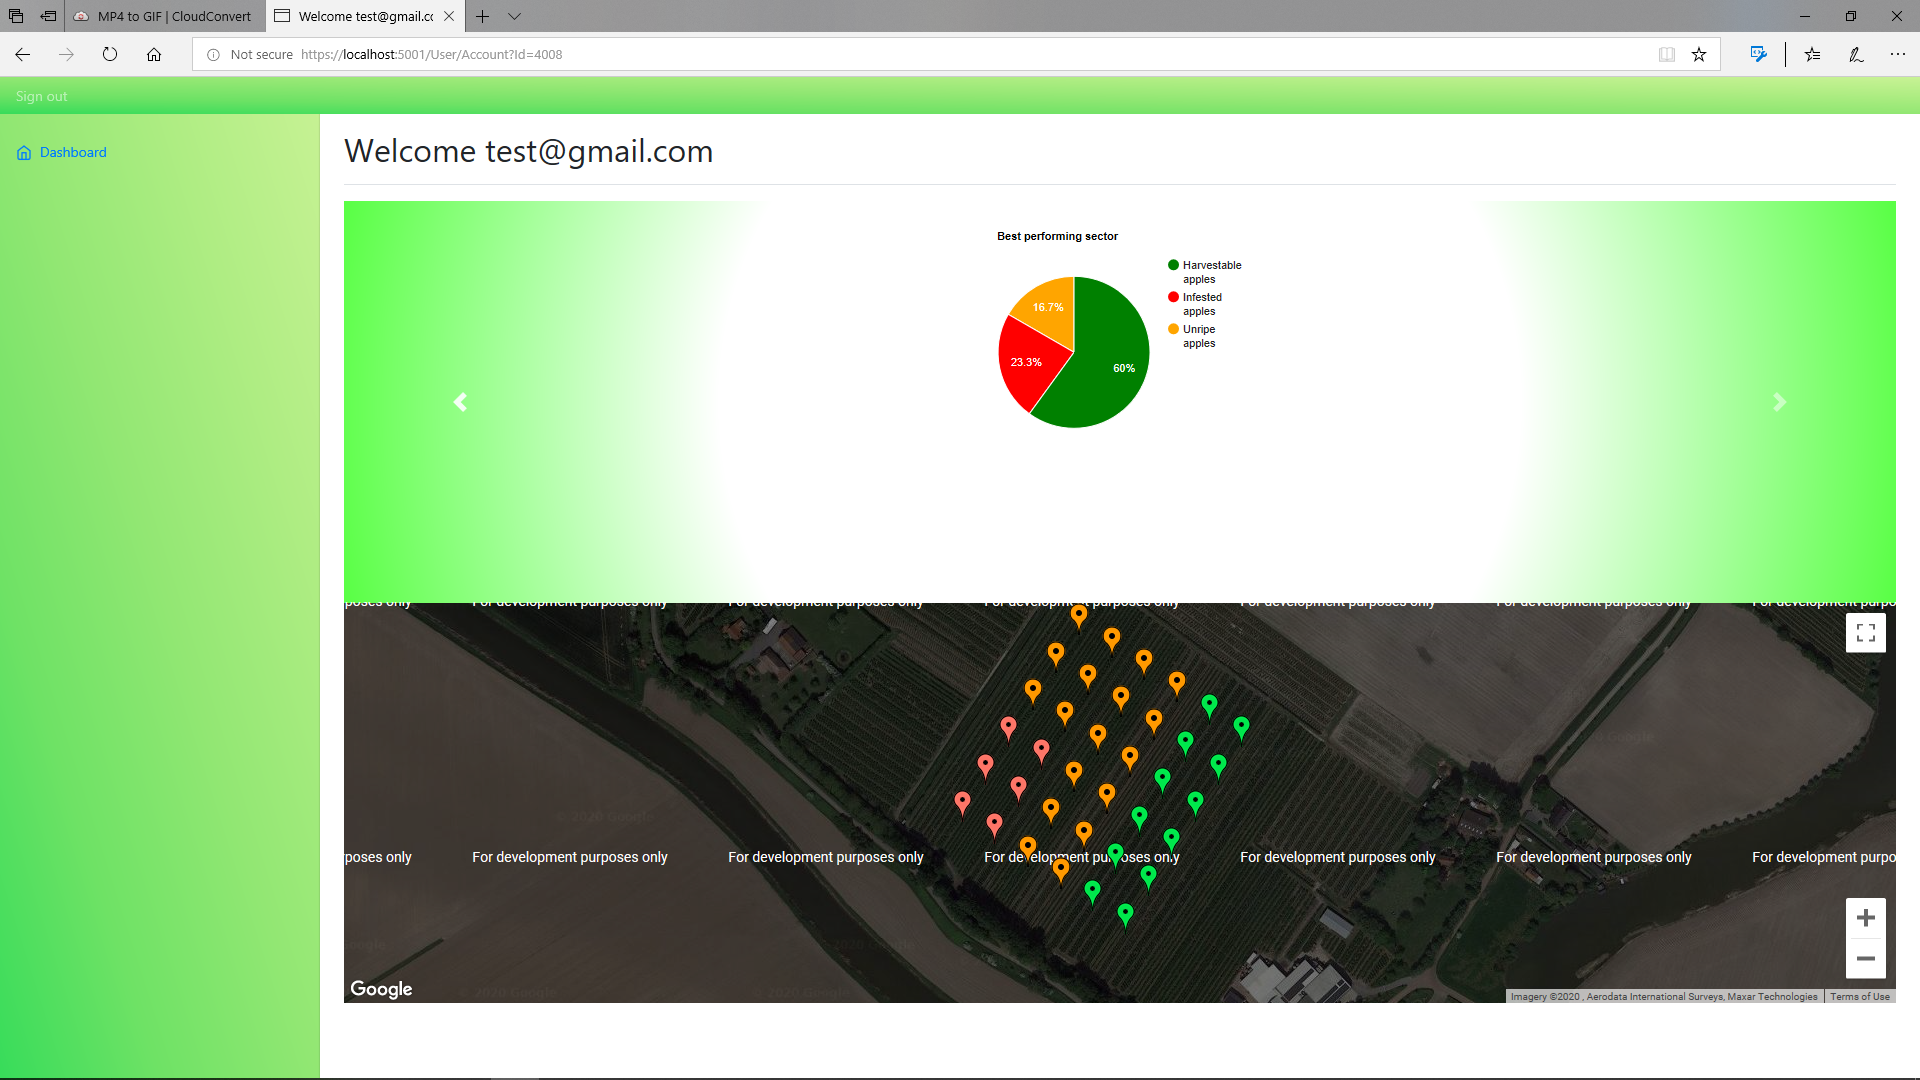
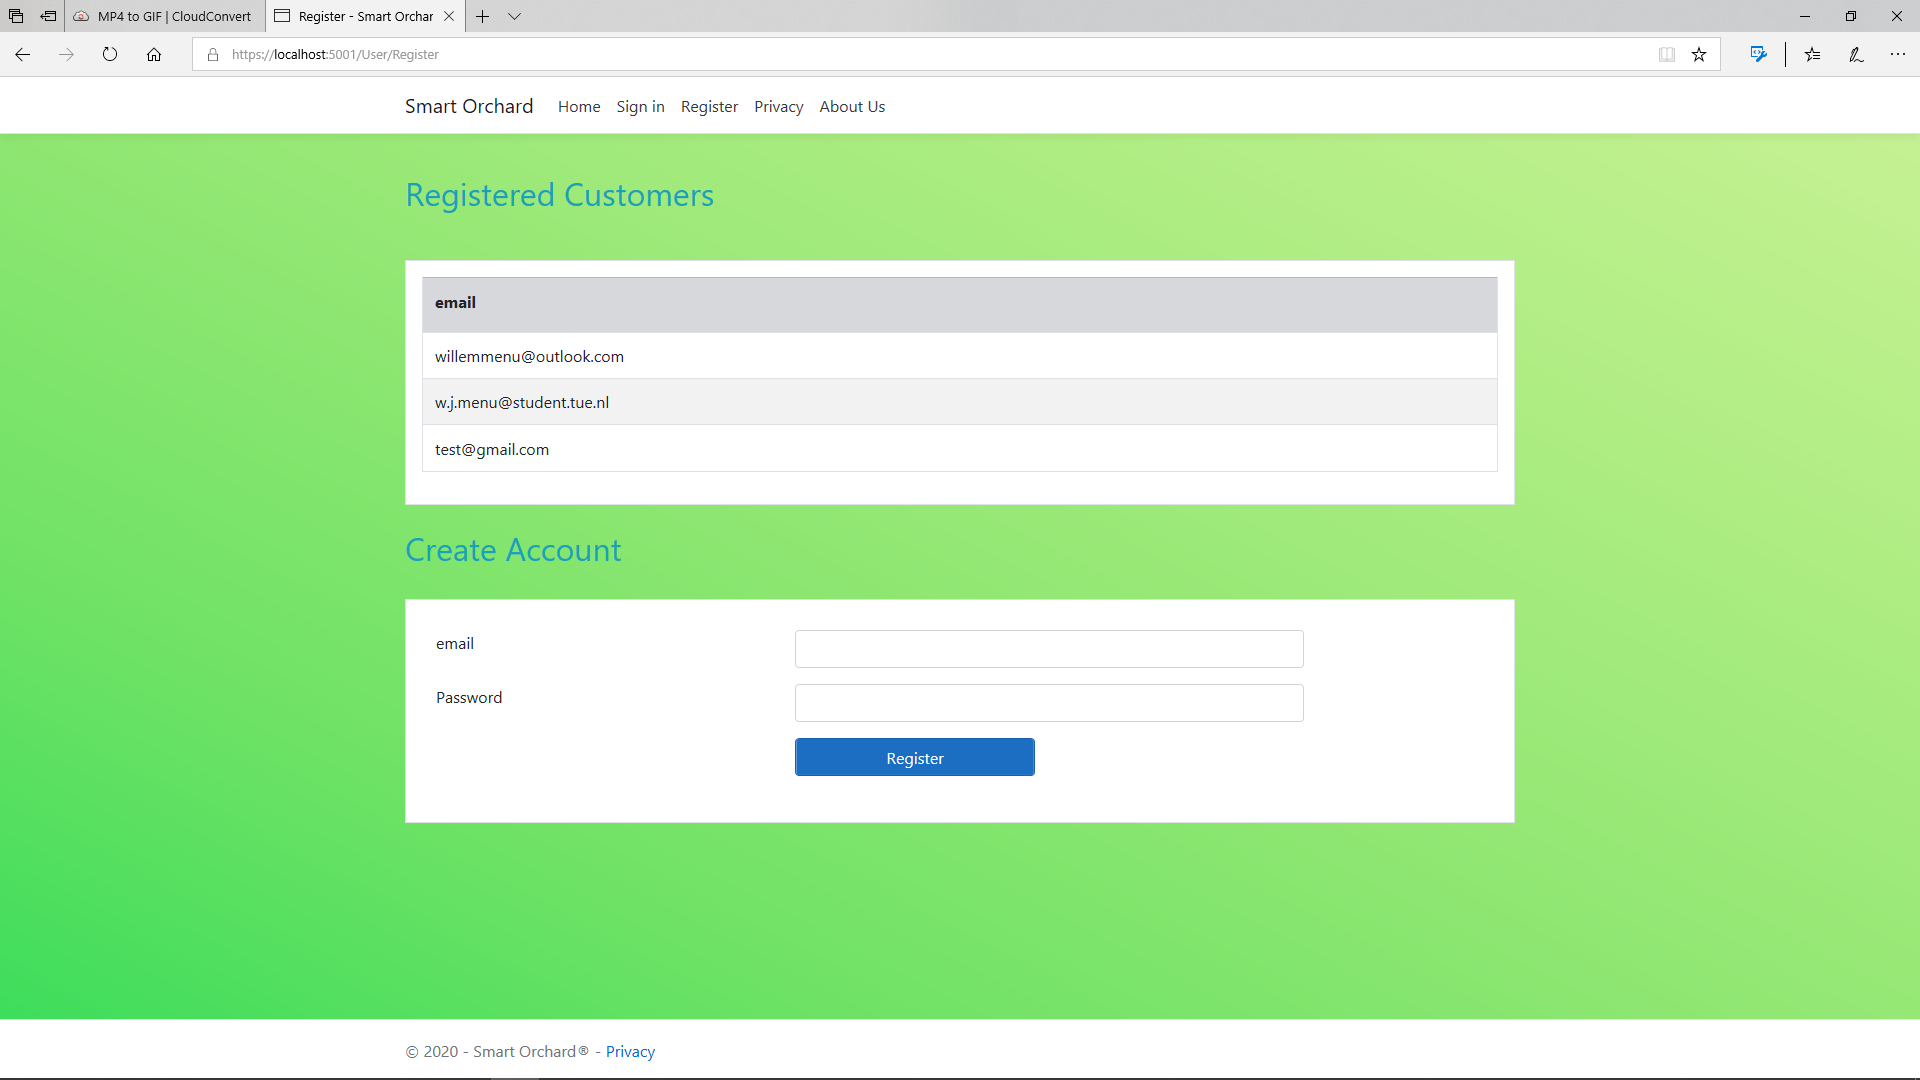
The front page of the website has the function of informing the user what the capabilities of the Smart Orchard are. This is displayed in a short video animation. The website has pages where users can sign in and where they can register. The register form consists out of a field for the username and a field for the password and with a valid username and password an account can be created. The sign in page is for users that already have a valid account. Both of the pages link to the account page. The top of the page contains a slider with statistical information and the bottom contains a visual grid representation of the users apple orchard. The statistical view of the project is made using the Google Charts API and the visual grid with geolocation is made using the Google Maps API. The front-end of the website is programmed in HTML, CSS, JS and a little C# mainly done via Bootstrap. Bootstrap is a open-source toolkit that greatly facilitates the development of responsive, interactive and visually pleasing websites.
Approach to get a realistic and correct view of the counted apples by the raspberry pi
In this section the processing of the obtained raw data by the raspberry pi is discussed. This processing is important to get a realistic and valid view of the counted apples, to avoid double counting and "forgotten" hidden apples. This data processing method is based on some papers[20][21] [22][23] and a Kalman filter tutorial [24].
The camera of the raspberry pi will give us images/frames. The raspberry pi will use its neural network to identify the (un)ripe/sunburned/sick apples. This information obtained by the raspberry pi will give us the total number of healthy and sick apples counted, which will be sent to the web application to give the farmer an insight in their orchard. However, there are some issues that have to be solved:
1) Apples are often growing in clusters of arbitrary size and shape.
2) The apples are often occluded by other apples, branches or leaves.
3) Double counting has to be prevented, to get the correct amount of apples.
A useful method to solve these problems is to track apples between frames. There are two ways to track already counted apples between frames. In order to achieve object counting, the system will track each moving object within successive image frames. As already mentioned first, SSD is used to detect the object, and these objects with their bounding boxes and centroids are extracted from each frame. In this context, object tracking is introduced to address the occlusion issue, for example when apples overlap each other and get identified as a single apple in certain frames.
The first method works as follows: two objects that are spatially closest in the adjacent frames are judged as the same object. The Euclidean distance is used to measure the distance between objects’ centroids in order to distinguish if an observed object belongs to one of a previously existing object, a new incoming object, or a missing object that occluded in the previous frames. For each object in the current frame, an object with the minimum distance and similar size between two consecutive frames needs to be searched in the previous frame. The Euclidean distance function is defined as follows:

, where n is the number of objects, obj is the object in the current frame, buff is the object in the previous frame, (x, y) is the centroid of an object.
After the tracking of the objects, a searching algorithm is needed to predict the possible position of the found object in the next frame and seek the best point in the relevant region in order to reduce the target search range. The overall idea is that based on a rectangular block around a detected object, the centroid (x, y), a circle with radius r (= threshold) is drawn. Examining its surrounding windows to find the corresponding block with the least difference from the target in the consecutive frames. When the overlapped apples separate in later frames, their trajectories can be traced back to the frame with occlusion in order to identify overlapped objects. If dist_obj is minimal of their sets and the condition dist_obj ≤ r is satisfied, then the object in the current frame is considered as an object in the previous frame.
However, after doing some more research on this method, we concluded that this method is not optimal for detecting apples. Since the apple objects are dense and the camera is moving, the fruit region in the current frame and its corresponding closest fruit region in the next frame may represent different fruits. Therefore, this approach will frequently yield wrong matches.
That is why we used the second method, this method makes use of first a Kalman Filter and then a Hungarian algorithm is applied. A Kalman filter is a prediction algorithm that makes use of a model of the predicted solution and actual live data. The filter compares the 'live' data with the predicted data from the model and comes up with a "compromise-solution". The prediction model is updated with each new solution to more accurately predict the correct solution. Different weights can be assigned to the predicted solution and actual live data to create either a slow- or fast-responding filter.
A Hungarian algorithm is, in essence, an optimization algorithm that is designed to solve an elaborate problem in a short amount of time. This is done to speed up the whole process.
The mathematical approach of both the Kalman filter and the Hungarian algorithm will be discussed below. First the Kalman filter is discussed. The equations of 2-D Kalman Filter whose position and velocity must be considered in 2-dimensional direction, the x– and y– directions. Meaning that instead of considering only for the position and velocity in one direction, let’s say the x-direction, we need to take into account the position and velocity in the y-direction as well.
The state in time k can be predicted by the previous state in time k-1. Let x and y be the positions in the x– and y-directions, respectively, and also let xdot and ydot be the velocities in x– and y-directions, respectively. Then the 2-D Kinematic equation for state xk can be written as:
, this can be written into the form of matrix multiplication as can be seen below:
, this can be simplified into:
, where xk is the current state, xk-1 is the previous state, and ak-1 is a vector of the previous acceleration in x– and y-directions. Now the state transition matrix (first matrix) and control matrix (second matrix) are found.
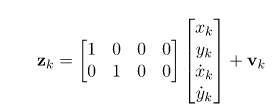
Now we found the transition and control matrix. We have to find the measurement matrix, which describes a relation between the state and measurement at the current step k. The measurement matrix can be found below:
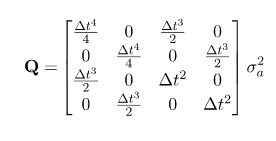
Now we found all necessary matrices, we need to find the noise covariance of both the state process as the measurement state. The noise covariance of the state process can be written as:
, where the sigma_a is the magnitude of the standard deviation of the acceleration that is basically the process noise effecting on the process noise covariance matrix. In 2-D Kalman filter, we suppose that the measurement positions x and y are both independent, so we can ignore any interaction between them so that the covariance x and y is 0. We look at only the variance in the x and the variance in the y. Then, the measurement noise covariance R can be written as follows:
Now we found the matrices of the Kalman filter, the Hungarian algorithm is used to find the minimum "cost" of these matrices. The Hungarian algorithm always follows the four steps, which can be seen below:
1) Subtract the smallest entry in each row from each entry in that row.
2) Subtract the smallest entry in each column from each entry in that column.
3) Using the smallest number of lines possible, draw lines over rows and columns in order to cover all zeros in the matrix. If the number of lines is equal to the number of rows in your square matrix, stop here. Otherwise, go to step 4.
4) Find the smallest element that isn't covered by a line. Subtract this element from all uncovered elements in the matrix and add it to any element that's covered twice. After doing this go back to step 3.
Now we found all the mathematical expressions for the Kalman filter and the approach for the Hungarian algorithm, we could implement these in our Python code/neural network. However due to the time limit of our project, we do not have time enough to get this working. We therefore suggest these Kalman filter and Hungarian algorithm to the next team, which continues on this project.
Visiting the orchard of potential user (Jos van Assche) to see how the drone should fly to take pictures of the trees
To see how the drone should fly in the orchard, Sven visited the orchard of Jos van Assche. This was done to see at which height and distance from the tree the drone should take pictures and to get a good view of structure of the orchard.
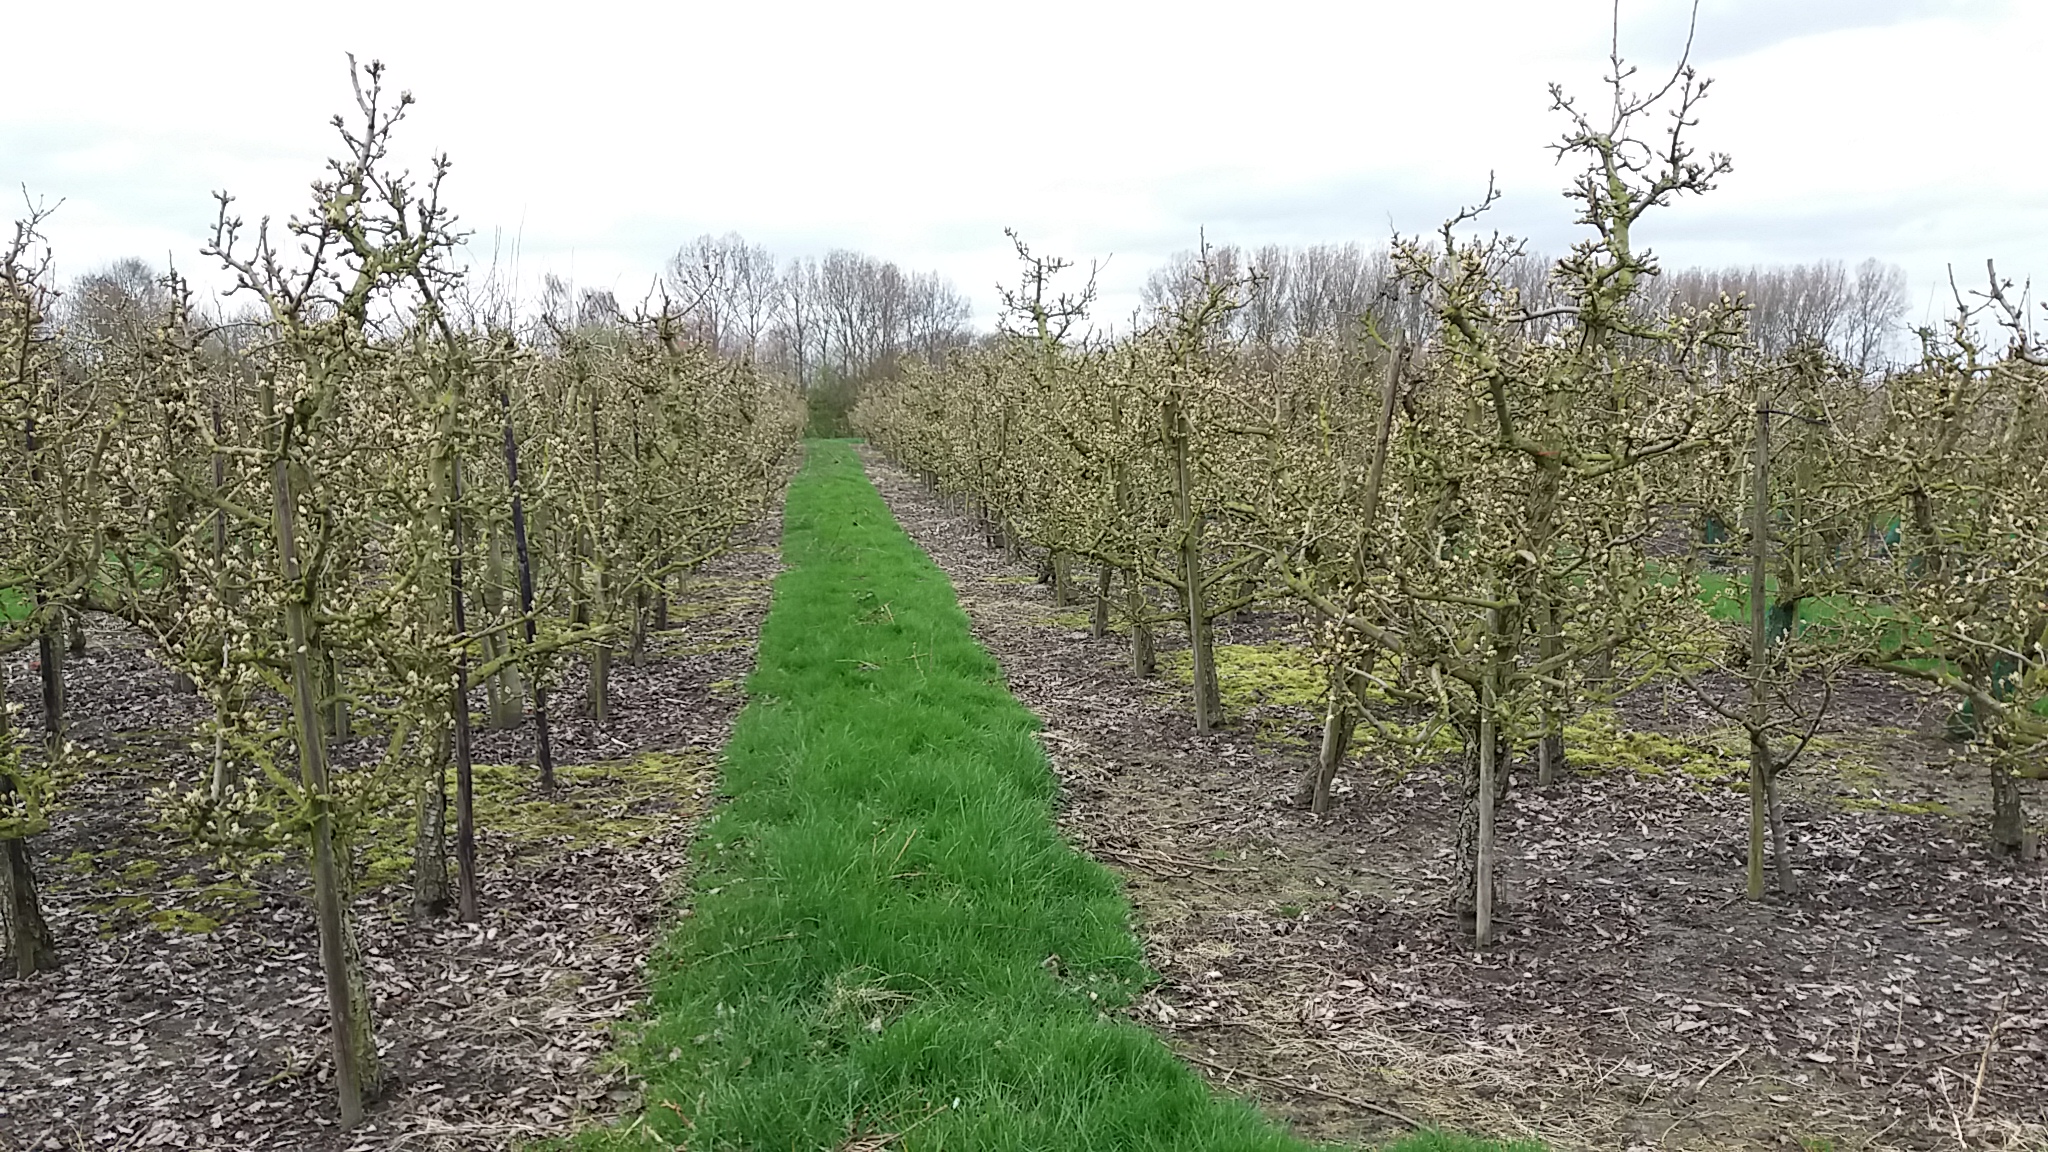
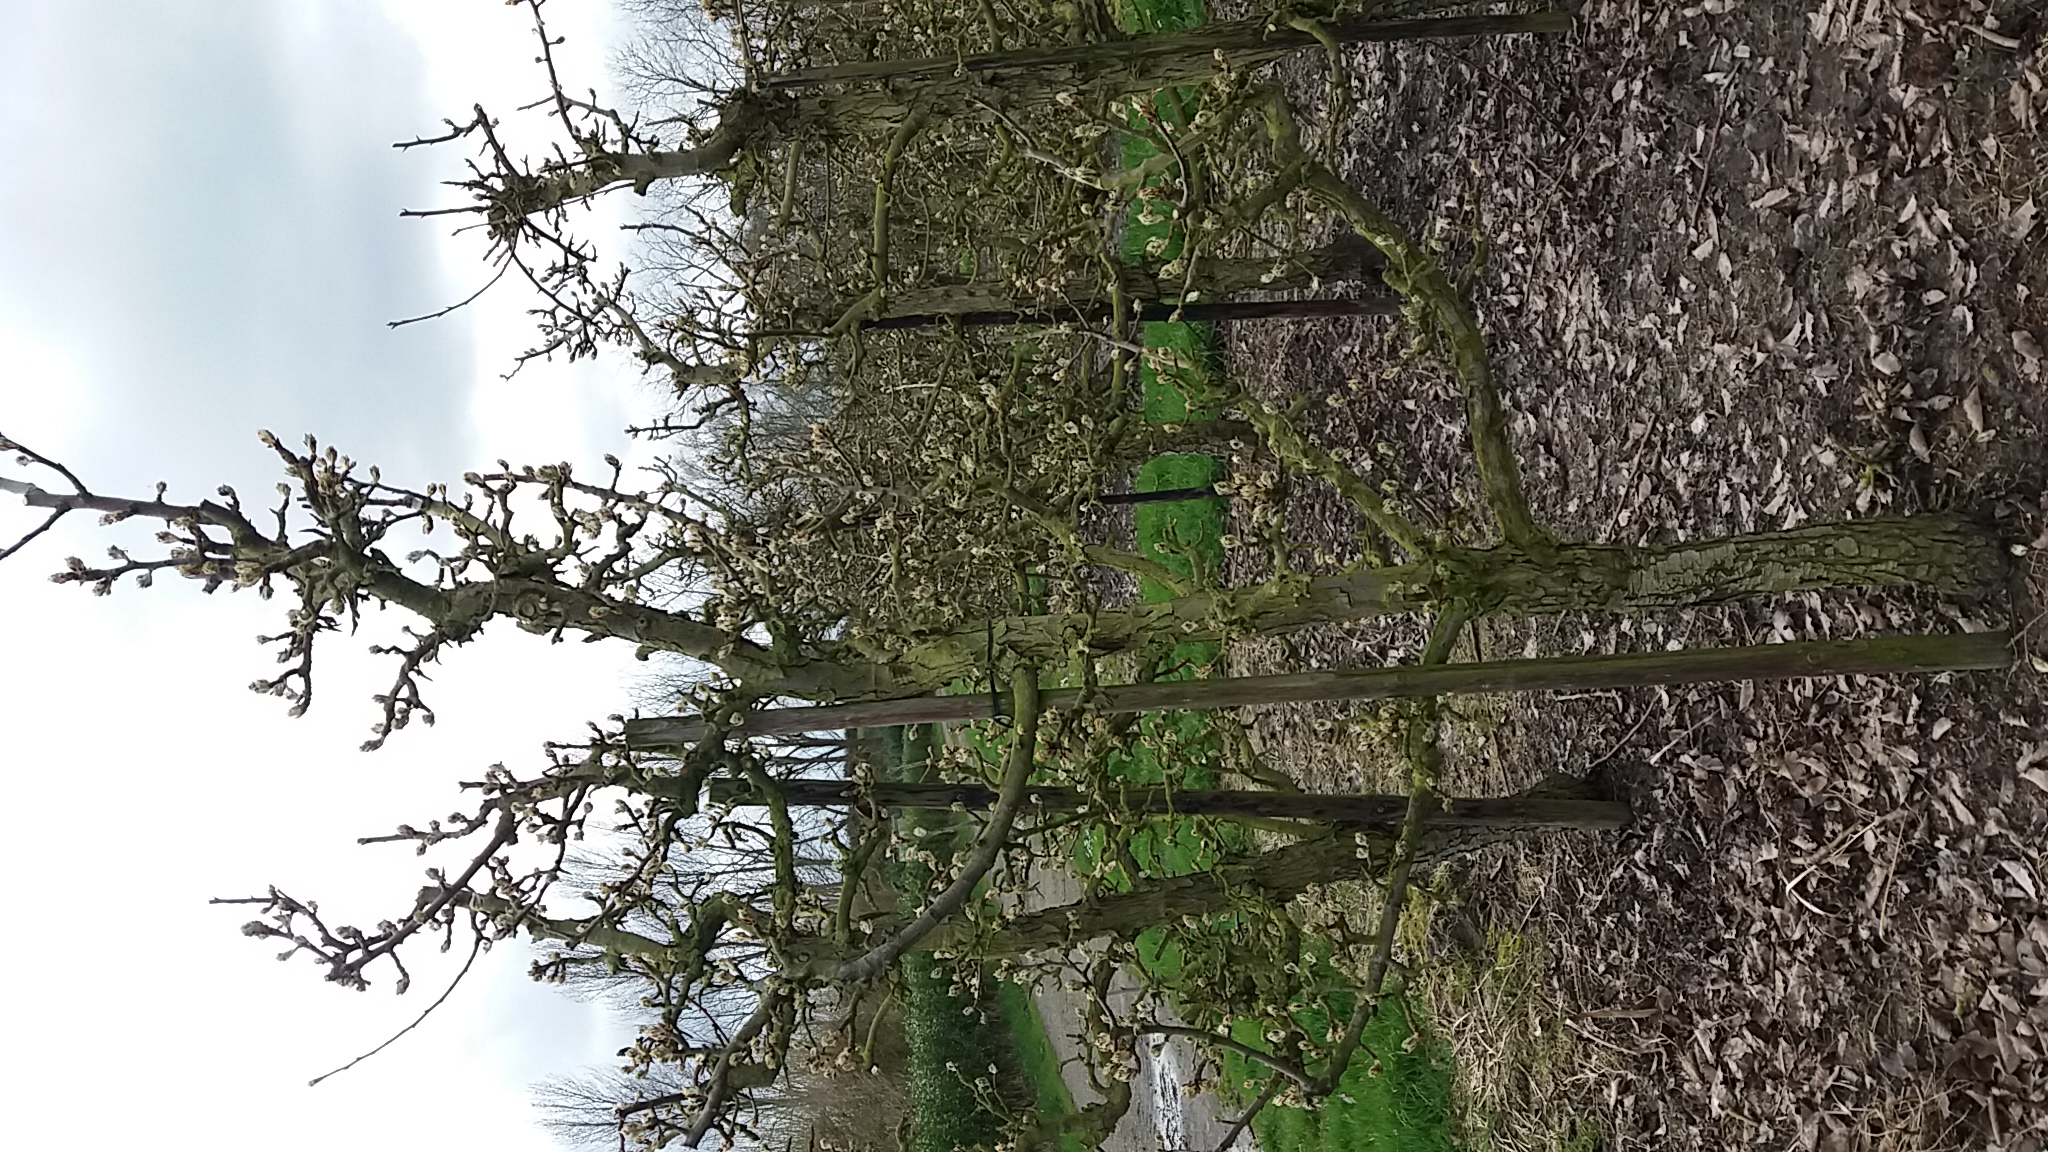
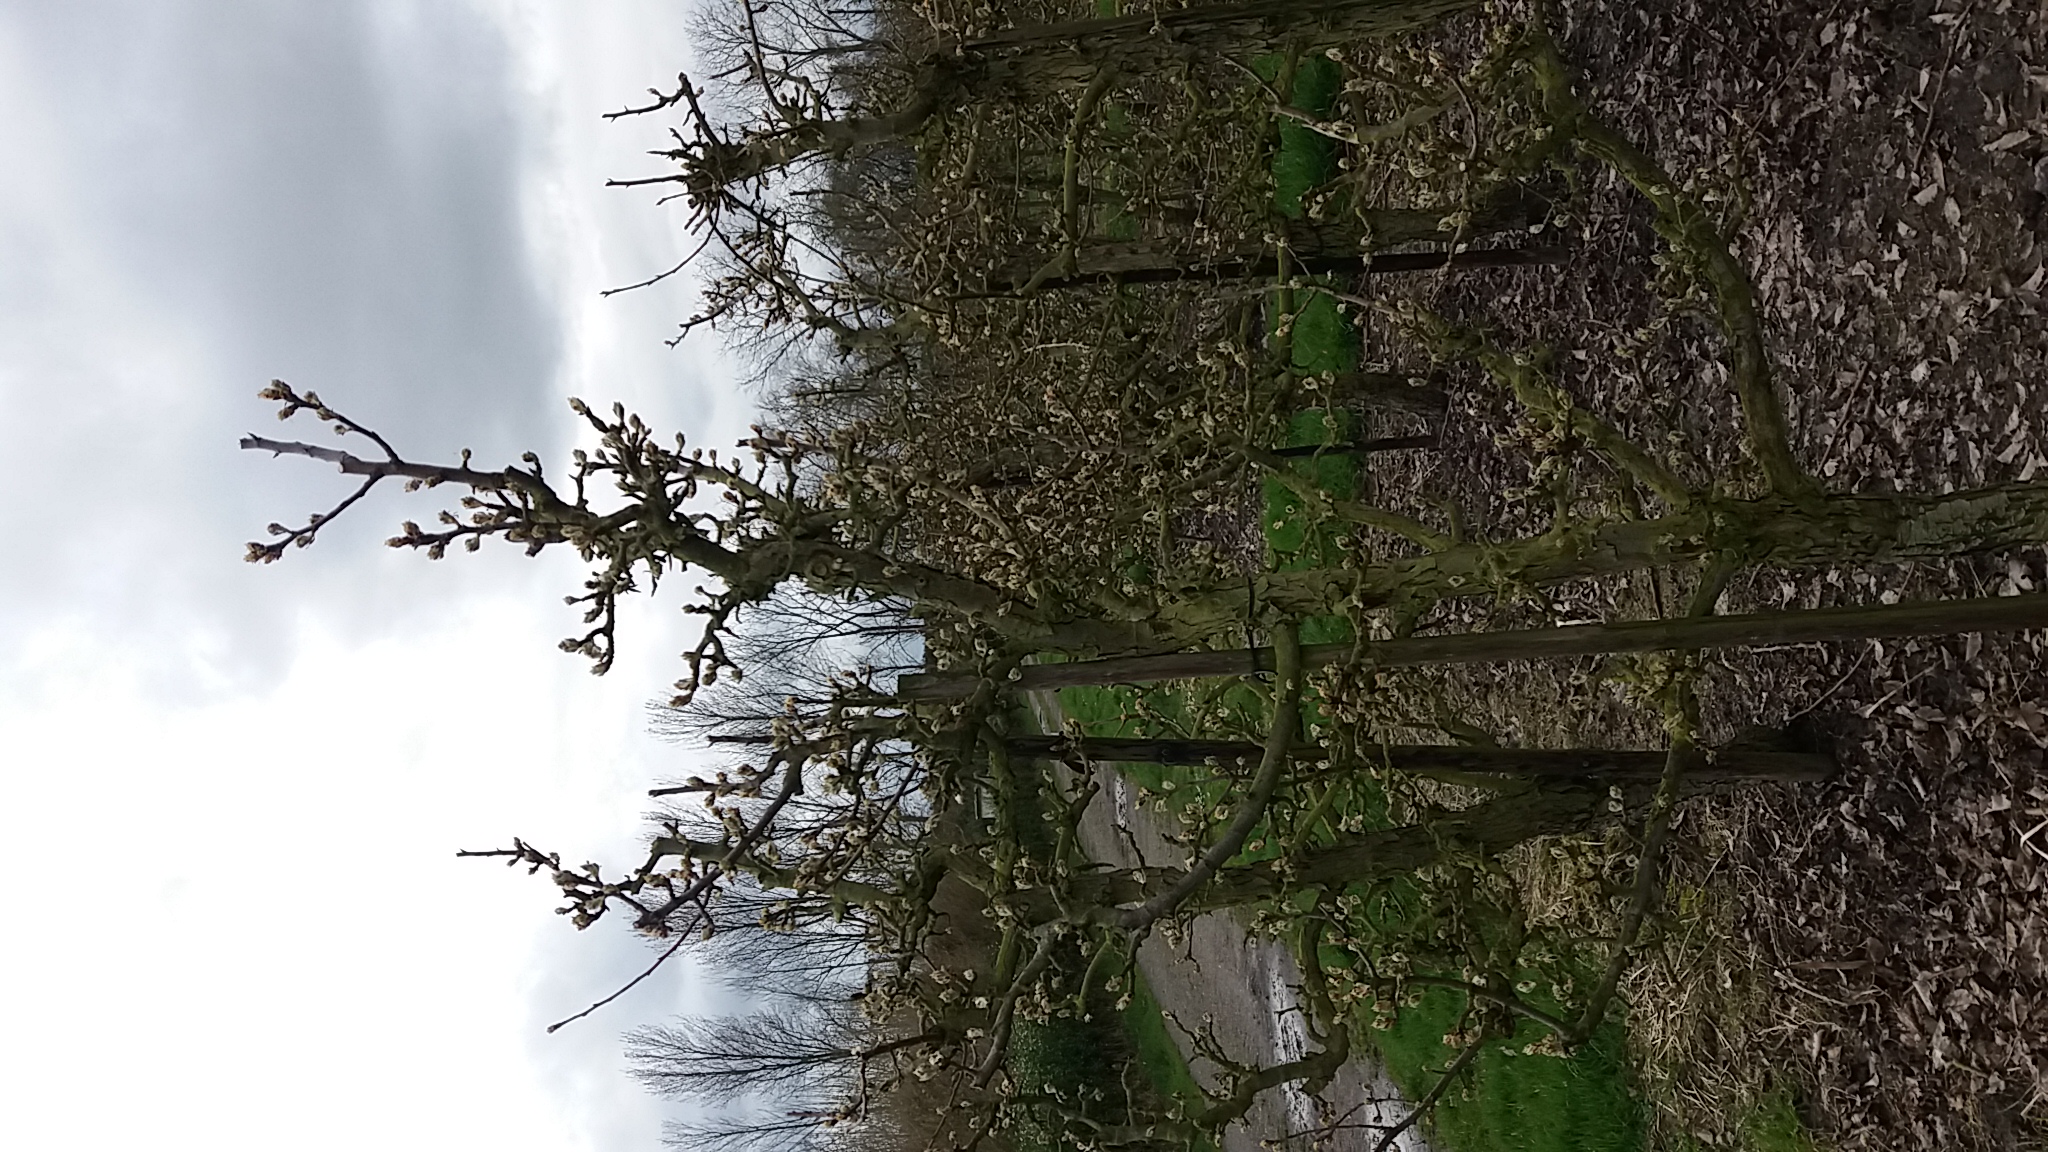
To get a good view of the orchard, some pictures where taken. The orchard is build up with columns of trees. Each row in the column consists of either 4 trees or just 1 tree. Which can be seen in the picture below. The first and last row of a column, is a most of the time an exception, there are sometimes just 2 or 3 trees, when the rest of the rows consist of 4 trees.
A picture of the strip of grass between two columns of trees.
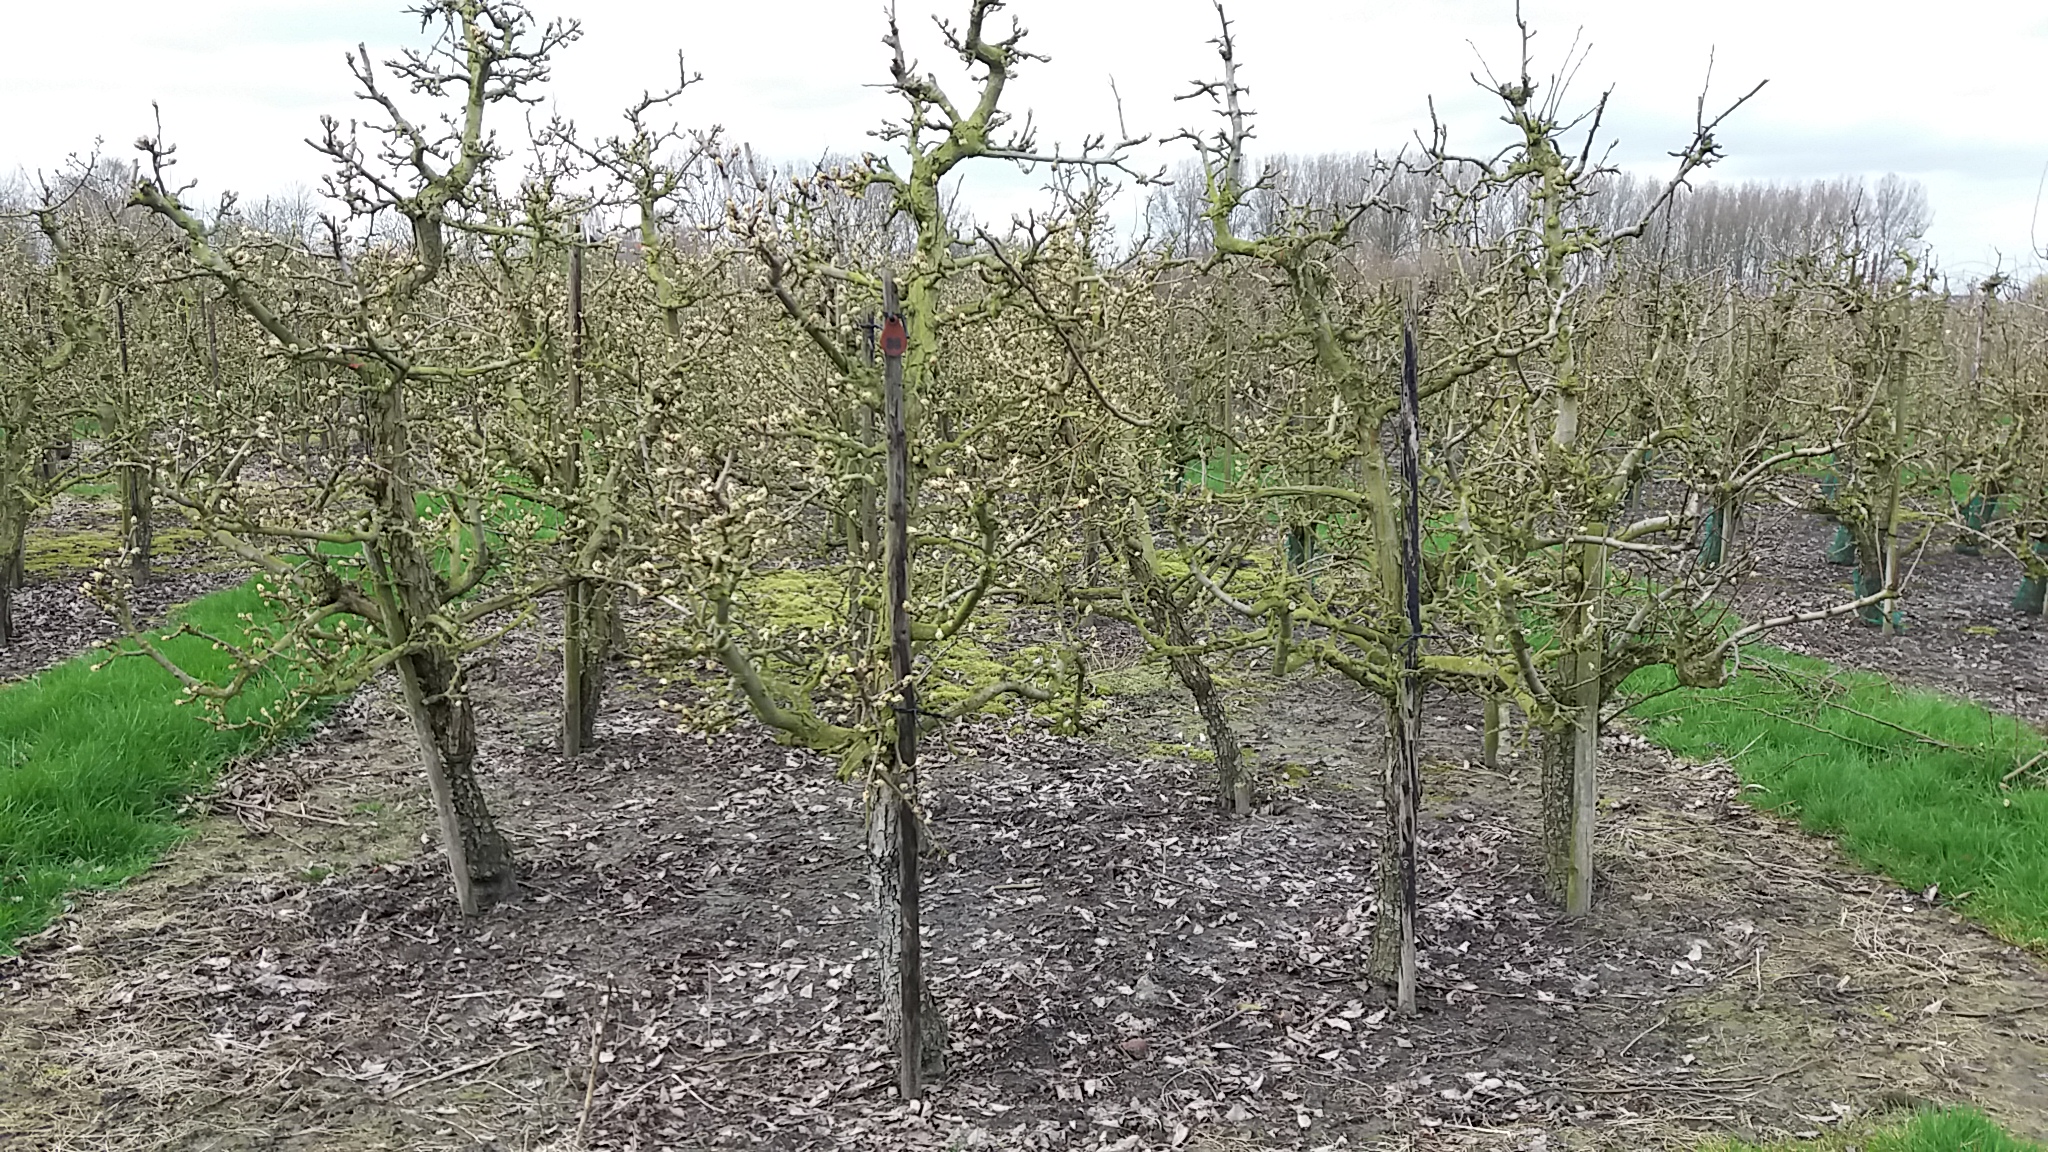
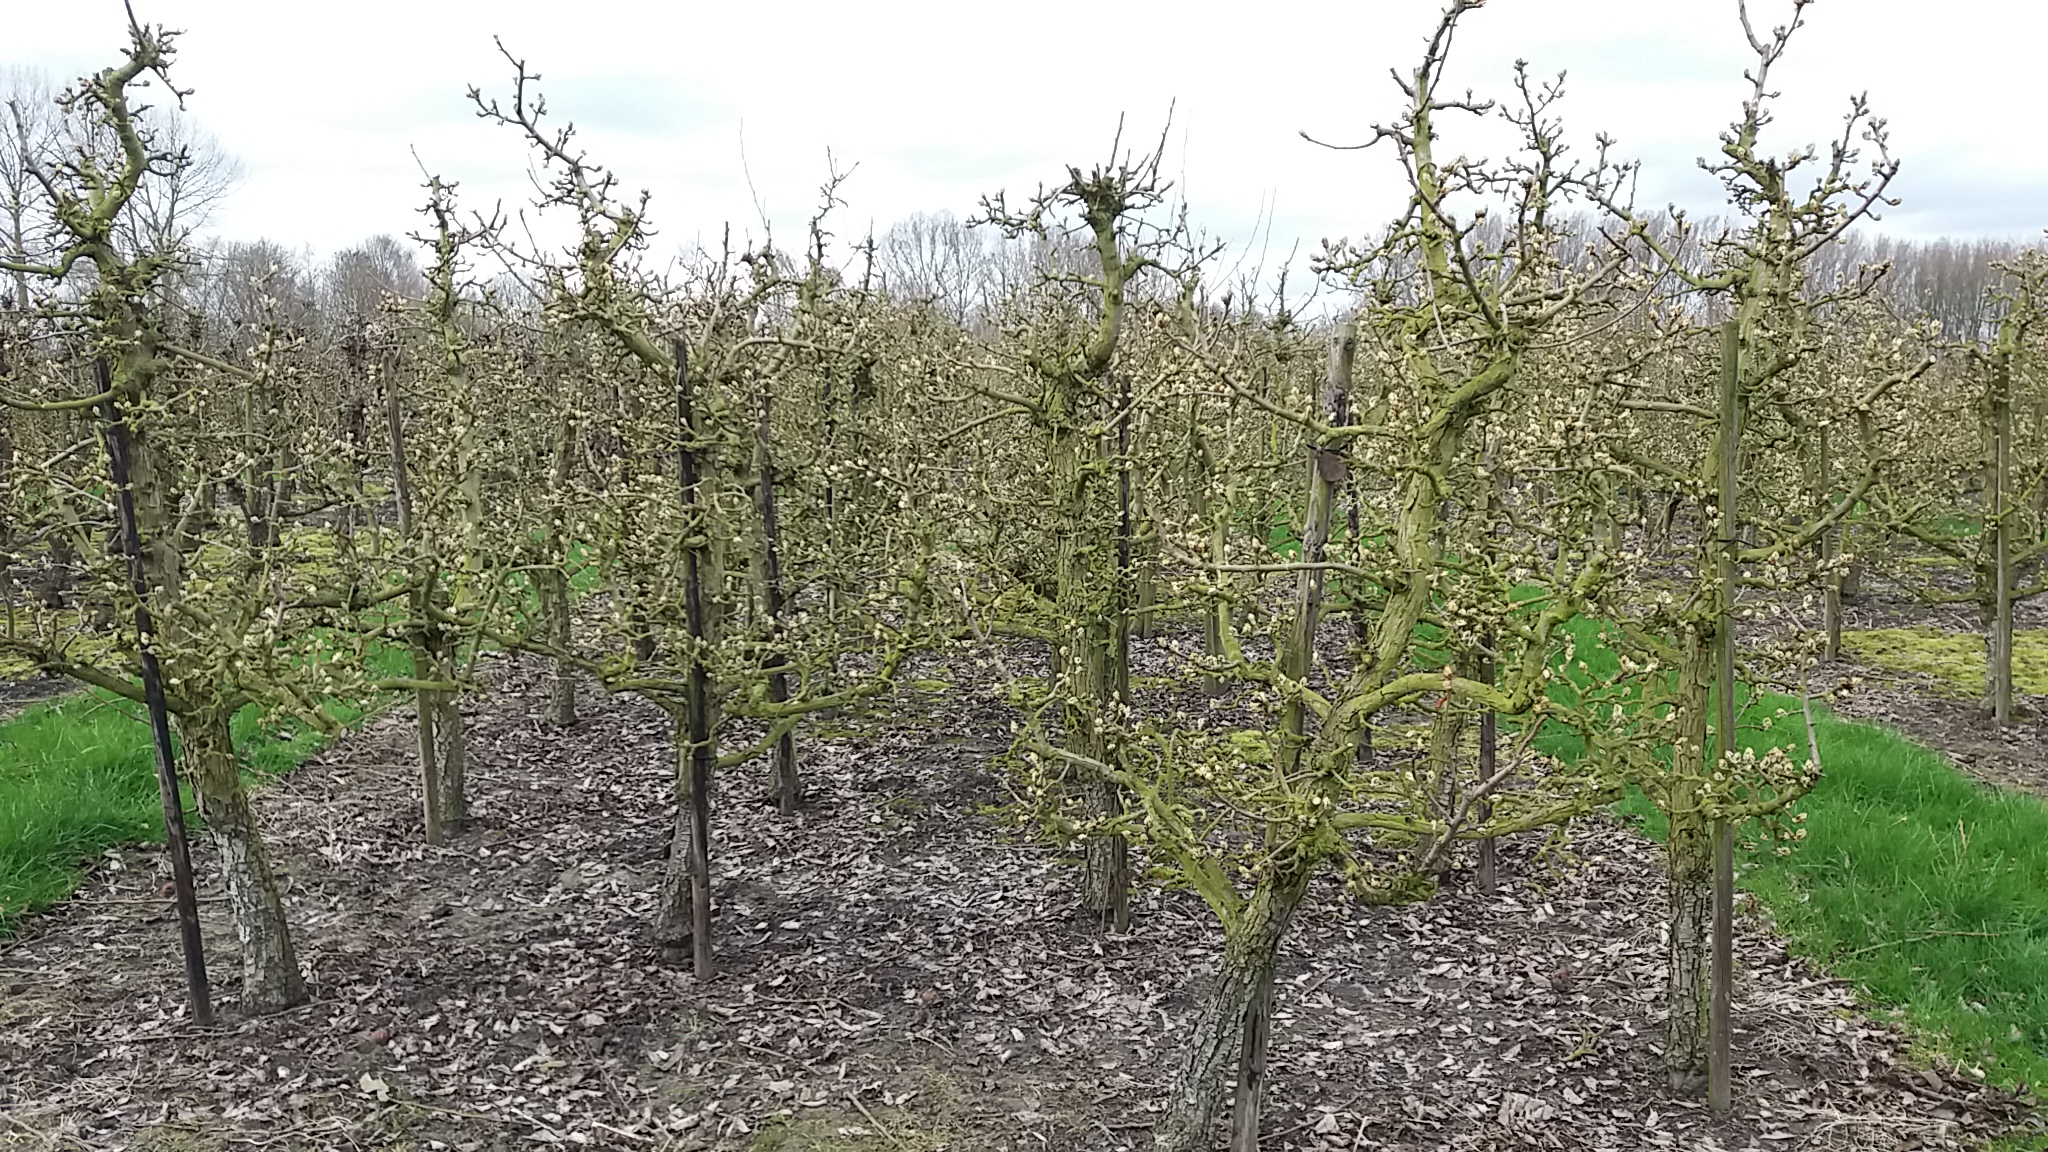
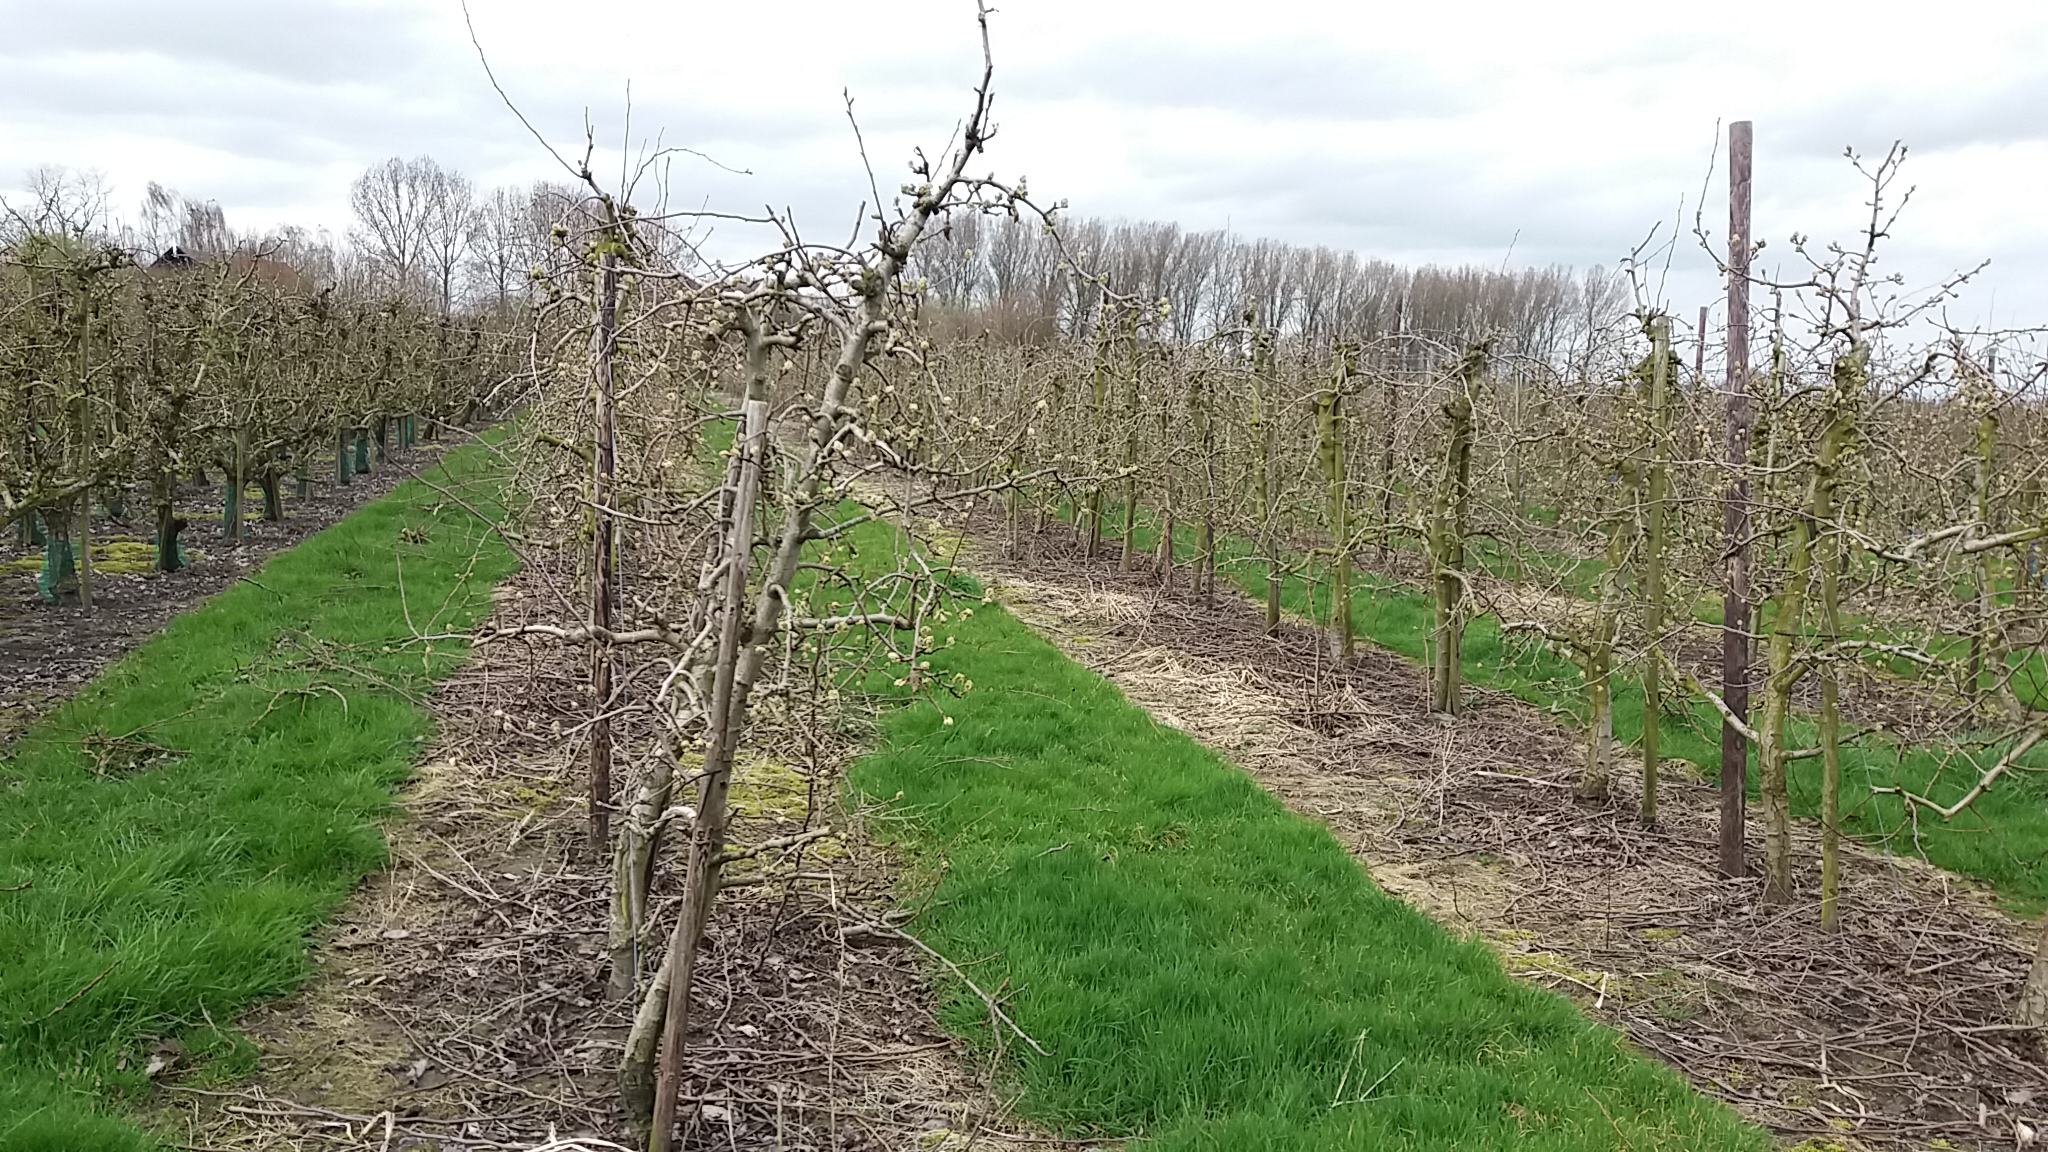
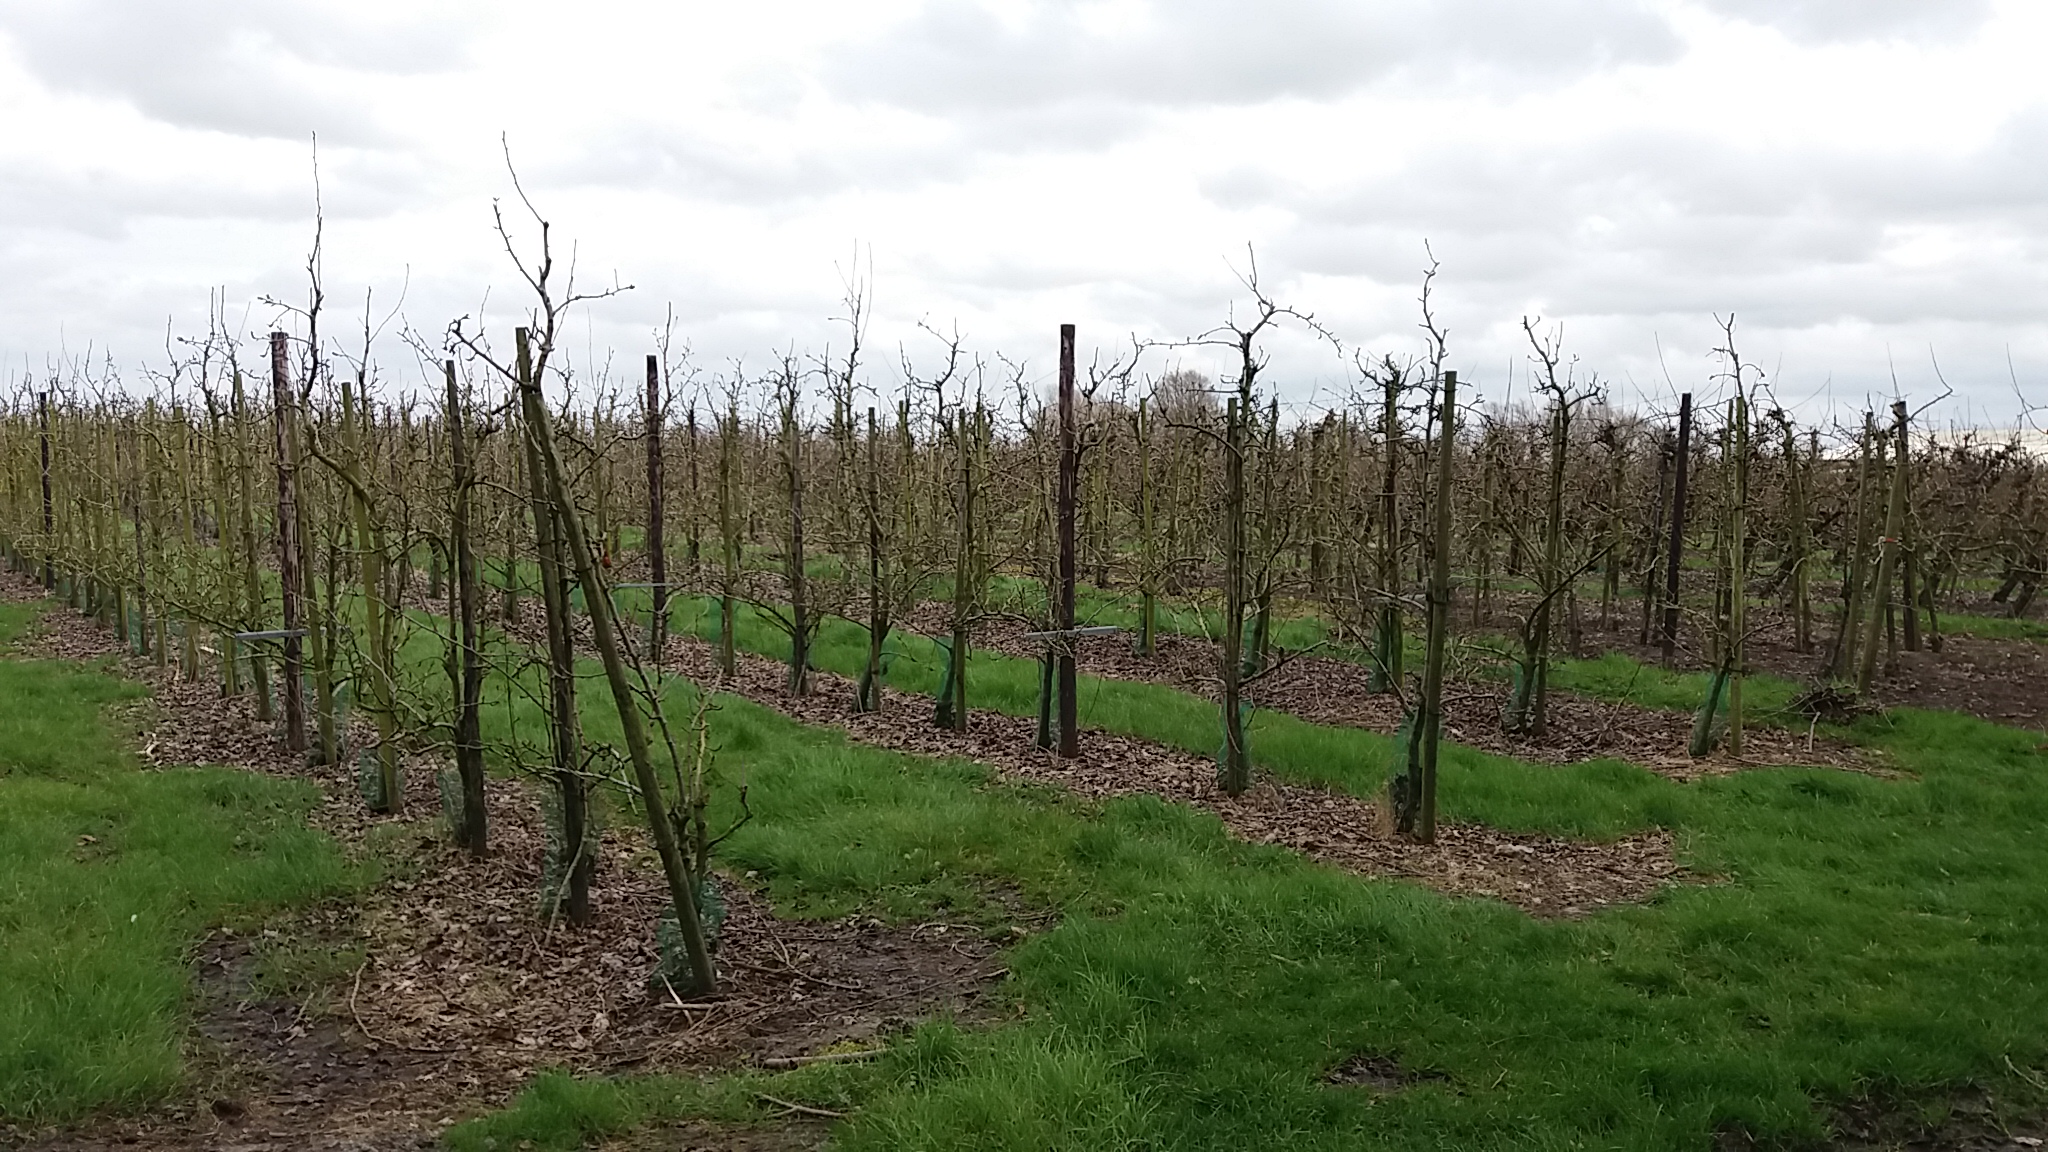 Pictures of columns with rows consisting of 4 or a single tree.
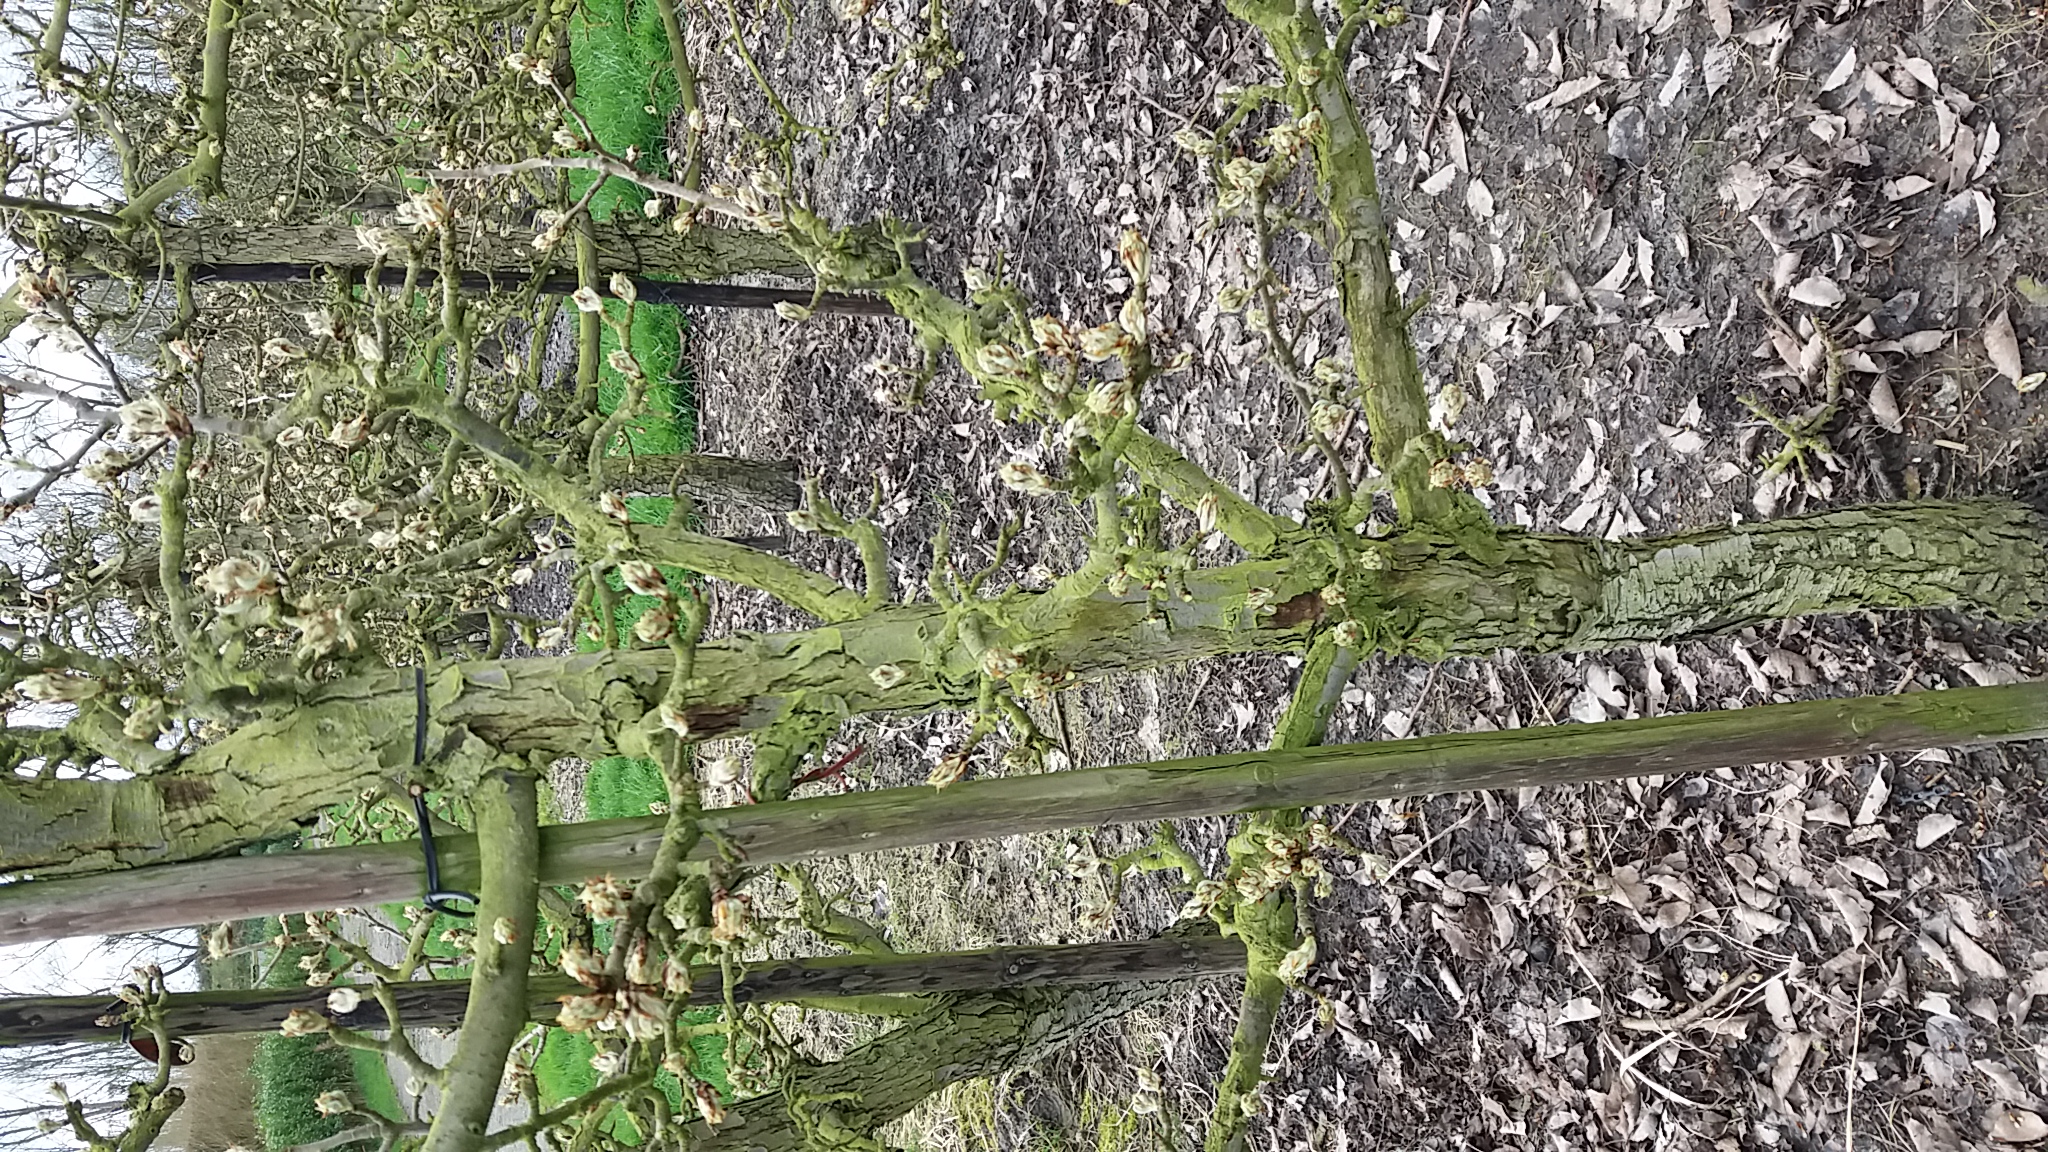
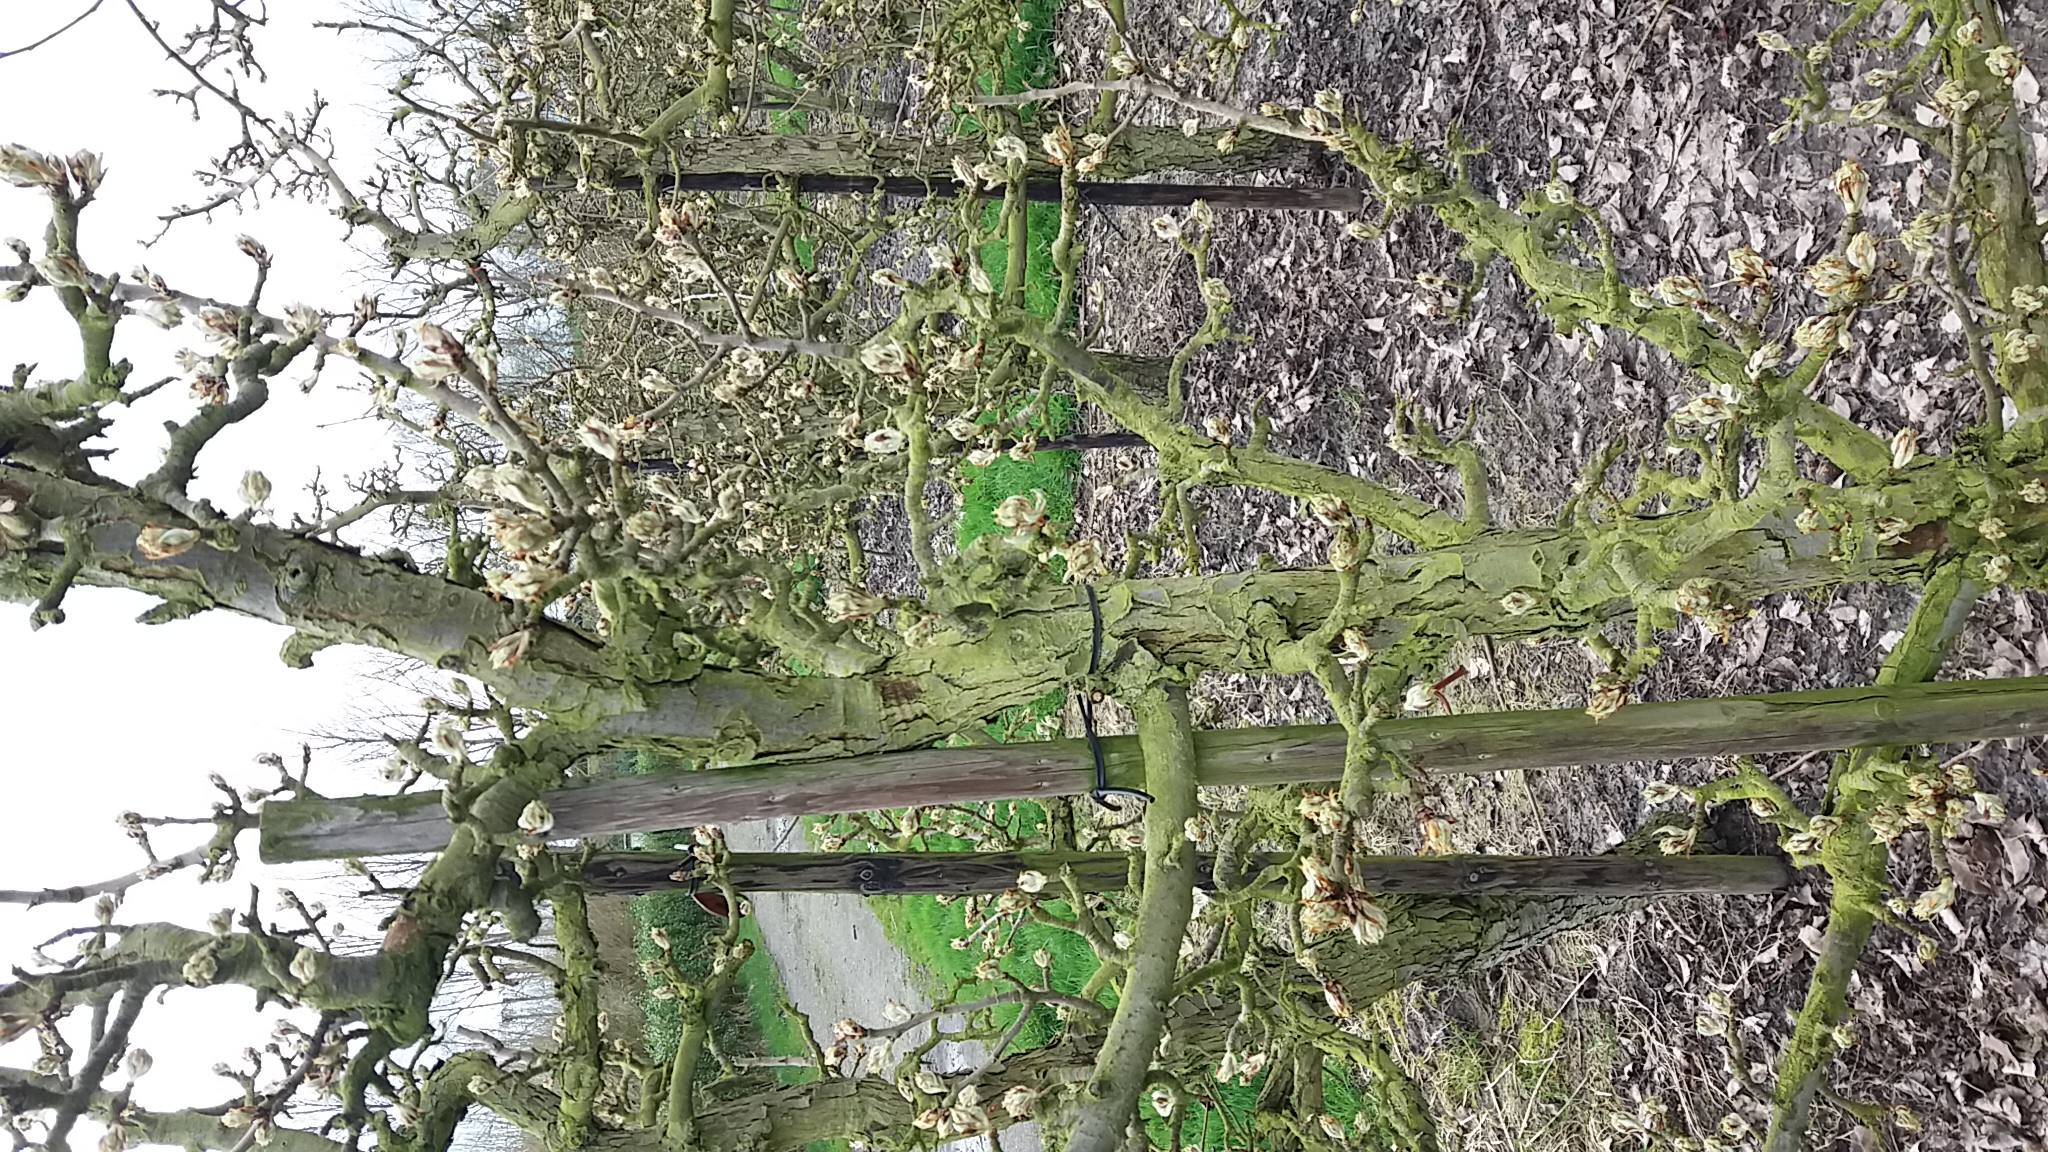
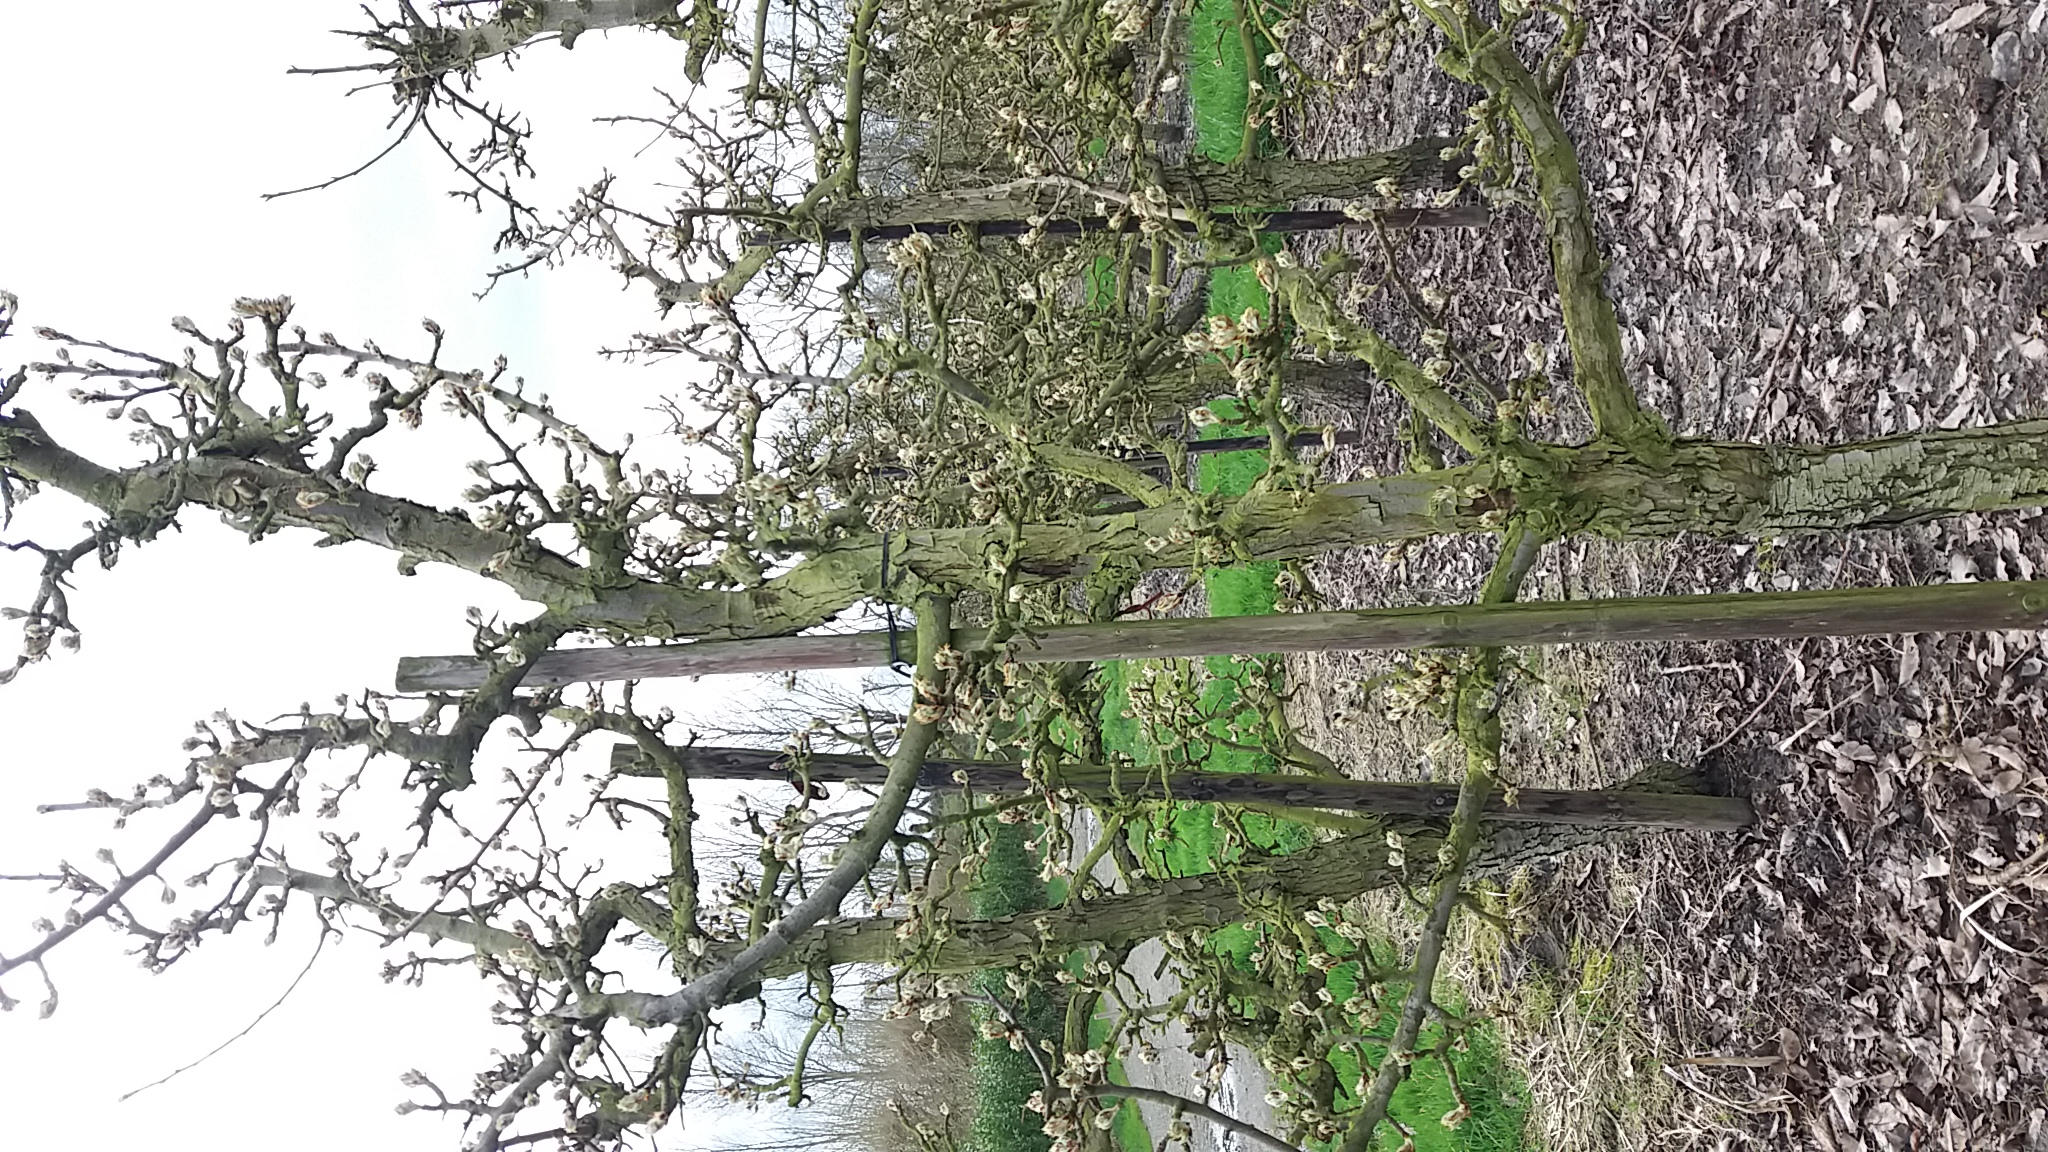
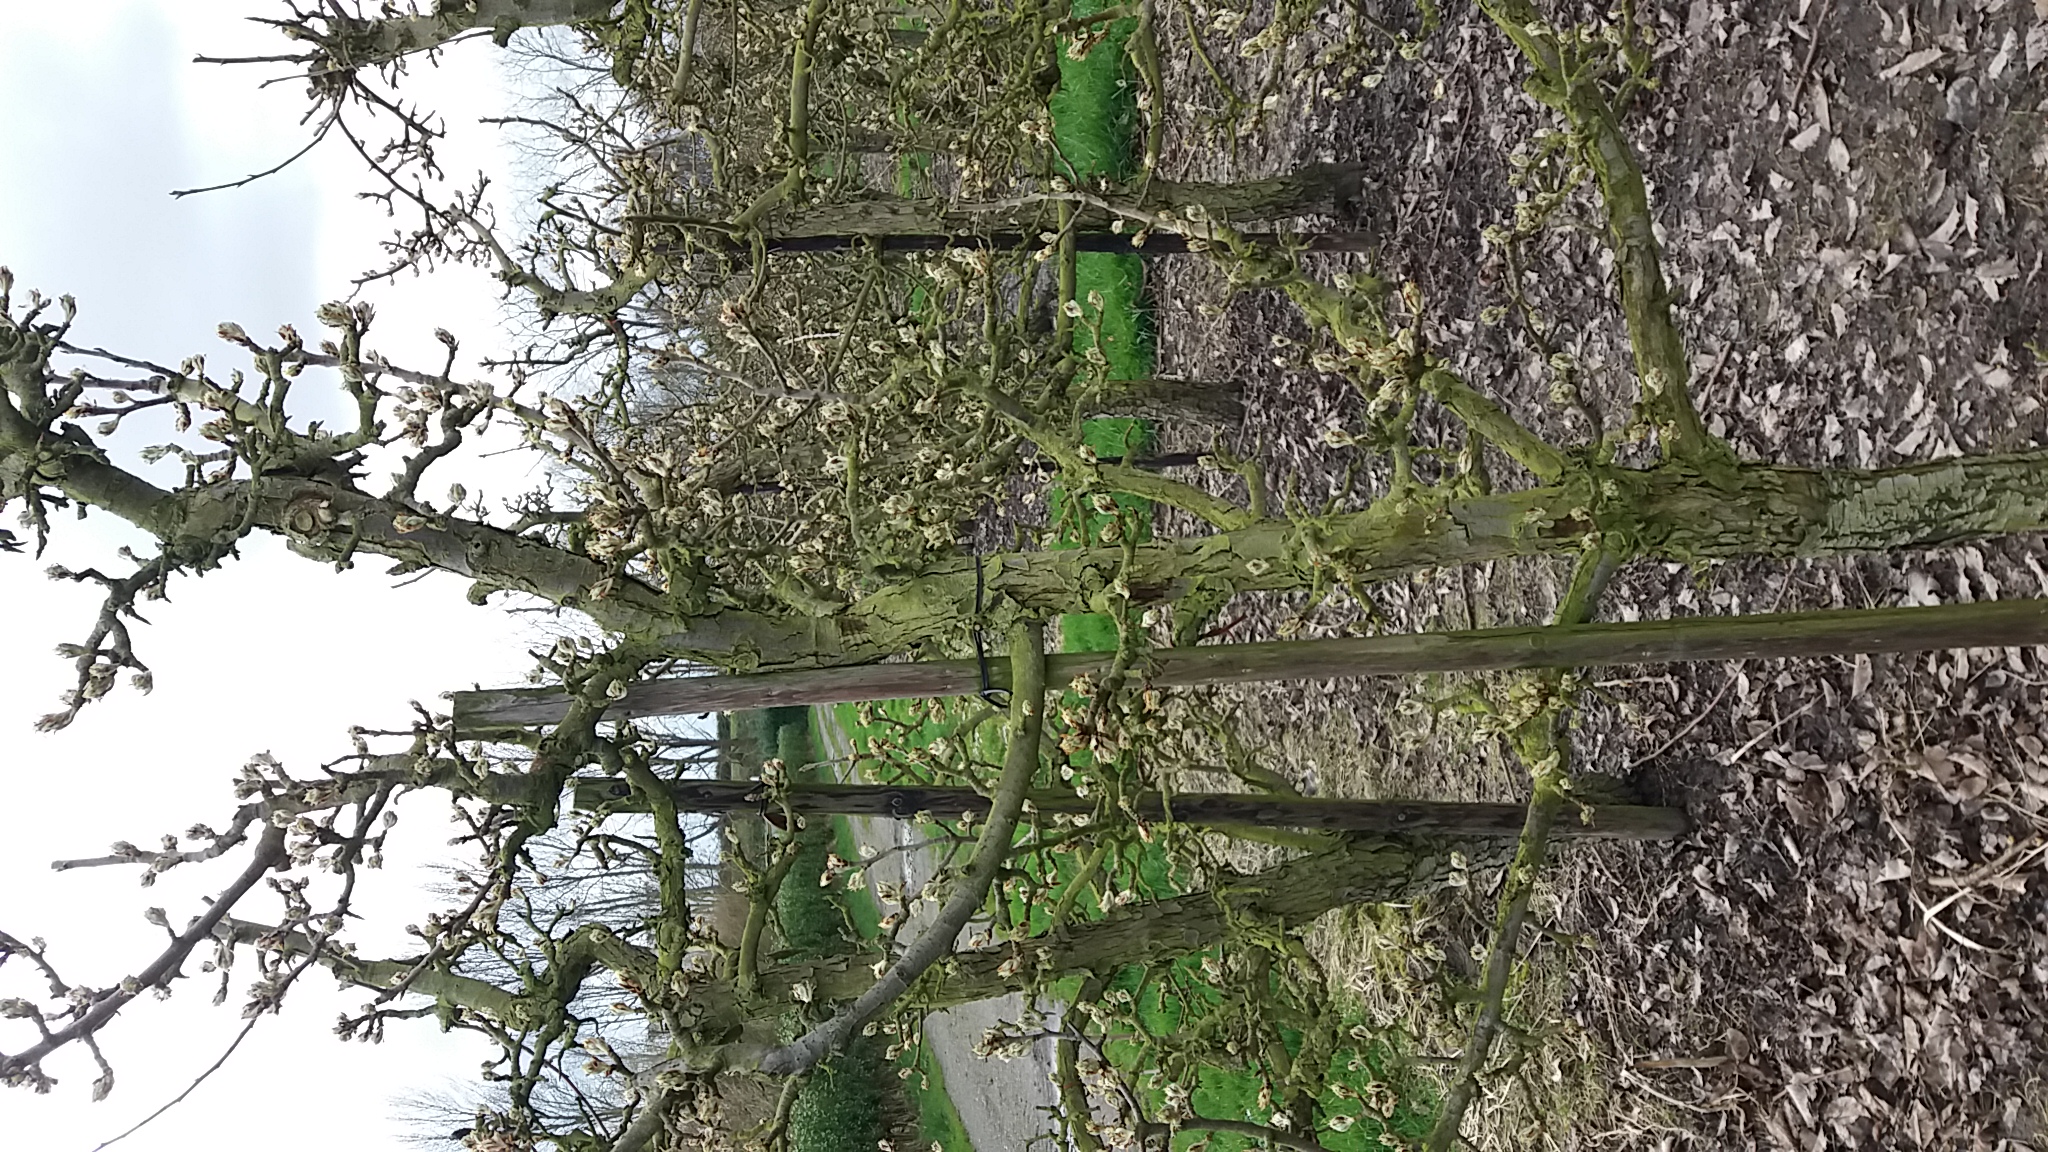
As can be seen on the pictures, there is a strip of grass between each column of trees, this strip of grass is 3/3.5 meters wide. To find out at which height and distance the drone has to take pictures, we took some pictures at different height and distance. This was done to check, at which distance and height a full tree could be seen by the camera. Pictures were made at approximately 1, 2 and 3 meters. As can be seen in the pictures below the pictures at 3 meters are the best ones, the tree is then fully in view. The height of the camera was changed from approximately 1.25 meters to 1.55 meters. For some reason we could not turn the pictures at wiki that is why they are turned left.
Picture of a tree at a distance of 1 meter and at a height of 1.25 meters.
Picture of a tree at a distance of 1 meter and at a height of 1.55 meters.
Picture of a tree at a distance of 2 meters and at a height of 1.25 meters.
Picture of a tree at a distance of 2 meters and at a height of 1.55 meters.
Picture of a tree with a distance of 3 meters and at a height of 1.25 meters.
Picture of a tree with a distance of 3 meters and at a height of 1.55 meters.
As can be noticed, the trees are not in a straight line, so if a row consists of 4 trees, sometimes the second or even third tree in the row will be visible, because the first tree in the row will not fully block the further trees in that specific row. Howeve in July, August and September, when the trees have a lot of leaves this phenomena will be less. Also this has to be taken into account, when counting apples, because you make the calculation based on the first tree in the row. In conclusion the drone has to fly at a distance of about 3 meters and at a height between 1.25 and 1.55 meters to get the first tree in the row fully in view.
Planning:
Week 2
Create datasets
Preliminary design of the app
First version of the neural network
Research everything necessary for the wiki
Update the wiki
Week 3
Find more data
Coding of app
Improve accuracy of neural network
Edit wiki to stay up to date
Get information about the possible robot
Setup of Raspberry Pi
Week 4
Finish map of user interface
Go to an orchard for interview
Implement user wishes into the rest of the design
Week 5
Implement the highest priority functions of the user interface
Week 6
Reflect on application by doing user tests
Reflect on whether the application conforms to the USE aspects
Week 7
Implement user feedback in the application
Week 8
Finish things that took longer than expected
Milestones
There are five clear milestones that will mark a significant point in the progress.
- After week 2, the first version of the neural network will be finished. After this, it can be improved by altering the layers and importing more data to learn from.
- After week 4, we have taken an interview with a possible end-user. This feedback will be invaluable in defining the features and priorities of the app.
- After week 5, the highest priority functions of the user interface will be present. This means that we can let other people test the app and give more feedback.
- After week 7, all of the feedback will be implemented, so we will have a complete end product to show at the presentations.
- After week 8, this wiki will be finished, which will show a complete overview of this project and its results.
Deliverables
- A system prototype that is able to recognize ripe apples out of a dataset containing unripe apples and apples with diseases for orchard farmers.
- The wiki page containing all information regarding the project.
- A presentation about the product
Logbook
| Week | All | Sven | Willem | Rick | Rik | Beau | |
|---|---|---|---|---|---|---|---|
| 1 (3-2 / 9-2) | Wiki page | Neural network training database[8], more in depth defining/researching on subject[4], wiki[2] | looking for webapp frameworks [4] learning c# [6] htmlcss [2] | Designing neural network[10], wiki[6] | Neural network training database[10], References regarding neural network and fruit recognition[4], wiki[1] | Specifying objectives [2], sketching ideas of desktop application [8] | |
| 2 (10-2 / 16-2) | Meeting/Working with the whole group [8] | search and ordering necessary raspberry pi components[1], interview with farmer/user[4], wiki[4] | c# [4] Building NetCore webapp [10] | Object detection with Tensorflow [8] | References regarding neural network and fruit counting [4], wiki[4], | Following a tutorial for web application [12] | |
| 3 (17-2 / 23-2) | Meeting/Working with the whole group [5] | Help making animation with Rik [4], writing the conclusion part after interview [2], writing diseases part [4] | Database[1], logo[1], website [3], c# [3], bootstrap 4 [3] | Setup Raspberry Pi [6], wiki[2] | Animation[14], wiki[2] | Following a tutorial for web application [12] | |
| 4 (2-2 / 8-3) | Working on neural network database (pictures) [6], researching data processing part of counting apples[8] | configuring database to site, implementing account creating services, google maps API [16] | Working on neural network[20] | Training neural network database [8], wiki[1], animation[4] | Training neural network database [7], Updating Wiki [2], Finding references [3] | ||
| 5 (9-3 / 15-3) | Visiting the orchard of our user (Jos van Assche), to see how the drone should fly and ask some questions[4], researching the Kalman filter and the Hungarian Algorithm [8], writing the parts mentioned above on the wiki[6] | Working on the user-interface of the website (8) google maps grid (4) wiki (1) | Getting neural network working on Raspberry Pi [8], updating wiki [8] | Updating wiki [4], Research on processing part of counting apples[4], Training neural network database [8] | Updating Wiki [2], Doing research on number of apples which need to be checked [6] | ||
| 6 (16-3 / 22-3) | Extend the User part (info from (regional) newspapers), which was not updated yet on the wiki[4], researching the certainty of the neural network and the camera [4], reading and giving feedback on other parts on the wiki [4] | Finding references [4], starting on presentation lay-out[6] | |||||
| 7 (23-3 / 29-3) | |||||||
| 8 (30-3 / 2-4) |
[ ] = number of hours spent on task
References
- ↑ https://www.nfofruit.nl/sites/default/files/bestanden/pdf%20archief/Elstar.Fruitteelt%2026%202011%20Elstar%20hangt%20vaak%20te%20vol.pdf
- ↑ https://www.omroepzeeland.nl/nieuws/114402/Gevolg-hitte-Deze-verbrande-appels-noem-ik-appelmoes-met-een-velletje
- ↑ https://www.nieuweoogst.nl/nieuws/2019/07/30/hoge-temperatuur-treft-appel-harder-dan-peer
- ↑ https://www.pzc.nl/zeeuws-nieuws/kwart-minder-zeeuws-fruit-door-hitte~aae39dad/
- ↑ https://www.ad.nl/koken-en-eten/appelboeren-sproeien-zich-een-ongeluk-om-hun-oogst-te-redden~a2885365/
- ↑ https://www.sciencedirect.com/science/article/pii/S2589721719300182
- ↑ https://elibrary.asabe.org/abstract.asp?aid=7425
- ↑ https://www.sciencedirect.com/science/article/pii/S1364815299000079
- ↑ https://ieeexplore.ieee.org/abstract/document/1488826
- ↑ http://www.ijirset.com/upload/2019/january/61_Surveying_NEW.pdf
- ↑ Gao H., Cai J., Liu X. (2010) Automatic Grading of the Post-Harvest Fruit: A Review. In: Li D., Zhao C. (eds) Computer and Computing Technologies in Agriculture III. CCTA 2009. IFIP Advances in Information and Communication Technology, vol 317. Springer, Berlin, Heidelberg
- ↑ https://www.ijrte.org/wp-content/uploads/papers/v8i3s3/C10301183S319.pdf
- ↑ Rahnemoonfar, M. & Sheppard, C. 2017, "Deep count: Fruit counting based on deep simulated learning", Sensors (Switzerland), vol. 17, no. 4.
- ↑ Chen, S.W., Shivakumar, S.S., Dcunha, S., Das, J., Okon, E., Qu, C., Taylor, C.J. & Kumar, V. 2017, "Counting Apples and Oranges with Deep Learning: A Data-Driven Approach", IEEE Robotics and Automation Letters, vol. 2, no. 2, pp. 781-788
- ↑ https://resource.wur.nl/nl/show/Pluk-o-Trak-maakt-appeloogst-high-tech-.htm
- ↑ https://github.com/EdjeElectronics/TensorFlow-Object-Detection-API-Tutorial-Train-Multiple-Objects-Windows-10
- ↑ https://github.com/EdjeElectronics/TensorFlow-Lite-Object-Detection-on-Android-and-Raspberry-Pi#part-1---how-to-train-convert-and-run-custom-tensorflow-lite-object-detection-models-on-windows-10
- ↑ https://github.com/EdjeElectronics/TensorFlow-Lite-Object-Detection-on-Android-and-Raspberry-Pi/blob/master/Raspberry_Pi_Guide.md
- ↑ https://medium.com/@jonathan_hui/ssd-object-detection-single-shot-multibox-detector-for-real-time-processing-9bd8deac0e06
- ↑ https://ieeexplore.ieee.org/stamp/stamp.jsp?tp=&arnumber=8483037
- ↑ https://arxiv.org/pdf/1804.00307.pdf
- ↑ https://ieeexplore.ieee.org/stamp/stamp.jsp?tp=&arnumber=8594304
- ↑ https://ieeexplore.ieee.org/stamp/stamp.jsp?tp=&arnumber=7814145&isnumber=7797562&tag=1
- ↑ https://machinelearningspace.com/2d-object-tracking-using-kalman-filter/
