Viotar/Model
ModelIn order to predict the results of experiments for validation and to make the designing of the controller more easy, a model of the vibration of a bowed string will be made. This model is made in matlab and will be discussed in the following chapter. Friction curve modelSimple approximationIn simple models of the interaction between bow and string, it is asumed that the friction force between both only depends on the relative speed of the string in relation to the bow. The relation between the relative speed and friction force has an exponential shape in these models. This can also be seen in figure 3. In this figure v is the speed of the string, where vb is the bowing speed. The friction force on the interaction area of the bow and the string, can be calculated using: [math]\displaystyle{ f = \mu(v-v_b)f_b }[/math] Where µ is the friction coefficient and fb is the applied force on the bow. 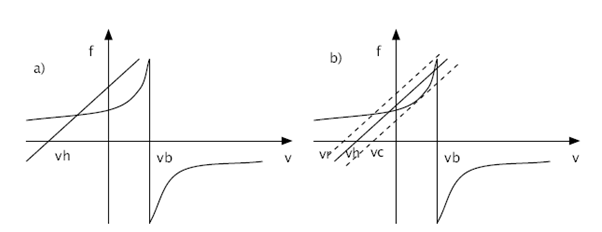 There are several models for the friction coefficient µ. The hyperbolic model is described as follows: [math]\displaystyle{ \mu = \mu_d + {{(\mu_s-\mu_d)v_0} \over {v_0 + v + v_b}} }[/math] where: vo = initial bowing speed µd = dynamic friction coefficient µs = static friction coefficient (In most cases, the values µd = 0.3 and µs = 0.8 are used)
[math]\displaystyle{ \mu = 0.4e^{{v-v_b}\over{0.01}} + 0.45e^{{v-v_b}\over{0.1}} + 0.35 }[/math] 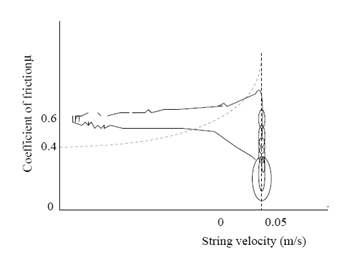 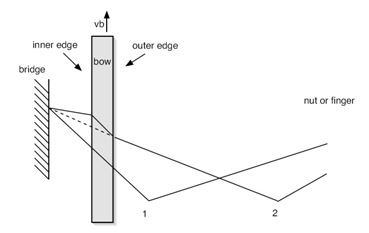 In figure 3, also the relation between applied force and caused velocity of the string is shown. This dynamical behaviour of the string is approximately linear, as experiments proved. The release velocity vr and capture velocity vc are shown in figure 3 b). The are the velocities at which the string respectively slips of the bow or sticks on it. This phenomenon can be explained as follows. When the velocity of the string increases, the string keeps slipping on the bow until the capture velocity is reached. At this velocity the string sticks on the bow and therefor has the same velocity. The string will remain sticking until the release velocity is reached. At that point, the string starts slipping over the bow. This means that the force equation has a different solution when the relative speed increases than it has when the relative speed decreases. This is due the fact that the friction coefficient for slipping differs from the friction coefficient for sticking. Friction model vs. ExperimentIn the simple friction curve model, like it is presented in figure 3, it is assumed that the friction force only depends on the relative force between the string and the bow. However, experiments have proved that the true situation is not quite as simple as that. The dotted line in figure 4 shows the relation between string velocity and friction coefficient as described by the model above. The continuous line shows the real situation, which has been measured experimentally. From this figure it can be concluded that the classical approach is quite unprecise. Verklaringen voor fouten in het frictiemodelOne of the reasons for this, is that the temperature of the interaction area is of very high importance. This is because of the melting temperature of the rosin. When the relative speed is low, the contact area cools down due to conductance in the string and bow. This causes the friction coefficient to increase. When more 'slip' behaviour occurs, this causes the temperature to raise and therefor the friction coefficient tot decrease rapidly. Een ander verschijnsel dat veel invloed blijkt te hebben op de wrijvingskracht tussen boog en snaar, is de zogenaamde bow hair-compliance. Deze afwijking wordt veroorzaakt door het feit dat de boog niet op één punt contact maakt met de snaar, zoals verondersteld in het klassieke model, maar een contactgebied heeft. Het verschil is dat het voor een contactpunt wel mogelijk is dat de snaar zonder ‘slip’ de boog volgt, terwijl dit voor een contactgebied niet mogelijk is. In figuur 5 wordt aangegeven waarom dit niet mogelijk is. Situatie 1 is hierbij de uitgangssituatie. Hierin staat de boog op de snaar en is de snaar geëxciteerd. Een tijdsinterval later (situatie 2) is de boog met een snelheid vb omhoog bewogen en is de snaar door ‘stick’ gedrag meegenomen. De gestippelde lijn geeft de situatie weer zoals deze in werkelijkheid optreedt. De getrokken lijn geeft weer hoe vorm van de snaar zou moeten zijn als de snaar zonder enige vorm van ‘slip’ meegnomen zou zijn. Het moge duidelijk zijn dat deze situatie niet optreedt en er dus nooit geheel zonder ‘slip’ gestreken kan worden. Another phenomenon that turns out to have a lot of influence, is the so called hair-compliance. This error is occured by the fact that the bow doesn't have one single contact point with the string (like assumed in the simple model), but in fact has a whole contact area. The difference is that for the first case it is possible to have absolutely no slip while the string follows the bow, while in the second case slip is always present. This difference is also shown in figure 5. In this figure, situation 1 indicates the initial string and bow. One time step later (situation 2) the bow has moved upwards with velocity vb and the string has sticked on the bow. Now, the dashed line represents the real situation, like it would be in realtity, where the continuous line indicates what shape the string should have as no slip had occured. It should be clear that this 'no slip situation' would never occur in reality and therefor bowing without any slip is impossible Uit experimenten is echter wel gebleken dat de simpele voorstelling van de wrijvingscurve voldoende is om te kunnen simuleren wat de invloed is van het veranderen van wrijvingssnelheid en –druk op het al dan niet plaatsvinden van een Helmholtz beweging. Voor de toepassing van ons computermodel zal de wrijvingscurve zoals deze in figuur 3 is voorgesteld dus wel voldoen. ComputermodelVariabelenEr zijn 3 waarden in te stellen in het model. Dit zijn de snelheid van de boog (vb), de druk die met de boog op de snaar uitgeoefend wordt (Fb) en als laatste een factor die de afstand tussen de boog en de kam ten opzichte van de lengte van de snaar aangeeft (beta). Werking van het programma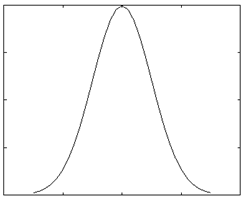 In het programma wordt het simulatiegebied opgedeeld in n intervallen, met een grootte dt. Het programma doorloopt voor elke tijdstap dt een loop waarin met behulp van bekende waarden voor de positie, kracht en snelheid uit het verleden de nieuwe waarden voor deze grootheden bepaald kunnen worden. Van belang hierbij is dat de snelheid waarmee een op de snaar uitgeoefende kracht zich door de snaar beweegt bekend is. Zo kan er op tijdstip i altijd terug gekeken worden in de geschiedenis welke krachten uit het verleden op tijdstip i teruggekaatst zijn en dus weer van invloed zijn op de beweging van het gesimuleerde punt. Om de exacte werking van het model te illustreren, zal hieronder de loop van één tijdstap doorlopen worden. Het model zelf is ook bijgevoegd. (Let op! Het model is nog niet werkend of voorzien van commentaar). De snaar wordt bekeken op positie x op tijdstip i. Trillingen die op positie x veroorzaakt worden, gaan via de snaar naar de uiteinden van de snaar, van waar ze teruggekaatst worden naar positie x. Op tijdstip i wordt eerst uitgerekend op welk tijdstip de trillingen die op dat moment terugkomen op positie x uitgezonden werden. Dit is dus een tijdstip in het verleden. Aangezien de snelheid waarmee de golf zich voortplant geen meervoud is van dt, zal er meestal geïnterpoleerd moeten worden tussen twee tijdstippen. Omdat trillingen die nog niet helemaal teruggekeerd zijn, of juist alweer voorbij positie x zijn ook invloed hebben op de beweging op positie x, wordt er ook rekening gehouden met deze trillingen. Met behulp van een symmetrische Gauss-kromme (zie figuur 6) wordt de invloed van deze trillingen uitgerekend en opgeteld bij de trilling die precies op tijdstip i is teruggekeerd. Al deze trillingen zijn in feite krachten die van invloed zijn op de snaarsnelheid v op tijdstip i. Met behulp van het frictiemodel kunnen de resulterende kracht omgezet worden in een nieuwe snaarsnelheid. Dit is dus de snaarsnelheid vi op tijdstip i.
Als de complete trilling van de snaar bekend is (positie als functie van de tijd), kan door een fouriertransformatie toe te passen een powerspectrum gemaakt worden waarin de amplitude verhoudingen te zien zijn in het frequentiedomein. ProblemenHet grootste probleem tot nu toe is dat de frequentie van de snaartrilling steeds afhankelijk blijkt te zijn van de strijksnelheid en –druk. In de werkelijkheid is dit niet het geval en wordt de frequentie slechts beïnvloed door de lengte van de snaar. Met het variëren van de strijksnelheid en –druk wordt in werkelijkheid alleen de amplitude en dus de luidheid van de trilling beïnvloed. Dit probleem wordt waarschijnlijk veroorzaakt door een ander probleem. Namelijk het modelleren van de snaarstijfheid, dus welke kracht de snaarstijfheid genereert als functie van de tijd. Hiervoor moet nog een oplossing gevonden worden. Analyses met het modelMet behulp van het werkende model kan een Helmholtz trilling gegenereerd worden. Deze trilling kan daarna geanalyseerd worden met behulp van matlab. Het model herkent een trilling en kan deze klassificeren in een aantal groepen. Uit alle gemodeleerde trillingen is een zuivere Helmholttrilling gepakt, deze ziet er uit als in de linker plot hier onder. Daarna is er een m-file gemaakt die een Fourier transformatie uitvoerd op deze trilling en een frequentiedomein plot. Dit frequentiedomein is weergegeven in de rechter plot hieronder. 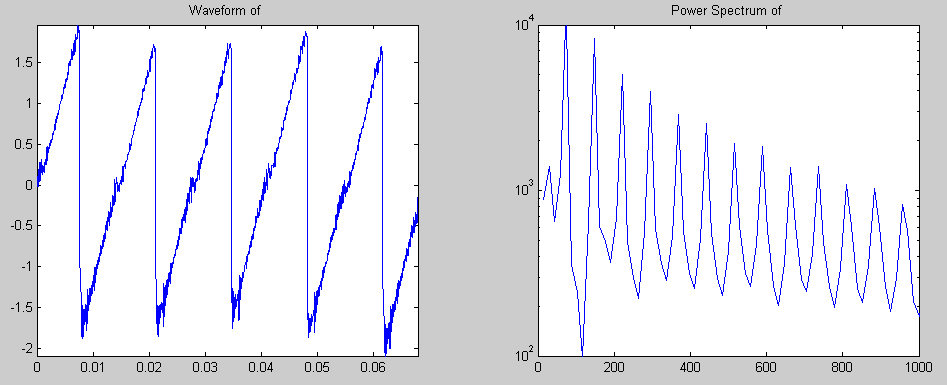
Region of Helmholtz motion in parameter spaceThe model has been run for a 20x20 grid of bowing speeds and bow forces. This has yielded the plot of Figure 1. 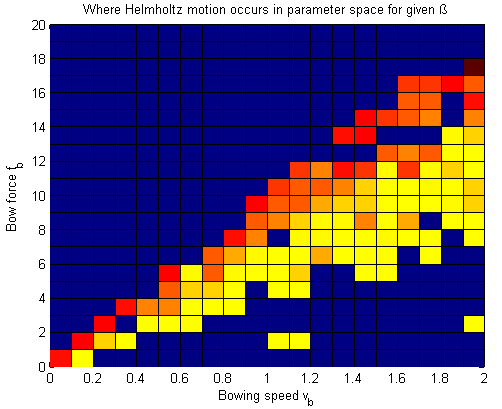 It’s interesting that there are exceptions to the main trend in the figure, that is, the “holes” in the Helmholtz region and the occurrences of Helmholtz outside the main region. This is strange because in a mathematical model, unlike in “reality”, there’s no noise or chaos. Probably, the reason why the results may be unpredictable is that these are not steady-state results, so there may still be startup phenomena. A way we may solve it in the future is to use “perfect transients”, in which Helmholtz motion is obtained within one period by following a certain acceleration path for the bow speed. Restrain should also be kept regarding the accuracy of the algorithm that “recognizes” if there is a Helmholtz vibration or not. Despite the inaccuracies, there is already valuable info in this plot. It becomes very clear “where” in the parameter space you want to be, as the lower part of the Helmholtz region has the smallest note flattening. When modulating the note intensity, the ideal path that should be taken would be somewhat like the green line drawn in Figure 2. 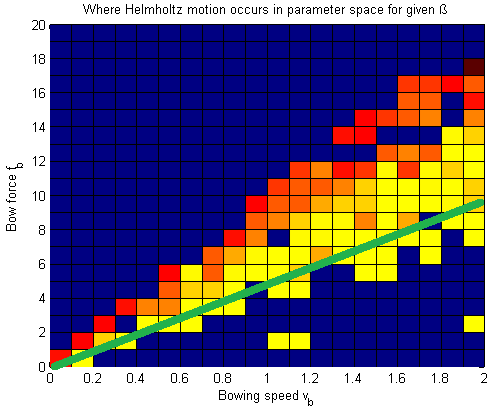 |