Group2 19-1 Week4
Hallo Tijn, ik weet niet of je al begonnen bent met lezen, maar we zijn nog even bezig met het updaten van de Wiki. Ik zal regelmatig opslaan tijdens het updaten, zodat je simpelweg de pagina af en toe kan refreshen om de wijzigingen te laden.
Notulen tutor meeting
- Make requirements measurable
- Subdivide requirements
- Requirements, preferences and constraints
- Wie gaat het maken? Andere groep stakeholders/gebruikers
- Expand explanation for translation to exoplanets
- Nut van de achievements van de missie
- Wiki hoeft pas klaar te zijn na de presentatie, dus week 8
- Keuze voor experimenten moet echt gemaakt worden, deze week eigenlijk nog'
- Of we in een beschaving mogen/kunnen komen is een ethisch vraagstuk waar we wat meer op in moeten gaan
- Conclusies gaan trekken over constraints en keuzes
- Hoe zeker is er een oceaan op Europa, onze afweging moet duidelijk zijn voordat we ingaan op een cryobot sturen
- Planning weer updaten (week 5 report -> andere tijdsbesteding)
- Modelleren/berekenen
- Anthropologische deontologie
- Zekerheid oceaan
To do voor donderdag:
- Requirements updaten (zie notes Tijn)(Wouter)
- Modelletje temperatuur (Wouter)
- Hoe omgaan met beschavingen (Wouter)
- Experimenten updaten (Marco)
- Planning updaten (Marco)
- Aanwezigheid oceaan bevestigen (Kasper)
- Fiber optic cable at 100 K (Marco)
- Communication options via fiber or alternative options (Kasper)
Week 4 Logbook
Updated planning
Updated planning
Week 1:
- General research: we explore the topic that we chose and come up with inspiration for a research objective. (Kasper, Marco, Wouter)
- Deliverables: potential research objectives
- Define users: according to the topic we have chosen, define the users that play a role in achieving this objective. (Kasper, Marco, Wouter)
- Deliverables: a list of users and their goals with regards to this research
Week 2:
- Determine objective: from the research in week 1, determine a research objective that will be the center of your research. (Kasper, Marco, Wouter)
- Deliverables: definitive research objective
- Determine requirements for the research objective and its users: in order to achieve an answer to the research objective, what requirements should there be, from the standpoint of the users (Kasper, Marco, Wouter)
- Deliverables: a list of users and the requirements that they have for this research objective
- Planning: make a planning for the remainder of the course (Kasper)
- Deliverables: a planning of things that are still to be done for this research
- Consult NASA/ESA: contact NASA and the ESA for their take on how to go about designing a research mission (Marco)
- Deliverables: advice from NASA/ESA to improve our research
Week 3:
- More extensive user descriptions: further work out what users would be involved with our research objective (Wouter)
- Deliverables: a more elaborate description of the users and their requirements with regard to the research objective
- More extensive planning: work out the planning of the project in more detail. What should be done when and by who, with which deliverables (Marco)
- Deliverables: a more detailed planning for the remainder of the course
- Examine possible experiments on Europa: research for different experiments that can be done on Europe to examine our objective.
- Deliverables: Some experiments that can possibly be executed
- Work out section 3.2: research whether it is feasible and worthwhile to perform research below the surface of Europa (Kasper)
- Deliverables: a section on whether it is feasible to go below the icy surface of Europa, and, if so, what kind of research to perform there and how to do it
Week 4:
- Work out chapter 2.1: work out how to establish a stable communication between Earth and the lander on Europa (Marco)
- Deliverables: a description of the necessary technologies to maintain contact with the lander on Europa
- Work out the list of necessary instruments: set up a description of the instruments that the lander should have, along with motivation what they are for and why they are necessary (Marco)
- Deliverables: a list of instruments, along with their descriptions, functions, and why they pertain to the requirements of the users
- Work out the rest of chapter 2: describe the possible problems that Europan physics pose to the mission, along with possible solutions or workarounds (Wouter)
- Deliverables: a list of potential Europan physics challenges, along with solutions/alternatives for them
- Work out the rest of chapter 3: how do we get around on the surface of Europa and what conclusions can be drawn from the data of the lander’s instruments? (Kasper)
- Deliverables: a description of the lander’s mode of locomotion and the conclusions that can be drawn from the data it collects
Week 5
- As week 4: continue to work out the chapters that everyone was assigned to (Kasper, Marco, Wouter)
- Deliverables: finished chapters 2, 3 and 4
- Research cable testing: investigate the costs of testing a fiber optic cable at temperatures comparable to those on Europa
- Deliverables: an indication of costs of performing temperature experiments on fiber optic cable
Week 6
- Write conclusion and discussion: write a conclusion that describes the findings of our research, and a discussion that describes what could have been done better/differently (Kasper, Marco)
- Deliverables: a conclusion and a discussion in the report
- Technical sketch of the lander: make a technical sketch of the lander that showcases in detail what it is expected to look like (Wouter)
- Deliverables: technical sketch
- Test cable: Investigate whether a fiber optic cable would work at cryogenic temperatures (Kasper, Marco, Wouter)
- Deliverables: Report on the performance of a fiber optic cable at ~100 K.
Week 7
- Create presentation: create a presentation, to be given in week 8 (Kasper, Marco, Wouter)
- Deliverables: presentation
Week 8
- Presentation: present our report to the tutors of the course (Kasper, Marco, Wouter)
- Deliverables: a presentation for a fantastic grade
- Finalize wiki: make sure the wiki is up to date with all our findings and the report that we have written (Kasper, Marco, Wouter)
- Deliverables: an up-to-date wiki
Updated requirements
Presence of an ocean
The first theories that Europa has a sub-surface ocean came after the fly-by mission of Voyager 1. This spacecraft was, in march 1979, the first that made images in significant detail of Europa’s surface, with a resolution of about 2 kilometers per pixel. These images revealed a surprisingly smooth surface, brighter than that of earth’s moon, crisscrossed with numerous bands and ridges. Researchers noted that some of the dark bands had opposite sides that matched extremely well, comparable to pieces of a jigsaw puzzle. These cracks had separated, and dark, icy material appeared to have flowed into the opened gaps, suggesting that the surface had been active at some time in the past. The images also showed only a handful of big craters, which are expected to build up over billions of years as the planetary surface is bombarded by meteorite, until the surface is covered in craters. Thus, a lack of much craters suggested that Europa’s surface was relatively young and implied that something erased the craters, such as icy, volcanic flows. Next to that, scientist found patterns of some of the longest linear features in the images that did not match the predicted patterns of the features, created by tides as Europa orbits Jupiter. They determined that the found patterns would fit very well if Europa’s surface could move independently and was not locked to the rest of the interior.
These interesting findings led to the next mission to Europa, Galileo. This spacecraft was launched in 1989 and entered orbit around Jupiter in 1995. Galileo eventually made 12 close flybys of the icy moon, including images of Europa at a range of scales, revealing new details about the surface and providing context for how those details were related to the moon as a whole.
One important measurement made by the Galileo mission showed how Jupiter’s magnetic field was disrupted in the space around Europa, implying that a special type of magnetic field is being created within Europa by a deep layer of some electrically conductive fluid beneath the surface. Scientists belief, based on Europa’s icy composition, that the most likely material to create this magnetic signature is a global ocean of salty water. Above described are four strong indications of a sub-surface ocean on Europa, which is why the common belief under scientists is that the ocean really exists. (https://europa.nasa.gov/about-europa/ocean/)
Physical considerations about the presence of water on Europa

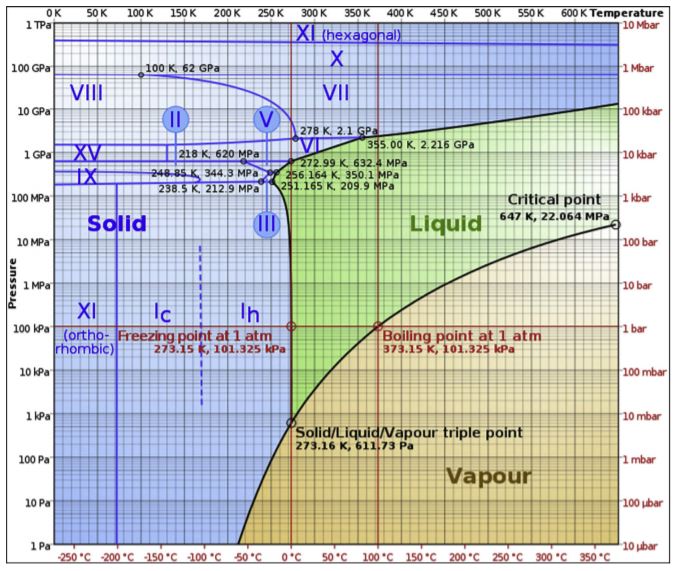
One of the reasons to assume that water won’t be present in its liquid form on Europa is in the phase diagram of water, shown to the right. As can be seen in the image, the lowest pressure at which water can still exist in liquid form is its triple point at 611.73 Pa (0.0061 atm), at the common freezing temperature of 273.15 K (0 degrees C). Below that pressure, water has no liquid form. Since the pressure at Europa’s surface is about 10^-10 atm, this means that liquid water can not stably exist on Europa. It may surface for a brief moment, but will almost instantaneously either freeze or boil, leaving no water remaining.
It should be noted that indeed this diagram does not extend below 10^-5 atm, and that based on this image it is thus technically not possible to say that water does not have a liquid form at such ultra-low pressures. However, it is first of all unlikely that such an out-of-place phase change exists based on this and other phase diagrams. Secondly, this ‘liquid’ may not be liquid as we know it and still be unable to support life. Much like solid water has different crystalline structures at different temperatures and pressures, so can this liquid water have very different properties based on the environment it is in. Hence based purely on physical grounds it is unlikely that liquid water in a familiar form exists on the surface of Europa.
Modelling temperature of the digger


The following data was used for making the model, all derived from Engineeringtoolbox
Thermal conductivities (W/m K): Stainless steel: 14.35 Ice: 2.18 Air: 0.06
Specific heat: (J/kg K) Air: 700 Steel: 500
Densities: (kg m^-3) Steel: 7850
(Matlab’s PDE solver didn’t seem to be able to work with convection, and was not able to make 3D models. WebNutils proved unable to work with solids and multiple domains, and modelling steel as a super-dense fluid with an ultra-high viscosity doesn’t increase trust in the model. Instead, I used Quickfield Student Edition to make the following pictures. This did have the disbenefit of modelling over only 255 data points.)
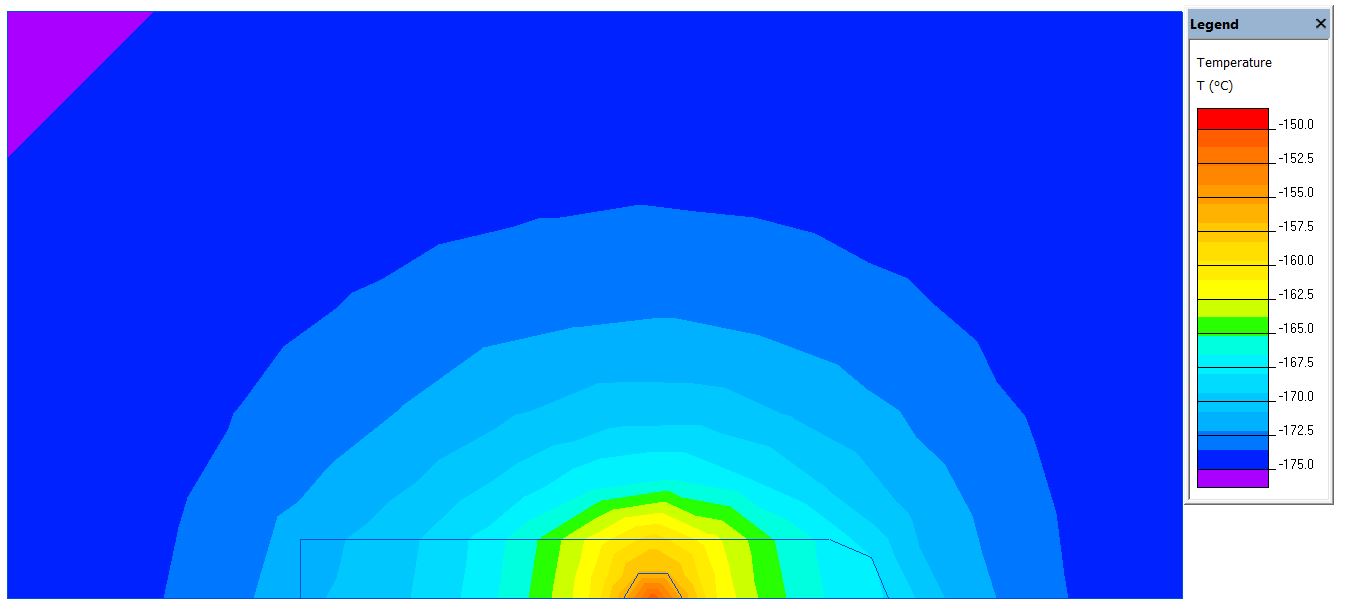
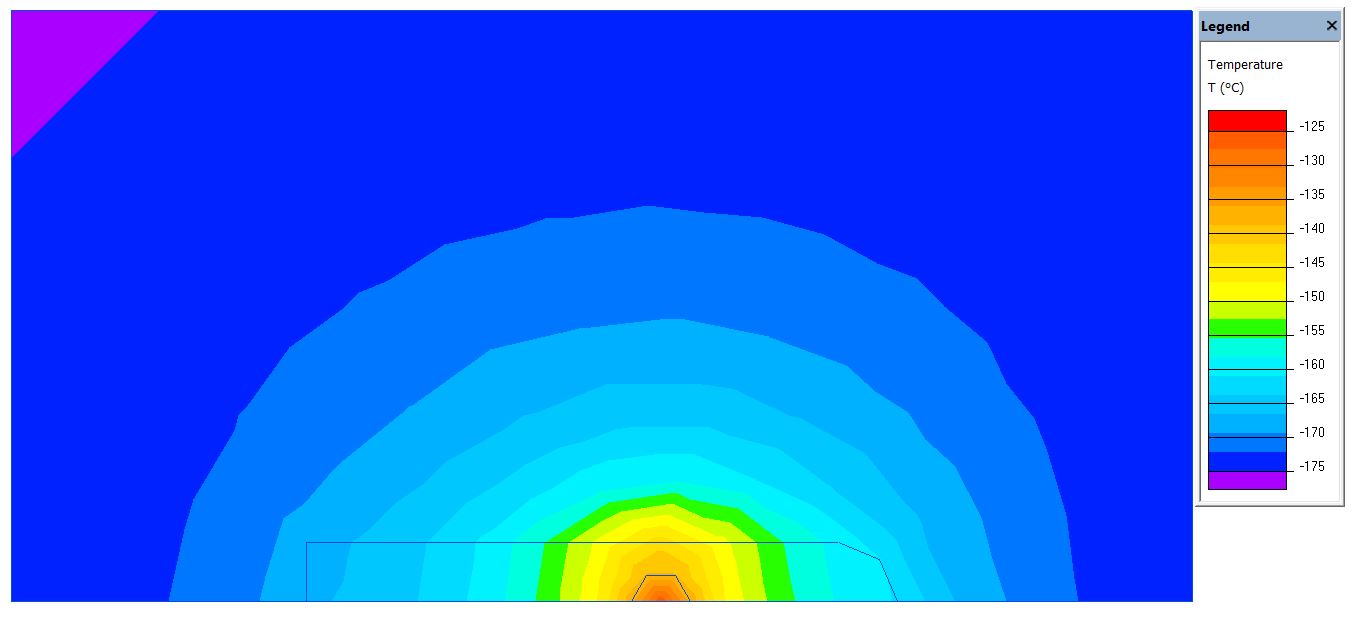
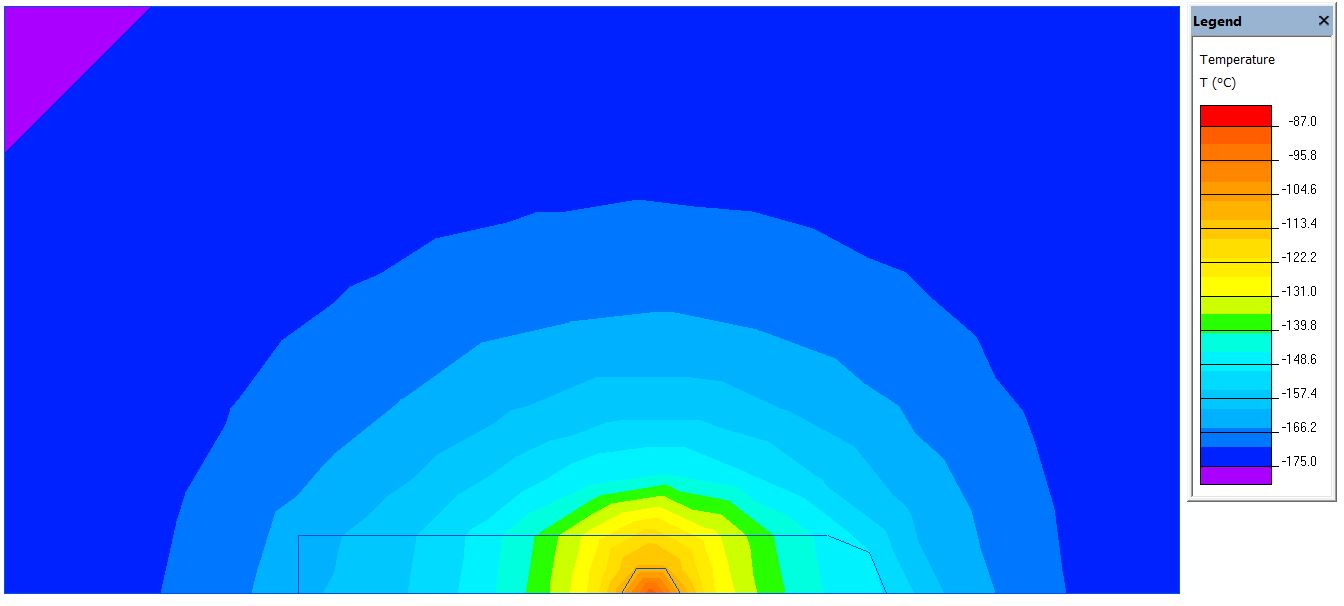
In the following pictures, the digger will be modeled as being somewhat pill-shaped: a 9 m long cylinder with a 1 m radius, capped off with a hemisphere of the same radius. Both are modelled as being solid steel. The models are axially symmetric, with the bottom border of the picture always forming the axis of symmetry. The other outside borders are always set to be -175 oC (~100 K) to simulate the environment. The models are steady-state, as it is assumed that the digger will be digging through the ice long enough for the temperature to equilibrate. The bit of air around the digger was incorporated in the model to account for the fact that the slow progression of the digger may heat the ice or air around it a little, thereby insulating the digger somewhat. The power source was always adjusted such that it homogeneously produced the desired power.
The upper left image is modelled in air with a 1 kW power source. In this case, it is visible that the digger will have trouble maintaining a sufficient temperature gradient around the power source, as the steel around it effectively takes away the thermal energy but is unable to give it to the environment. This implies that an RTG, as well as other devices that require temperature gradients may not work efficiently in these conditions.

The two pictures to the right show the digger in ice with a power source of 100 (above) and 200 kW (below). In this case the gradient forms, as the digger can lose its heat, but is not sufficiently large. Even at 200 kW the total temperature difference is only 50 K, and the difference between the in- and outside of the power source is only 15 K.
The solution may be found in the last model, where the digger has been scaled down by a factor of 3.28 (m have been set to ft), yet the power per unit volume was still scaled to produce similar powers. The result (seen on the bottom left) is a much more localised power source capable of producing much stronger temperature gradients. In this case, the total power was 10 kW (10 times less than the other models), yet the total difference is twice as high. Taking into account that this difference occurs over a 3.28 times shorter difference, means that the gradient can already become up to 6.5 times larger.
Communication options via fiber
Fiber-optic communication
Is a method of transmitting information from one place to another by sending pulses of light through an optical fiber.
Fiber-optic use in missions:
In the ARTEMIS mission in 2015 a fiber optic link was used. The function of this fiber was to monitor ARTEMIS under water and allow the scientists to display the real time outputs of the sensors on a screen. There were high noise levels on some sensors. The fiber was 15 km long, but ARTEMIS was at its maximum 10 km from the base. Due to the ocean currents the fiber couldn’t be re-used. Navigation and Communications Under and Through the Ice in Antarctica The ARTEMIS under‐ice AUV docking system
Glass fiber:
- Tensile strength in touch up to 300 degrees of Celsius. Can’t find any information about the tensile strength in freezing temperatures
- Very high tensile strength (3445 MPa for E-glass)
- 100% insensitive for interferential signals, for example from electromagnetic fields.
- Density E-glass: 2.58 g/cm^3. With a typical diameter between 3.8 and 20 µm.
With the smallest diameter, an glass fiber of 10 km would weight only 0,29 gram. With a diameter of 20 µm, the fiber would weight 8,1 gram Glass fibre
“The cryobot uses the laser energy to heat water with which to melt the ice in front of it, while the water re-freezes behind it around the fiber, allowing communications and power flow to be maintained.” (Link used before) Tunneling Cryobot Robot May Explore Icy Moons