PRE2018 3 Group16
Group members
| Edwin Steenkamer | 1006712 |
| Sjir Schielen | 1024154 |
| Thijs Conner | 1011148 |
| Tobin van den Hurk | 1009573 |
| Tom Verberk | 1016472 |
Introduction
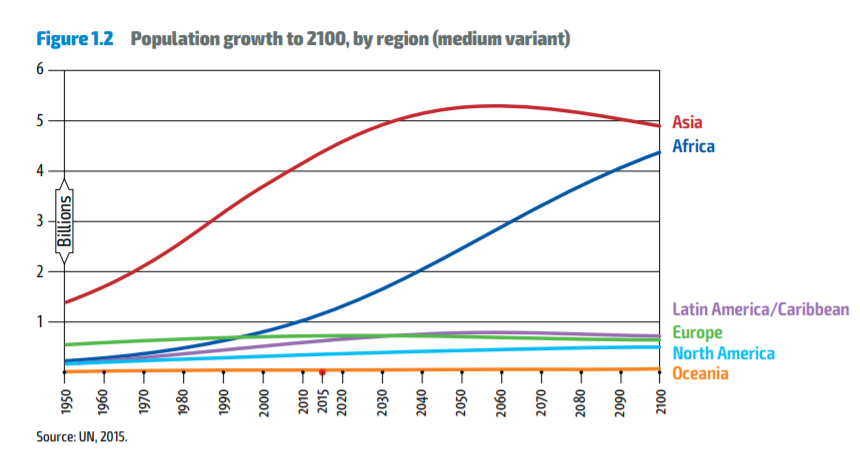
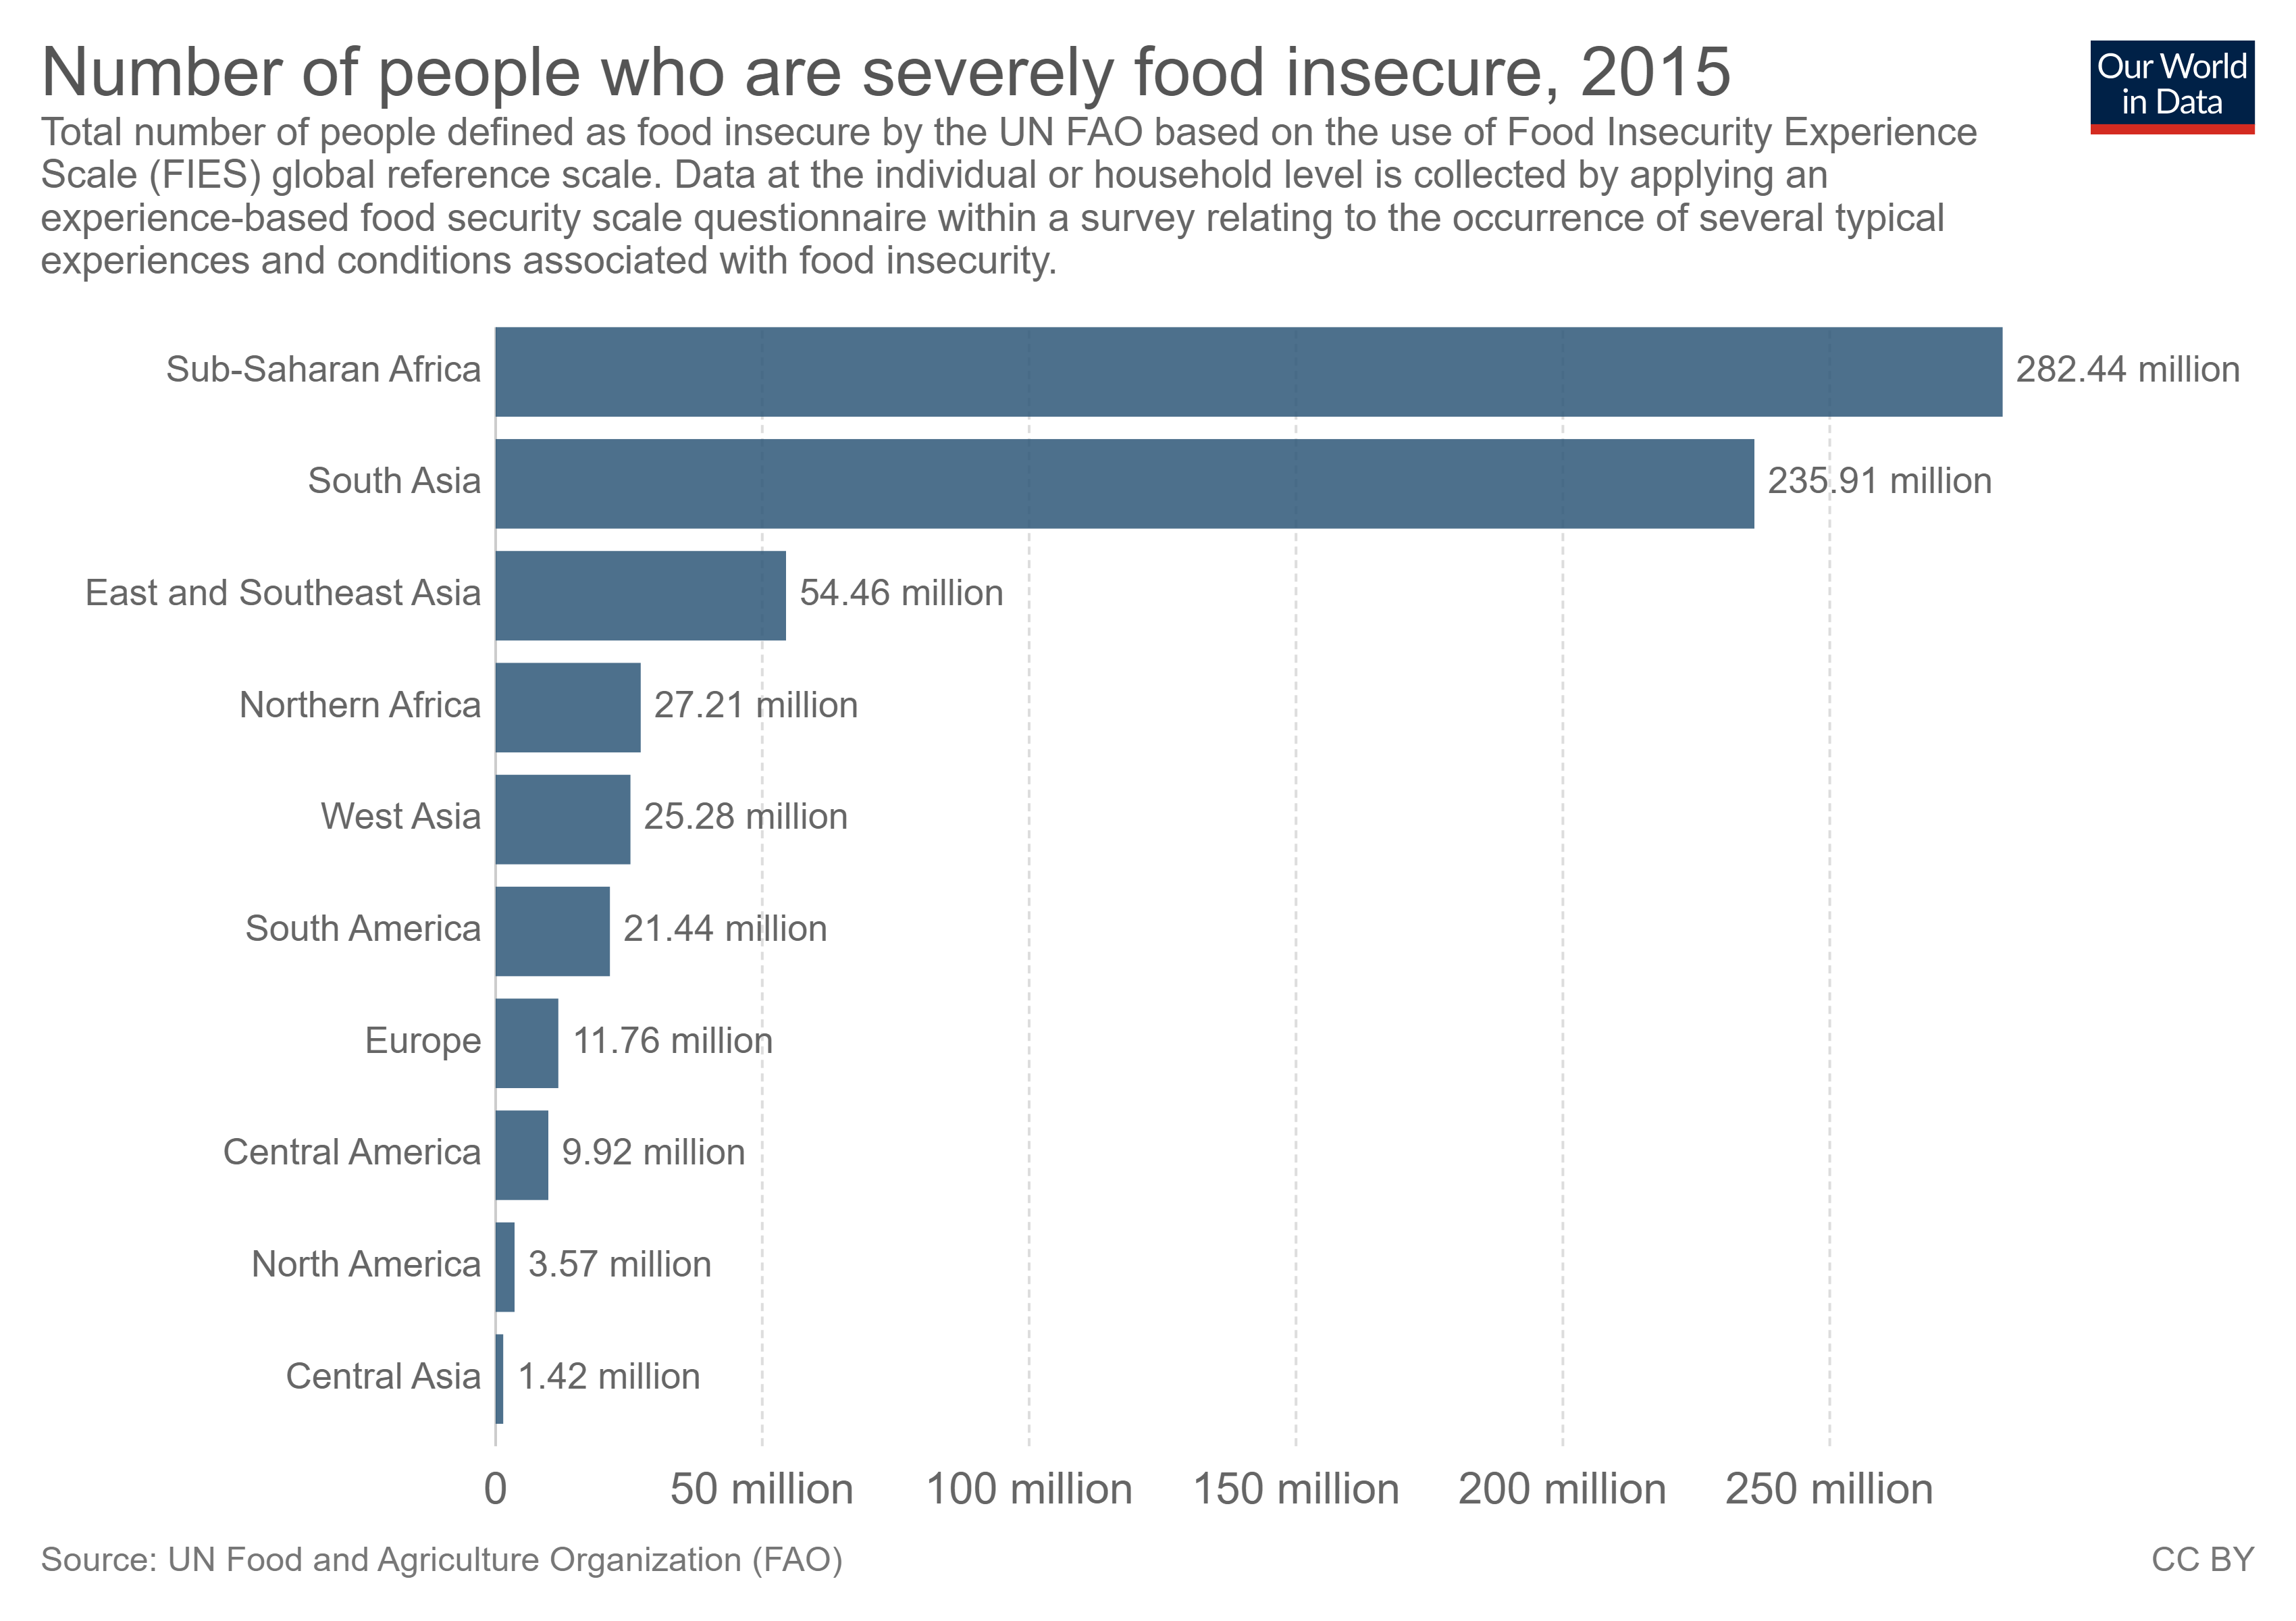
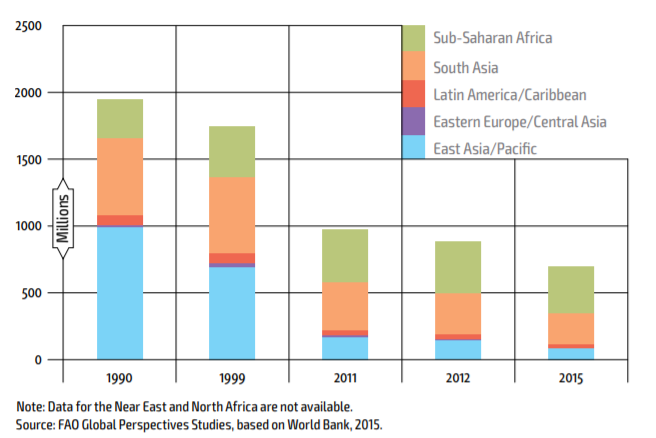
The world is facing a population growth that is especially substantial in Africa. Figure 1 shows the projected population growth up to the year 2100. The highest population growth is expected in Africa. Africa is a continent whose name is often associated with poverty. With respect to food shortages this is definitely true. As can be seen in figure 2, the highest number of people that are food insecure live in Sub-Saharan Africa. These numbers are from the year 2015. In combination with the expected population growth, an increased need for food is also expected. The current food production does not suffice, meaning that an improvement is vital to support the expected increase in population. The effects of global warming pressure the urgency of the problem and are expected to worsen the situation.
Problem specification
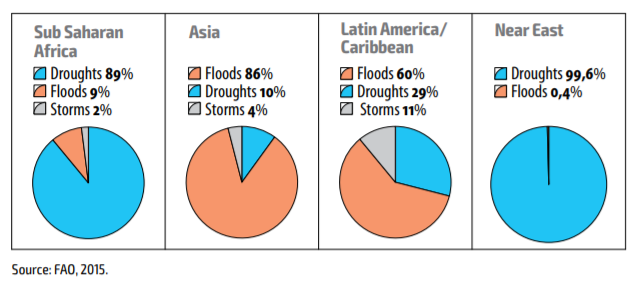
Entirely automating farming seemed like a possiblity for technology to increase agriculture, while mitigating a possible lack of knowledge a farmer could have. However, this approach is too broad and not affordable. Therefore, a more specific view is required. Water is a key factor for the production of any farm, especially the ones producing crops. The lack of available water to farms is a problem that any drought-prone area faces. A lot of areas in Sub-Saharan Africa see drought as the major factor contributing to failed harvests. Figure 3 shows agricultural losses in percentages due to natural factors. It is clear that droughts form the vast majority.
Another major problem in Sub-Saharan Africa is poverty. As can be seen in figure 4, the amount of people who live below the povertly line has stayed almost consistent over time in this region, whereas other regions have been more succesful in fighting poverty. A need for economic growth is required to support the increasing population. In order to stimulate economic growth, hunger needs to be eradicated.
Sub-Saharan Africa is in terms of size still as a big as some other continents. Since a system has to be designed, precise environmental factors have to be defined and a target user has to be identified. Therefore, the scope has to be narrowed down to the situation of a specific country in Sub-Saharan Africa. The focus primarily lies on the country of Botswana. Botswana is a country in which a large section of farmers is small-scale and irrigation is a not well known technology. In Botswana the dry season and rainy season are lengthy and significant. In order to help solve poverty and increase the food production, small-scale independent farmers are a target user for which improvements can be seen with respect to both poverty and food production.
Approach
For this project, an initial literature study is required. By exploring the subject in a top-down fashion, the main focus of the project can be adjusted. In other words, gathering information on the broad topic of farming in sub-optimal conditions in general, allows for the project to delve deeper into the aspects of farming deemed most important. Using this method instead of starting with a focus on a specific problem regarding farming, eliminates the threat of discovering this specific problem is not as interesting or important as expected. Another benefit of starting with an extensive research on the state-of-the-art, is that the amount of assumptions is expected to be limited. This allows for more grounded arguments and reasoning as to why certain aspects are deemed more important.
This led to the opinion that the most effective way of improving agricultural gains is by conquering extended periods of drought. Transporting water from more humid areas is a possibility, but unfavorable due to transportation costs and limited availlability of water even in those more humid parts. Therefore, a means to improve the usage of the already availlable water during the rain seasons is more desirable.
The process of increasing water efficiency has 3 distinctive steps, which all need to be looked at individually first: collection, storage and distribution. Then, these parts need to be combined into one construction, centered around the user.
Deliverables
This project will ultimately consist of 3 deliverables, a literature study, a system design and a model. The project’s literature study will focus on the following topics: Sub-Saharan african agriculture, agriculture in Botswana, farmers in Botswana, existing alternative solutions to our problem and the individual components of our system.
Furthermore, a system will be designed to solve the problem given in our approach. This system will consist of three parts: a water catchment part, a water storage part and an irrigation part. Finally, a model will be made to verify the effectiveness of our system.
State-of-the-art
Agriculture is one of the biggest sectors we have in this world. Without food, we would not be able to live on this planet. Since this project focuses on small-scale farmers, the research is divided into different subjects deemed most important in getting a better picture of how small-scale farmers could be assisted. The first section will briefly touch on some of the core aspects of Sub-Saharan agriculture, after which a more in-depth state of the art will be presented on drought prevention techniques such as water collection, irrigation, and water storage.
Sub-Saharan African agriculture
The best ways to provide energy to systems implemented on a farm.
Energy production is vital to the development of Africa. Currently only an estimated 31% of the whole population in Sub-Saharan Africa has access to electricity, whereas about 80% of the energy consumption is still accounted for by traditional biomass energy. An increase in energy consumption is needed for Sub-Saharan Africa to develop. Climate changes poses a threat to the already vulnerable agricultural sector of Sub-Saharan Africa. Energy sources other than biomass with low carbon emissions are needed to improve the agriculture in these fragile environments. The lack of funding is the major problem and as the globe warms, time is of the essence [1]. Sub-Saharan Africa offers conditions that may be beneficial for energy production. The area receives solar radiation with an intensity that is among the highest on the planet. The now commercially available technology concentrating solar power (CSP) is a candidate technology which, with the right investments, can generate a lot of power in North Africa [2]. There are possibilities for large scale energy production in this area, which may benefit other parts of the world as well, but the main problem remains funding.
How does livestock and vegetation affect (and benefit) each other.
There are theoretical benefits to the interaction between crops and livestock. Livestock can be used for physical labour on the land and manure can fertilize the soil. In Sub-Saharan Africa, however, this concept is not well integrated. The concept is not applied through the availability of information, but through environmental differences[3]. Another theory suggests that households in Sub-Saharan Africa use livestock as a buffer stock to insulate their consumption from income fluctuations. As the problems of engaging in rainfed agriculture are inevitable in a drought-prone area, it is often assumed that livestock form a buffer for the dry season. Results indicate that livestock transactions play less of a consumption smoothing role than often assumed. One can conclude that there are better ways to manage agriculture [4]. Another problem is that most livestock was introduced to Africa through trade with Europe and the Middle-East, hence the animals are less adapted to the extreme conditions [5]. The use of different animals as livestock may benefit the harsh areas. It is, however, important to analyze how effective species are with water. A way to do this is by the concept of livestock water productivity (LWP)[6]. LWP is defined as the ratio between the sum of all net livestock products and services and the sum of all depleted/ degraded water. It assigns a numerical value with the unit dollar per cubic meter of water. By using this concept a numerical problem can be formulated that allows optimization. This approach does, however, rely on available information and it is estimate based.
Methods of Soil sampling and analysis.
Soil consists of many different kind of elements which can have an effect on the crop growth. To measure these elements soil sampling and analysis has to be done. Different analysis methods are needed for different elements such as chemical, biological, organic matter, physical and water analyses [7][8][9]. The effectiveness of these tests, for a low budget and uneducated farmer, are dependant on the ease of use and low-cost equipment. Investigating new and improved ideas of how to measure specific elements may help in choosing the right tests [10][11][12]. In case of putting these sensors on a robot an assessment also has to be made about the effectiveness of different kind of agricultural robots [13].
Soil analysis and degradation.
Not just the drought, but rather soil degradation combined with the rapid increase in population in developing areas such as Sub-Saharan Africa, will pose a major threat for food production in the near future[14]. To combat this degradation, adequate measures should be applied. Measuring the soil composition at different locations in a single field, will give more insight in the so-called micro-variabilities[15]. These measurements can be used to more efficiently water, manure, and weed crops, which has proven to be more effective than simply introducing new techniques or machinery[16].
Obstacles for small scale farmers in poor countries.
The demand for food products for export markets is increasing severely in developing countries . But most of the small-scale farmers in those countries have difficulties profiting from this increasing demand. This article[17] gives a few problems small-scale farmers are having including pesticide use and poor storage facilities. To improve these farmers need technology, but to choose which technology is needed and then actually integrate this technology is easier said than done[18]. The conclusion is that a combination of lack of knowledge, resources, and technology is the reason small-scale farmers are having trouble to increase their production and make their farm more efficient[19].
Technology that is used in agriculture in industrialized countries.
Nowadays technology is having a massive impact on agriculture, especially in industrialized countries. A great example of this is precision farming. This type of farming uses wireless network systems (WNSs) to make sure every plant or animal gets a very precise treatment[20]. Other examples of smart farming is given in these articles[21][22]. The first article describes a system that can measure physical parameters of the soil that play a vital role in farming activities and the second article describes a system that can reduce the amount of water used by implementing a soil moisture sensor to automate the water sprinkler.
A more directed focus
The problems that Sub-Saharan Africa faces in the sector of agriculture are too broad to be solved in one solution. In an attempt to solve a smaller aspect of the problem, the following specifications are made. The focus lies on small-scale farmers in Botswana. Botswana is a country that lies in Sub-Saharan Africa. The system that will be designed is aimed to help water management for small-scal farmers in Botswana. To sketch the specific situation the state of the art below is focussed on Botswana.
Drought
Drought is considered to be one of the most complex natural hazards, as it affects more people than any other natural hazard, yet for all the damage it causes it receives relatively little attention. Of all natural hazards, it is the most difficult to predict and it can last longer than any other. Currently, there are many factors that cause a lack in preparedness by people living in drought-prone areas. One of these factors is the lack of a universally accepted definition of the word drought. Various scientific disciplines, such as meteorology, agriculture, hydrology and socio-economy, have different definitions. Here, the focus lies on the agricultural definition and the meteorological definition. The agricultural definition refers to a period of time in which the amount of water in the soil no longer meets the requirements of the crop. Meteorological drought is defined as the amount of precipitation being a certain percentage lower than usual for a prolonged period of time[19].
The Botswanan situation
Precipitation

Botswana is a typical semi-arid country: average annual evapotranspiration (sum of evaporation and transpiration by vegetation) exceeds the annual rainfall by a factor 3-4 in the north-east to 8-10 in the south-west. Seasonal rainfall and its distribution are very irregular and dry periods of more than one month are common. The country’s agricultural sector is built around the rainy season. Figure 1 shows the average rainfall from recorded data between 1925 and 1984, the average Penman potential evapotranspiration (PET) and theoretical day length for Gaborone[42].
What stands out is that rainfall is less than PET all year round. This means that the shortage of water is a problem not only in the dry season but also in the wet season. Keep in mind that the figure shows average data. The fluctuations in precipitation are unpredictable and it is not uncommon for a dry month to appear in the rainy season.
To manage agriculture, the rainy season is divided in three periods which roughly coincide the farming cycle. The early rainy season spans from October to December and is meant for soil preparation, planting and the first stages of crop development. The mid rainy season lasts from January to February. This period contains fast vegetative growth and has the highest water requirements. The late rainy season concludes the rainy season in the months March and April. In the late rainy season, the final stages of crop development occur and the water requirement declines[42] [43].
In practice, the farmers face challenges. First of all, the PET is higher than the amount of rainfall all year round. This means that even in the rainy season there is not enough water to support all biomass. Second, the fluctuations in arbitrary dry periods in the rainy season cause unpredictable risks in the cycle. The farmer needs enough time for his crops to grow while there is water available. Yet, if a dry month occurs it can cause the harvest to fail without enough time left in the rainy season for the farmer to replant. Even if the crops survive, the lack of water will cause less biomass to be produced.
A system that collects, stores and smartly irrigates water can be a solution. Since annual evapotranspiration exceeds annual rainfall, a smart way of collecting, storing and using the water is necessary. By collecting more water, a part of the water that would otherwise evaporate can be used. By improved storage, the farmer has a water supply that can act as a buffer in potential arbitrary dry months. If the water is used in a more effective way, which is aimed to be optimized by the use of technology, less water is lost in watering crops.
Alternative water sources
Less than 0.01% of agricultural land is artificially irrigated[66]. That means that 99,99% of the land relies solely on precipitation for watering the crops. Table 1 shows that Botswana has a low need for water for irrigation purposes (implying a higher need for precipitation) compared to other Southern African countries, stressing again why Botswana could be a prime benefactor of rainwater irrigation.

The reason behind the rarity of artificial irrigation, can be explained by the lack of availlable surface water[67]. The most obvious culprit is of course the dry climate, causing most of the surface water to evaporate. Another problem is Botswana's low and erratic run-off. This means that the excess precipitation will unpredictably make its way over the surface, preventing rivers or lakes from forming. This has a direct result on the availlability of dam sites. The poor run-off and therefore lack of lakes, rule out dams as a viable option to hold the freshwater. Important sources of surface water, are the Okavango river basin, located in North-West Botswana, and the Limpopo river basin on the far east. A drawback of these basins, is that all of their rivers are ephemeral, meaning they only last for a short time after rainfall and then disappear again. This means that the water in these basins has to be accessed directly, posing a problem for Botswanan population not living in close proximity to the basins. Another complication, is that all basins and their rivers have to be shared between neighbourig countries. The rivers run through multiple countries, which all depend heavily on the water from these rivers[67].
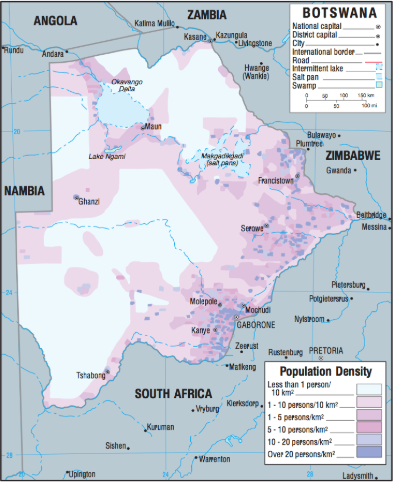
On the population map shown in figure 2 on the right, a large portion the Okavango river basin and the rivers from the Limpodo river basin can be clearly identified by the high population density. Note that the Makgadikgadi Pans is not a lake, but a wetland. This means that periodically, most often during the rain season, this area is swamp-like untill it dries up again[67].
In the present, Botswana has resorted to frequenter use of groundwater, surface water's more reliable counterpart. The foremost reason against the use of groundwater, is the expensive extraction costs. On the long term, however, a more problematic issue arises. At the current extraction rate, groundwater exceeds its replenish rate, which is often referred to as 'groundwater mining'[67]. Another problem with ground water in Botswana, is that Botswanan ground water is high in salinity. These high levels of salt make the water undesirable for crop growth. Maïze in particular is vulnerable to salt[70].
Cereal harvest
In general, cereal yield includes wheat, rice, maize, barley, oats, rye, millet, sorghum, buckwheat, and mixed grains. Different sources report average yields between 200[60] and 450[61] kilograms per hectare in 2014. This wide range of results can be accredited to the vast difference in efficiency between traditional farms and commercial farms, local differences and a margin of error. Yield can differ greatly from year to year, causing even more complexity when trying to compute an all-time average. On traditional farms, 2014 resulted in 260% more yield than 2013, causing both 2014 and 2013 to be on either end of the production spectrum for traditional farming, with 2014 on the high end and 2013 on the low end[62]. All these factors considered, an average yield of 200kg/ha per year will be adopted throughout this paper.

Using the fact that the average farmer in Botswana owns 0.1806 hectares of arable land[63], an estimate to average production can me made. As cereal and groundnuts account for almost all crops farmed in Botswana, the 200kg/ha per year derived earlier will be used here. This concludes that on average a farmer produces 36,12kg of cereals per year. Something worth mentioning, is that the local yield only accounts for 10% of Botswana's required cereals, as 90% of cereals used for domestic use are imported[64].
Farmer's current efforts of dealing with existing drought
Drought can be divided into two parts: predictable drought and unpredictable drought. As described in the section ‘The Botswanan situation, precipitation’, there is a rainy season and a dry season. Predictable drought is the dry season. Unpredictable droughts are droughts that occur in the rainy season or predictable droughts that last longer than usual. Predictable droughts that last longer than usual can be specified as prolonged dry seasons.
Farmers in Botswana use the farming cycle and the division of the rainy season into the early, mid and late sections as a way of dealing with the predictable droughts. These droughts are still a problem, as it pressures the agricultural sector into a critical period in which it must produce. Predictable droughts, however, form less of a problem than unpredictable droughts, as data shows that years, in which there was no unpredictable drought in the rainy season, produce a decent harvest. Data published by Botswana’s Ministry of Agriculture Department of Research, Statistics and Policy Development [45] show the crop yield in kilogram per hectare per year as can be seen in table 2.
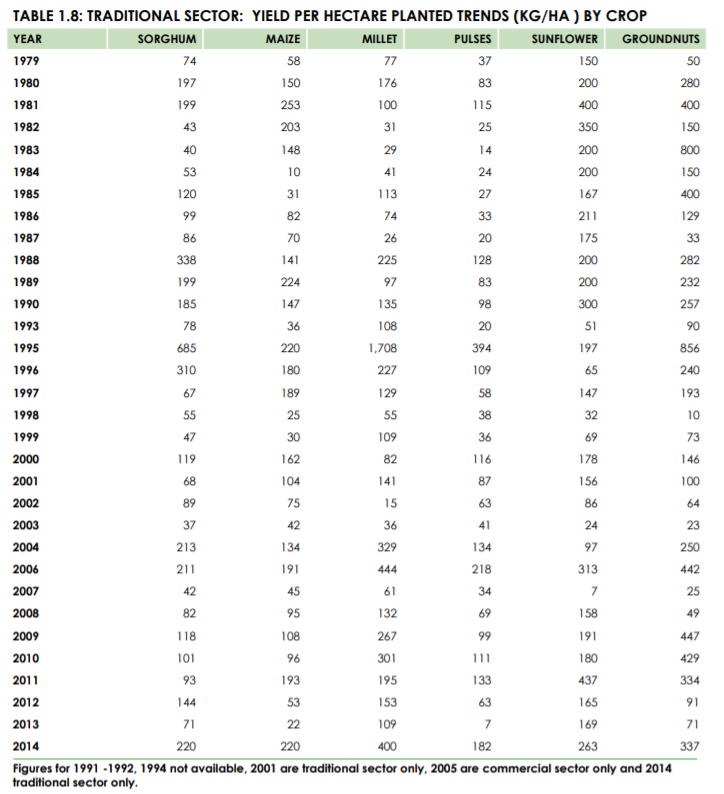
The Seven Year-Drought consisted of a prolonged dry season and dry months in the rainy season[46]. The Seven Year-Drought started in 1981 and ended in 1987. As the data below shows, there is a steady decline in crop yields after 1981 as it reaches an all time low in 1984. After the drought, in 1988, the food production is back to average. Normal years, or years with a predictable drought, have an average food production, hence the problem lies in unpredictable droughts.
Unpredictable droughts, such as the Seven Year-Drought, are the major problem. As the figure shows, after 1981 crop yields steadily decreased. Due to government effort and water reserves that are used in case of drought, the crop yields did not plummet in one year, but they decreased steadily. The water reserves are used for large scale farmers to assure a maximum crop yield given the circumstances. This means that small scale independent farmers are the real victims of a drought. It rarely is the case that a small scale independent farmer has access to water reserves or is supplied with water by the government. As of now, their best efforts are in managing the water they have as effective as they can. Though, if there is not enough, there is nothing they can do [42].
Opportunities in Botswana
Botswana is in many ways seen as a success story in Africa. As a developing country it has had the highest economic growth in the world. Now, the country is ranked fifth in the list of GDP per capita of African countries. In 2013, Fosu argued that after gaining independence from the British Empire in 1966, it was one of the poorest countries in the world (pp. 187-189)[17]. The country found great economic growth due to the following reasons. The country has known free and fair democratic elections ever since its independence. “Botswana has had no coups, no political instability, no civil wars, no threats of secession and excellent, dedicated, uncorrupt leadership” (pp. 188). Another driver of the economy is the country’s mining activities. Approximately 90 percent of Botswana’s export products are categorized under gems and precious metals. Botswana also invested in tourism as a sustainable source of income.
Although it may seem like Botswana is a country that does not need help, the country still faces the same problems as other poor Sub-Saharan African countries. “There is a great deal of poverty in rural areas, inequality is high (though falling), the economy has been unable to diversify, and more important there is a huge rate of HIV infection that the government is now fighting” (pp. 188)[47]. Small scale independent farmers are still struggling to make a living. When harvests fail, Botswana has the money to import food from other countries (mainly South Africa), but small scale independent farmers in poor rural areas are left with nothing.
There may lie an opportunity here, as the country still faces the problem of food production in droughts and poverty still exists in rural areas. If an automated system can improve the country’s food production, it will yield great benefits for Botswana. Through investing in a system that collects, stores and irrigates water automatically, small scale farmers have more certainty in their food production. This ultimately leads to a decrease in the inequality between the poor and the rich and it makes Botswana less dependable on food imports.
Users
The users of the technology can be divided into primary, secondary and tertiary users. The primary users are small based farmers that live in conditions which are suboptimal for agriculture. These conditions are mainly found in drought-prone areas of Africa, such as the areas in or around deserts. A country which stood out, was Botswana. Botswana has relatively long rain and (predicted) dry seasons, making it vulnerable to unexpected droughts. When researching the primary user group, smallscale farmers in Botswana, a surprising discovery was made. The percentage of young farmers, here categorized as being between 15 and 39, is only 10.2%. Another 38.3% was between 40 and 60 years old, with an impressive 51.0% of farmers being over 60 years of age. These percentages have been manually calculated using the data presented in Botswana’s annual agricultural survey report 2014[69], since the conclusions accompanying this data appear to be incorrectly stated in the report. Being primary users, the artifact or technology is directly aimed to be of use to this group.
Secondary users are the people in nearby villages that do not directly make use of the artifcat, but rather benefit from a more consistent food supply from the farmers that do. They benefit from the availlable food through the farmer's use of the artifact. Bigger farmer organizations (or collectives/unions) are also considered secondary users, as they benefit from higher production caused by the farmer's use of the artifact. Larger scale farmers may also use the technology, although it was intended for small scale farmers. Larger scale farmers are therefore considered secondary users.
The tertiary user is society as a whole. If food production increases it will benefit society. Society as a whole is not using the artifact, but it benefits from a more efficient use in water for agriculture through the increased production. As the artifact is aimed to increase the efficiency in the use of water, it is projected that more food becomes available. This is likely to cause economic growth in these developing areas, which makes it attractive to investors. Therefore, investors can also be seen as a tertiary user.
User Requirements
The technology requires a source of energy. As the energy infrastructure in Africa is underdeveloped to non-existent in certain areas, this forms a problem. In, for example, Sub-Saharan Africa, only an estimated 31% of all inhabitants have access to electricity [1]. Access to electricity is usually in towns or cities, which is not where the farmer has his piece of land. This means that the users require the technology to generate its own needed energy or to work on fuel.
The scarcity of water is the main reason behind this artifact. Water is very valuable in areas prone to drought and the sad reality is that it literally is a matter of life and death. Therefore the artifact must be efficient with water. This means that it should catch as much water as possible and store it while keeping losses at a minimum.
Although the technology is primarily aimed to be used for crops, it is unlikely that it will be the only use. If drought strikes and there is water available in the storage tank, people will use it for consumption. Even if it is explicitly clarified that it is no drinking water, to the people it is still better than no water at all. Therefore it is required that the storage tank keeps the water clean to a certain degree. This induces more difficulty in the design of the artifact which was not projected at first, but it does make the artifact more user oriented.
Former automation solutions have failed due to the weak state of the economy in these developing countries. Farmers live off the harvest rather than the profit they receive from selling their crops. This means that no jobs should be replaced by the artifact, which is vital for it to be adopted in the first place. The farmers will not use technology that replaces their jobs, therefore it is important that the artifact performs a task that no farmer can do. The system collects, stores and irrigates water, which are tasks that farmers cannot do themselves.
The artifact is aimed to help the farmer with water management. It is projected to perform this task autonomously, but in the end the farmer should have full control. In the case of a severe drought, if the water is required for drinking, the farmer should have access to the storage tank. Therefore the farmer should be able to intervene with the autonomous way of operation on request. The farmer should be able to understand how to interact with the artifact in the desired way. Therefore, it should be understandable. When specifying the system requirements, it should be taken into account that illiteracy rates are globally the highest in the underdeveloped parts of Africa, which is the same area in which the artifact is projected to operate.
A requirement that is applicable to all users and non-users of the artifact, is that the artifact’s greenhouse gas emissions should be as low as possible. This requirement becomes more and more important as the effects of climate change begin to show. It is especially important for the farmers in drought-prone areas as they live in areas which are expected to be heavily affected by climate change.
Assesment of possible design choices
Water collection
There are many possible ways to collect or gather water, all of these solutions have their own advantages and disadvantages. To make a decision on how water will be collected for our system, these will be explained and reviewed below in four different categories: Surface catchment and groundwater, Rainwater harvesting, Government-built water infrastructure and Water gathering robots.
Surface catchment and groundwater
The first solution which will be discussed is a well, this may be dug in places where a water reservoir can be found underground. Such a system is thus dependent on the amount of water in the reservoir and if a reservoir can be found. For our problem in botswana it is also required that the water reservoir does not have a high salinity, since on average the ground water in botswana is saline [86]. The cost of digging a well consists of the material for the well and the digging of the hole. Dependent on the depth of the hole, the materials, and the geographical location the cost ranges between $2.000 to $50.000 [57]
Instead of digging a well a automated pump can also be used, this would still be geographically dependant on the existence of water reservoirs and the salinity of these reservoirs. The automated pump also needs more sophisticated equipment to install the pump. Since it needs way less space t and it is cheaper ($8000) then a well, it could be a better solution [58]. One of the largest drawbacks to both the well and the pump is that if too much water is being drained from the reservoir it can dry up. This would require a new well or pump to be installed and could drastically increase the cost.
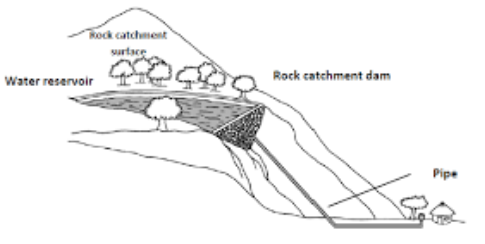
Surface catchment harvesting systems consist of four main types: rock catchment systems, earth dams, excavated reservoirs and sub-surface dams. The first three operate in a similar way. They are placed in a location where surface runoff water accumulates. Effectively, they have a large collection area, but they are no option for a farmer to own independently. Rock catchment systems are developed from a rock outcrop to catch and concentrate rainwater runoff into a storage structure. Due to the high runoff coefficient of bare rock, water can easily be stored in an open reservoir behind a retaining structure[87].

Earth dams are dams which are built out of compacted soil or rock fragments instead of the usual concrete dams. This lowers the cost of construction and still has the benefit that it can store water in an open reservoir behind the earth dam. [89]
Sub-surface dams are found in river beds. They capture water as it runs through the sandy ground in river beds [48]. Sub-surface dams increase the amount of water which can be collected from the underwater reservoir. However, a big disadvantage is that in order to collect this water a manual or electric pump is still needed to retrieve the water.
Runoff farming systems involves management of surface runoff to increase direct infiltration into fields, promoting crop growth and boosting yields in otherwise unfavorable soil moisture conditions. This works by planting the crops in steps, the excess water from the first step runs down to the second step, the excess water from the second step to the third step and so on [48].
Rainwater harvesting
Rooftop catchment systems, this system consist of a rooftop which is the catchment area, connected to gutters and downpipes to one or more storage containers. These storage containers can range from simple pots to large tanks [48].
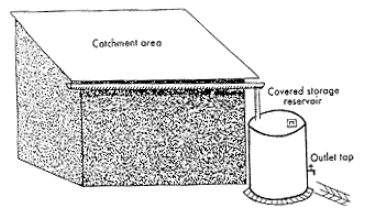
If the catchment area of the roof is too small to supply the farm, a canvas can be used. This can easily be constructed by spanning a canvas between poles. The canvas will slope down towards where the water will be stored to make sure that the water runs into the storage tank. The cost of such a canvas is highly dependant on the size and the type of material. Further information on the cost of such a canvas can be found in the system design. If the sheet is placed over the crops (when very little space is needed), a mechanism should be created to roll the sheet in and out . When decided that the farmer can make use of a semi-automatic, manual mechanism, costs are expected to remain lower when using a pulley system. An automated sheet, however, can become rather expensive. As an example, fully automatic pool covers for small pools cost around $2500. A benefit of the fully automatic method is the option to add a rain sensor for opening and closing based on weather conditions. These rainwater harvesting systems very dependant on the precipitation, this has the benefit that it is very cheap. However, a big disadvantage is that the farmer is dependant on the random distribution of rainfall. This can have big consequences if the farmer is highly dependant on this type of water source.
Government-built water infrastructure
Another possibility would be for the government of the country to make a countrywide water network. This network would provide water to all the homeowners in the country. This would work best for countries with a high population density like the netherlands, where distances between homeowners and farms are small. For countries like Botswana where the distances between settlements are vast, a lot of infrastructure needs to be implemented to make this work. The cost of these kind of systems for countries like Botswana are very high, and it is expected that the cost will far outweigh the benefits that are gained from such a system.
Water gathering robots
For farmers where the water supply is a vast distance away, and walking to this water supply is the only reliable way to gather water, a water gathering robot may be a solution. The robot would be able to travel to the water supply, collect the water and travel back to the farm. This would clear up time for the farmer to work on the farm or do other chores. A benefit to this system is that the robot would probably be able to gather more water and travel back and forth for the entire day. In case the robot would work on solar power only the capital cost has to be considered. The price for such a robot will likely be far to expensive since it has to be able to cross a large terrain with many different conditions. It also has to be theft proof since the introduction of such kind of robots in a poor country would probably lead to a lot of theft. All in all the cost will likely be far too high for the amount of benefits it presents.
Water storage
Preserving water
A large array of water storage options is already used in Africa, some of these systems are integrated with the water catchment system such as the rock catchment system, the Sand or sub-surface dams or groundwater storage. Other storage options are open reservoirs such as ponds or dams, underground tanks or above ground tanks.
The commonly used traditional open rainwater ponds (or other open air water storage systems) have a short lifespan after the rainy seasons, as the water is lost via seepage and evaporation. Seepage is a major problem in water storage in earthen reservoirs, accounting for losses up to 69% of the harvested water [52].
Unlike the traditional open ponds, the recently developed cisterns in different parts of SSA are covered to reduce evaporation losses, and their walls are plastered to avoid seepage losses. The most important materials for construction and covering of these types of rainwater storage tank include cement, clay, clay–cement, lime–clay or lime–cement and polythene sheets. The cost of these materials makes macro-catchment rainwater harvesting systems relatively expensive and poor farmers are discouraged from investing in them [51].
Underground or above-ground tanks are often used in combination with rooftop collected rainwater in sub saharan africa [50]. Some of these tanks have the advantage that they are closed. This prevents both evaporation of the water inside the tank and helps prevent water caused diseases such as malaria to develop [48]. In the rush to develop water harvesting and storage for climate change adaptation, too little thought is given to the possible public health implications. Poorly planned and managed water storage will have adverse implications for public health, which can undermine the sustainability of the interventions [49].
Stagnant VS. Moving
It has been shown that mismanagement of irrigation resulting in the formation of stagnant pools lead to the transmission of water-related diseases such as schistosomiasis, malaria and typhoid fever [23]. Moreover, under the condition of stagnant water, cyanotoxins can reach high concentrations in water and might represent health and ecological risks [37]. Furthermore, stagnant water has a decreased oxygen content which is disadvantageous for crop growth. It has been found that aeration of crops can increase the yield by up to 96% [38] [39] [40]
Irrigation
Defining suitable irrigation
In irrigation, the notion of ‘more equals better’ is everything but true. Irrigation requires careful use of water, as opposed to as much water as possible. It should be obvious that using too little water is an absolute waste, as the crop still consumes this water until it dries out before reaching the harvestable stage. Flooding the crops with water, however, is even more harmful. High amounts of water prevent aeration, leach important nutrients from the soil and increase salinization. Additionally, more water evaporates as the crops are unable to absorb the water in time. This project requires a form of irrigation which will keep the ground moisture enough to prevent water stress, but also prevent the moisture from being too high and causing oxygen stress at all times. The moisture level should therefore be as continuous as possible.
For maize specifically, we are looking at an average root depth of about 50 centimeters. In the picture below we can see that 70% of the extracted water, is extracted from the 25 centimeters closest to the surface. It is therefore important to use a method of irrigation which effectively waters these parts of the root.
Types of Irrigation
Different types of irrigation exist, to pick best type of irrigation for our user group these irrigation types will be compared. In figure 7 some of these irrigation types are shown, to give a better understanding of these irrigation sorts. These irrigation types can be classified in four distinct groups: flood irrigation, sprinkle irrigation, drip irrigation and subsurface irrigation. The latter poses some alternative options for some of the other groups. All these groups have their advantages and disadvantages. To compare these irrigation systems to the requirements of our users, each of these irrigation systems will be evaluated to choose the most effective one for our users.
Flood irrigation

Flood irrigation is a classical method of irrigation, which consists of flooding the land to some depth with a large volume of water so as to saturate the soil completely, then waiting some days or weeks until the moisture stored in the soil is nearly depleted before flooding the land once again. This type of irrigation requires a soil with a high moisture storage capacity to store the water. If water is plenty this is one of the easiest ways of irrigating the farmable land, but it does come with some downsides. The excessive amount of water on the plants can cause oxygen stress and the optimization of soil moisture is difficult to achieve. Furthermore, it results in considerable runoff and evaporation. An improved version of flood irrigation is furrow irrigation, here channels are made between the rows of crops to improve the water management. This has the benefit of not “drowning” the plant which causes a lower oxygen stress and having a lower runoff.
Sprinkle irrigation
This method is based on spraying water into the air and allowing it to fall on to the plants and soil as simulated rainfall. For soils with a low moisture storage capacity or in arid climates with high evaporation this type of irrigation is better suited than flood irrigation. However, it also has some downsides, the water which is not directly absorbed by the soil or plant, has a high chance of evaporating in arid climates. Salt-scorching may be a consequence of this water evaporation. When there is a high evaporation the salt which is not evaporated stays on the surface and can cause a high soil salinity, if there is not enough water to wash this salt away. For crops like maize which are moderately sensitive to salinity this can have quite a large negative consequences to the crop yield.
Drip irrigation
Drip irrigation is based on dripping water on to a fraction of the ground surface so as to infiltrate it into the root zone. As the name suggests, drip irrigation is irrigating a field by having water fall drop by drop onto the surface to be irrigated. This method of irrigation avoids some of the issues present in other on-surface techniques if implemented correctly. So long as the rate of application of water on the soil, or in other terms the drip rate of the water, does not exceed the soil’s potential intake, no water will remain on the surface. This greatly reduces loss of water due to evaporation or and prevents water from flowing over the surface to other plants or away from the field entirely.
This type of irrigation works by making use of the high level of friction of water attempting to pass through a narrow opening. The tubing through which the water flows contains orifices, called emitters,cause the water to drip out of the tubing at a continuous rate at a low pressure, as opposed to the jets of water caused by sprinkle irrigation. Commercial emitters have a discharge rate of either 2, 4 or 8 litres per hour. To manage the timing of the drip irrigation, valves are used. These can either be manually operated, or set to automatically shut or open based on the volume of water that needs to be discharged.
An important drawback of drip irrigation is that once installed it needs constant supervision, as the tubes and emitters are prone to clogging or mechanical damage. Spare parts need to be at the ready at all times, and some expertise on the system is required to perform maintenance on it. Although drip irrigation is not yet adopted by many, a few farmers who have, have expressed their concerns with drip irrigation[41] which may explain as to way drip irrigation is not adopted more widespread. They have made it clear that if this form of irrigation is to benefit them, attention must be paid to educating the farmers on how to perform maintenance and how to make repairs to the system. Additionally, farmers also inquired the use of complementary technologies alongside drip irrigation, which makes it a great candidate for this current project.
The lateral tubes, the tubing that contain the emitters, can be spaced arbitrarily from each other. If crops are grown in rows within close proximity of one another, costs can be reduced by skipping every other row of crops or by placing the tube in the middle between rows, as to irrigate two rows with a single lateral tube.
The capital investment cost of drip irrigation systems are relatively high because large quantities of pipes, tubes emitters and ancillary devices are necessary to control the precise delivery of water to specific sites in the field. Moreover, since standard drip-emitter orifices are narrow, expensive filtration equipment is necessary to prevent clogging. Hence drip systems tend to be more expensive, at least initially, than surface irrigation. Drip systems may prove to be economically justifiable in the long run if they can indeed prevent the waste of water and the degradation of land that is so frequent under traditional irrigation.
Subsurface irrigation
This last method is a way to introduce the water directly into the root zone by means of porous receptacles or by subsurface drip irrigation. One of the oldest irrigation methods is clay jar irrigation. This method consists of placing porous clay jars in shallow pits. Water is poured into jars either by hand or by hose and slowly passes through the clay. A newer version of this technique is the below ground clay pipe, designed to spread water along a continuous pipe in the soil, rather than at discrete locations using pots. This pipe can be placed between rows of plants if these are close to each other or directly under the roots if they are further apart. The perforated plastic sleeve method is an interesting variant on the subsurface clay irrigation, where a perforated plastic sheet is used to irrigate the root zone. This has the advantage that it is very low in cost. However, if a soft plastic is used, it cannot maintain its shape and has to be filled with sand, which lowers the volume of water it can hold. Subsurface drip irrigation is a more sophisticated way of irrigating. This type of irrigation uses plastic perforated tubes below ground to deliver the water directly into the root zone. The amount of water which is delivered to the root zone can be controlled by the changing the pressure in the plastic tubing. This has the advantage that the water will not evaporate on the surface and that the amount of water feeded to the root zone can be controlled precisely. However, maintenance is a big issue for this kind of system since the pipes are not easily accessible.
Cost efficiency analysis
Below is a table which contains the three most common types of irrigation: Sprinkler irrigation, furrow irrigation, and drip irrigation. This table lists an overview of mean values on various topics, which all contribute to a concluding effectiveness. The capital cost is divided by the life expectency of the system and then summed with the maintenance cost to picture the annual expense. The total efficiency of the system is determined by the efficiency of water usage and the expected yield increase. Note that the water efficiency is only based upon the perlocation of water, which is difficult to estimate and has a large error margin. This potential inaccuracy will be compensated by the loss of water due to evaporation, which in the table below is not taken into account. Even without the consideration of evaporation, which will be a huge contributing factor in Botswana, drip irrigation proves to be the most cost effective in the long term, as can be seen in the final column of the table.

Existing Solutions
Irrigation

Many different types of irrigation exist, all these types can be divided into four different kind of categories: Rainfed farming, gravity-flow irrigation, small-manual-pump irrigation and small-motor-pump irrigation [54]. All of these kind of irrigation have their own advantages and disadvantages. In table 4 these irrigation systems are explained in some more detail.
The bucket kit is a small-scale irrigation system that is used in Kenya. The bucket is mounted on a stand, which holds it one meter above the ground. The drip lines are supplied in lengths of 15m, and for, best result, they are laid on level ground. If the drip lines go up a small slope, the bucket or drum should be placed on the highest side. The lines are laid with the emitters facing up to reduce the problem of sediment setting on the emitters [73].
There are many suppliers of different commercial drip systems in Kenya. The majority of existing drip lines are designed for high-pressure systems. There are a few specifically designed low-head drip lines. Two common problems experienced by farmers using low-head drip systems are uneven water distribution, especially on sloping land, which can drastically affect yields due to under-irrigation of some plants and over-irrigation of others; and the tendency of emitters to clog [73].
The cost of these systems differ per supplier and can be as cheap ($0.18) per meter. More information on the cost and different kind of drip kits can be found in the following table.

(Subsurface) drip irrigation can reliably provide an increased yield and water use efficiency. Some difficulties in adopting this technology have been expressed by the few farmers who adopted it in sub saharan africa. The main recommendations for being able to have a successful adoption of this technology is, according to the farmers: (1) Redesign drip system to help prevent common problems (2) Invest in clear education for adopter, focusing on maintenance and repairs. (3) Encourage the adoption of complementary technologies to support the function of drip systems, such as water storage, purification and delivery systems[41].
Many different types of irrigation exist, all these types can be divided into four different kind of categories: Rainfed farming, gravity-flow irrigation, small-manual-pump irrigation and small-motor-pump irrigation [54]. All of these kind of irrigation have their own advantages and disadvantages. In table 4 these irrigation systems are explained in some more detail.
The cost of irrigation systems can differs quite dramatically per project and region, in the following table a summary of the costs of irrigation projects for SSA and other regions are summarized [55]. For our research only the data from sub saharan africa is needed, which can be seen in bold. This has also been divided into the ‘’success’’ projects and the ‘’failed’’ projects. From this data it seems that the cost of these irrigation projects is highly dependant on if the project is going to succeed or not.

Soil measurement devices
There are many different techniques to measure the soil moisture levels. To make a better choice which one to pick, the different techniques will be compared to each other with regard to the user requirements. This is listed in the table below.
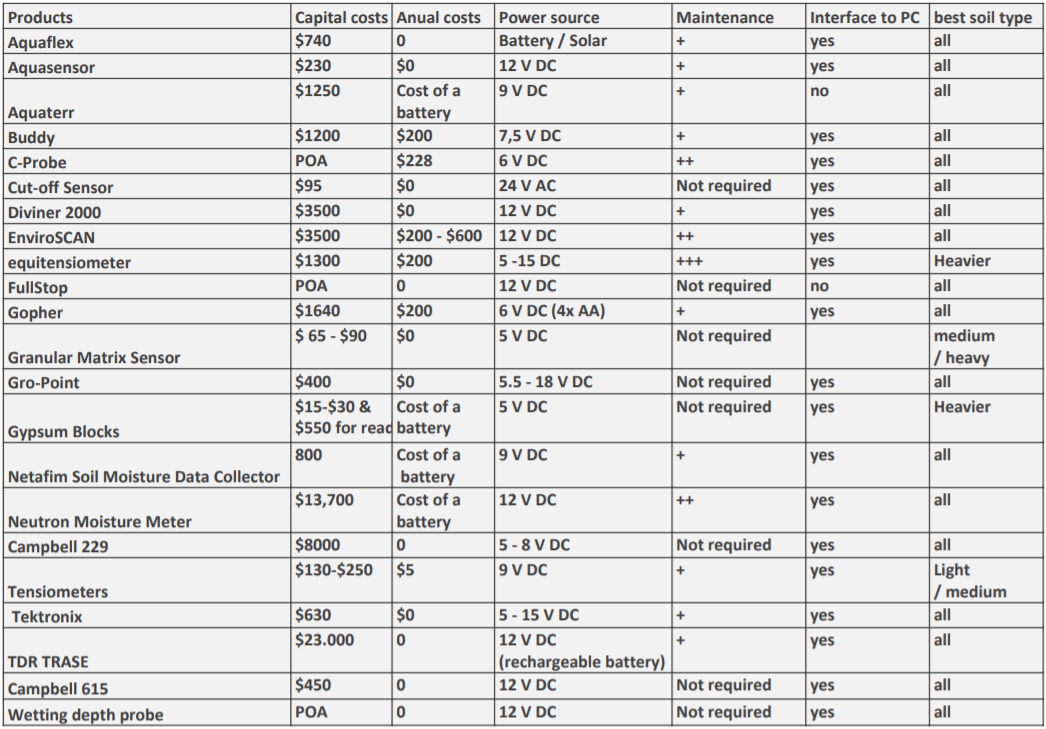
As can be seen in the table, devices may differ quite dramatically per category. To ultimately decide which device will be put in our system, these devices will be compared to our system and user requirements. The first requirement which will be looked at, is that the system should be cost effective. Some of these devices with a high capital cost (>$1000) or high annual cost ($>100) will therefore not be taken into consideration. Furthermore, the measurement device has to be able to interface to a computer, since this is necessary to make an automated system. Additionally, the measurement device should require as little maintenance as possible, since maintenance of the sensor may be difficult for the farmers. Since most of the farmland in Botswana consists of a lighter sandy soil, measurement devices that only work on medium/heavy soil are also unwanted. This list of requirements only leaves three measurement devices from the table, namely the cut-off sensor, the Gro-point and the Campbell 615.
To assess which one of these sensors would be best for our system, these sensors will be compared.
Cut-off sensor: “The cut-off sensor is a rectangular plastic card 20 x 10 cm that is covered in geotextile. Two parallel copper rods are glued to the face of the card and are connected by cables to an electronic controller. The controller is fitted in the power line to the solenoid valve. When the wetting front arrives at the cut-off sensor, the geotextile becomes wet and the electrical resistance between the two rods decreases. This change is detected by the electronics, and the power to the valve is turned off. As the soil dries the resistance increases and the sensor is reset [56].” The soil sensing volume of this sensor will thus be around the size of the sensor itself [24]. Furthermore, no calibration is necessary for this type of sensor.
Campbell 615:
“The campbell 615 consists of a 30-cm wave guide with the measurement electronics built into the probe head. the signal return from the guides causes a circuit (a bistable multivibrator) to change states between two discrete values. The output of the sensor is a frequency that reflects the number of state changes per second (or Hz). A wetter soil will cause a longer signal-return time, and will cause the 615 circuit to vibrate at a lower frequency. The wave guides can be buried for in situ readings or used as a portable probe [56].”
Furthermore, “calibration relates the output signal frequency to the volumetric water content. A calibration equation has been developed for a loamy fine sand. It has an accuracy of ± 2%. The product literature states that the same equation has been used with a range of mineral soils with an accuracy of ± 2.5%. The 615 has the disadvantage of being affected by salinity in soils of salinity > 2 dS/m. Custom re-calibration is required to optimise accuracy[56].”
This type of sensor has a soil sensing volume radius around the sensor of about 1.2 inch [24].
Gro-Point: “The Gro-Point uses the time-delay transmission concept to measure the soil dielectric. it measures a larger soil volume (4 - 5 ft3 ). and is designed for greater accuracy in both high clay and high sand soils. The Gro-Point is buried at the required position in the root zone. Furthermore, no calibration is necessary for this type of sensor [56].” [24]
From this information it seems that the Gro-point will be the best choice for a system where money is no problem. It may be more expensive then the cut-off sensor but makes up for it since it has a large measurement volume, which means less of these sensors will have to be placed. It also has the advantage that it is not a discrete sensor. The Gro-Point can give a precise value for the amount of water in the soil and not just say if there is too much or too little.
System requirements
High Level system requirements
- The system should contain a canvas that catches all the rain that falls on its surface
- The system should contain a water tank that can store the water surplus
- The system should contain an irrigation system that can provide the crops with water in an efficient way
- The system should contain tubes that connect the canvas to the water tank and irrigation system
- The system should contain valves in the tubes that can be controlled by a software system to choose if the water is led to the water tank or the irrigation system
- The system should contain sensors that can measure the humidity of the ground
System design
The system can be divided into four parts: catching, maintaining and distributing water and the connection and control of these parts.
The first part of the system, which is aimed to catch rainwater, will exist of a canvas. This canvas is elevated and inclined at an angle. The elevation and inclination angle are needed to create a height difference which allows gravity to guide the water down one side of the canvas. The canvas should not be shaped like a plane, but rather have a V shape, which guides the water towards the middle. This allows it to be collected in one central point rather than along the edge of the canvas. To make sure that the canvas is forced into the desired shape, a certain amount of tension is needed. The material of this canvas is also an important aspect. It is straightforward that it should not be water permeable. Furthermore, it is desired that the material is sustainable and robust to ensure low maintenance costs. It is also desirable for the material to be as cheap as possible.
The second task the system has to perform is storing the water. The water storage will be done by use of a water tank. This tank should store a sufficient amount of water. In order to ensure that the water is safe to use for crops as well as consumption, attention has to be paid to how the water is stored. It should be a closed tank to prevent mosquitos or other insects using it as a breeding place. In order to prevent the growth of bacteria, the water in the tanks has to be moved around per period of time. Other important aspects are the size and the material that will be used. The material is desired to be as cheap as possible and should not be permeable. The size should be big enough for it to sustain the water supply of the farmer for x days in a drought.
The third task the system has to perform is distributing the water. This will be done by the use of an irrigation system. To create an automated irrigation system, the following factors have to be taken into account. A decision has to be made on whether tubes are placed in the soil to transport water directly to the roots or tubes are placed above the ground that transport water to the location of the plants. In order to automate the system, it needs to have a controller and sensors and actuators. The irrigation system gets an input signal from the soil measurement sensors that are in the ground. The actuators are a pump and valves which control where the water will flow. To design a system as effectively as possible, requirements, desires and constraints should be specified.
The fourth part is the connections between and control of the first three parts. To connect the canvas to the water tank tubes will be used. To connect the water tank to the irrigation system tubes are used that contain controllable valves. To control these valves a microcontroller is needed. This control system will get input from sensors that measure the humidity of the ground and actuates the valves to deliver the amount of water accordingly. Depending on the need for pressure on the water, a pump can be an additional actuator. To power the system, a source of power is needed. This can be done by a solar panel.
Storage and evaporation
Theory behind evaporation
Depending on the temperature of the body of water, there is an average energy in the particles that make up this body. Since it is an average, some particles have energies higher or lower than the average. At the surface of the body of the liquid, due to higher energies some particles move fast enough to escape from the attractive forces between the particles. This process is called evaporation.
The now airborne particles are in no connection to the body of water and can move freely through a three dimensional space in the gaseous state. The airborne particle travels through the space above the surface of the body of water. There are two situations that can be distinguished. Either the body of water is open to the air, like surface water, or the water is in a closed container, like a storage tank.
In the case of surface water, the airborne particle is not likely to collide with anything that redirects its trajectory back to the body of water. In this way, the particle is ‘lost’. This process will repeat for eventually all particles, hence all the water will evaporate.
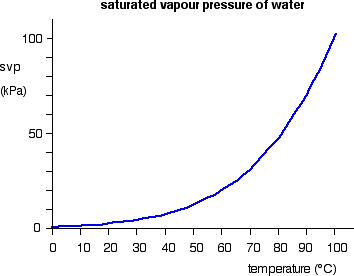
In the case of a closed container, the airborne particle can bounce off of the ceiling and walls until it eventually reaches the surface of the water again or it condensates on the walls or ceiling. As particles return to the surface, other particles are ejected again which forms an equilibrium in which the amount of returning particles is equal to the amount of ejected particles. This implies that there is a fixed number of particles in the gaseous state, which depends on the temperature. The particles in gaseous state bounce off of the walls and ceiling of the container exerting a pressure. This pressure is called the saturated vapour pressure. As shown in figure 9 below, the saturated vapour pressure depends on temperature[71].
Approximation
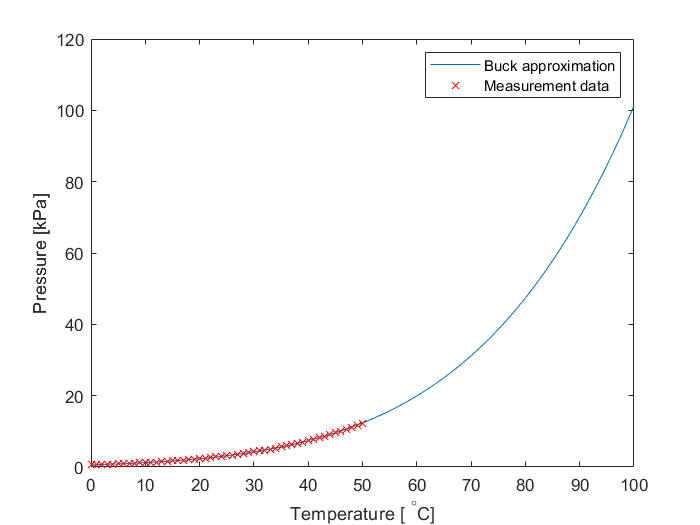
In 1981, Buck made an approximation for the saturated vapour pressure by fitting curves on the data of measured saturated vapor pressures per temperature [72]. In this equation, the pressure in kPa, Ps(T), is given by
Ps(T) = 0.61121 e^((18.678-(T/234.5))(T/(257.14 + T))) ,
where T is the temperature in degrees celsius. In the temperature ranges between 0-50 degrees celsius, the Buck approximation has a lower average error than other approximations, hence it will be used here. The maximum error in this temperature range is 0.04%. The figure below shows a Matlab plot of both the approximation and known pressure per temperature measurements. One can observe that the approximation is rather accurate in the temperature range that the storage tank is likely to be in.
The molecular weight of water is 18,01528 g/mol. By taking the density to be approximately equal to 1, one can freely interchange between milliliters and grams of water. The volume of water in milliliters that is evaporated can then be calculated by the amount of particles in gaseous phase and divide that by the amount of particles in a mol (6.02214e23 Avogadro’s number) and then multiply this number by the molecular weight. In equation form:
Vevap = 18.01528 agp / 6.02214e23,
where Vevap is the evaporated volume of water in milliliters and agp the amount of particles in gaseous phase.
By using the ideal gas law, the amount of mol can be calculated. The ideal gas law is given by
PV = nRT,
where P is the pressure in atmosphere, V is the volume which the gas occupies in litres, n is the amount of mol, R is the gas constant and T is the temperature in Kelvin. The variable in this case is the temperature and the pressure can be approximated by Buck’s equation as a function of temperature. The gas constant for water vapour is 250.899 atm L mol-1 K-1. The volume which the gas occupies depends on the size of the tank and the amount of water in it. The volume is the total volume of the tank minus the volume of the water in it. The figure below shows the amount of water vapour in the tank in equivalent volume of liquid water.
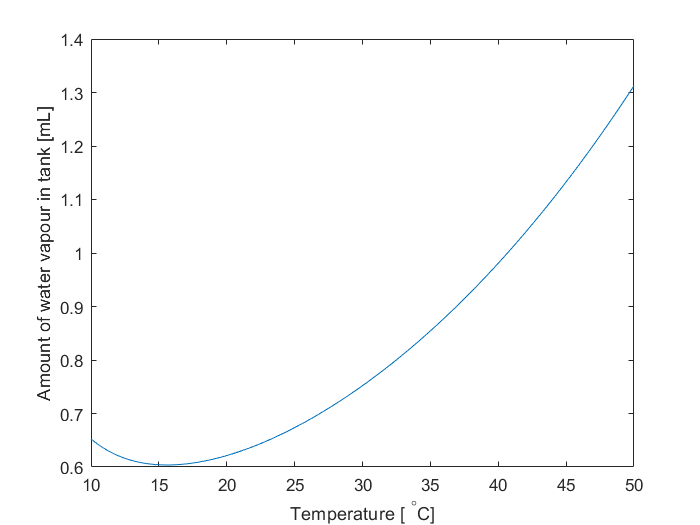
By opening the tank, the water which is in water vapour can be lost and the change in equilibrium causes more water to evaporate. If the tank has no holes or is not left opened, then the amount of water lost by evaporation is small.
Soil water evaporation

Water from precipitation that lands on the ground will stay in the soil for a period of time. How much water and how long it stays in the soil depends on a number of factors. These factors include the soil composition, the amount of organic material in the soil, the amount of vegetation on the soil, the temperature and insulating layers on the soil. To obtain an accurate estimation for the model, these factors are assessed for the soil in agricultural areas in Botswana.
There are several different types of soil in Botswana. These different types of soil have different compositions and due to that different characteristics. In the table below, different soil groups are listed with their corresponding contents [90]. For each soil group, the surface and sub-surface contents are indicated by the letters A and B respectively. The surface is considered to be a depth range of 0 cm to 20 cm and sub-surface 20 cm to 50 cm. The soil type that is found in the agricultural areas of Botswana differs heavily, but here the focus is on heavy luvisols. This is can be found by looking at the North East District in the soil map shown in figure 12[92]. The source has the image in a better quality, which allows it to be zoomed in on better. The soil code LVh25 can be found, which can be traced back to the type heavy luvisols.

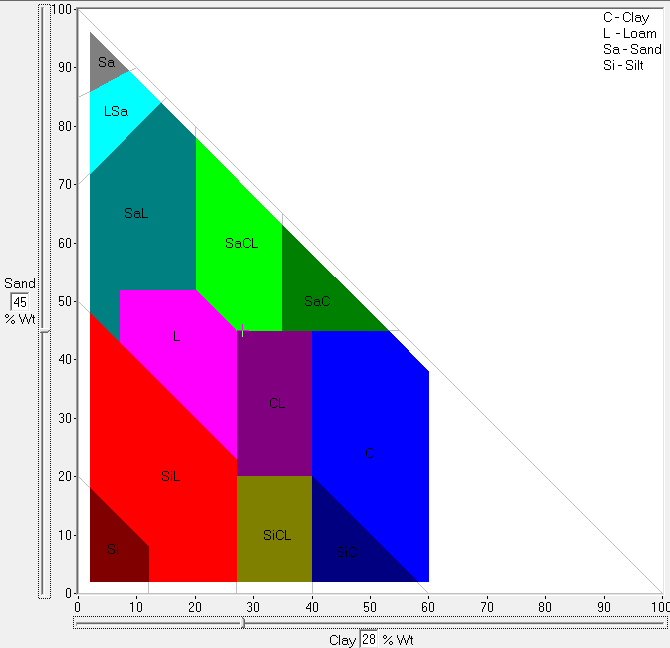
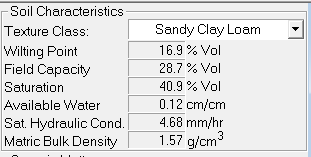
The characteristics of this type of soil can be used in the program Soil Water Characteristics [95]. Soil Water Characteristics is a tool that allows a user to give the soil composition as input and it yields calculable soil characteristics based on the given inputs. By using the inputs based on heavy luvisols, the input in the program is as shown in figure 13. Roughly 45 percent sand and 28 percent clay places this soil on the edge of the category ‘Sandy Clay Loam’ (SaCL), which can be seen in the figure as the middle high, light green section, indicated by the cross. The program then uses soil equations, based on research done by Saxton et al. (2006) [93], to give the outputs as shown in figure 14. The blue line represents the saturated hydraulic conductivity, which describes the ease with which fluids can move through the pores of a soil. Here the maximum value is 4.68 mm/h, hence fluids can seep into the soil at most 4.68 millimeter per hour.
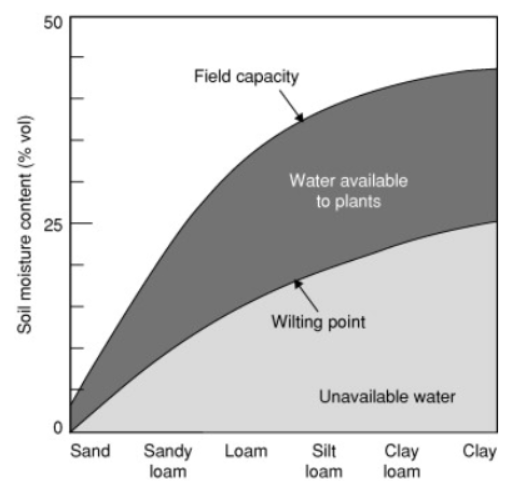
In order to acquire the amount of water available for the plant 2 values are needed, the field capacity and wilting point. In many soils the water immediately start draining deeper into the soil after rain or irrigation. after a few days the water content in the soil will reach a nearly constant value, this value of water content, expressed as a percentage is called the field capacity (FC)[16]. The wilting point (WP) is defined as the amount of water in the soil expressed in a percentage, that is held so tightly by the soil matrix that roots cannot absorb this water and a plant will wilt. [94]. In order to get the available water for the plant these two values are subtracted from each other to gain the available water (AW). To visualize these values the FC, WP and AW can be seen in figure 15 for different kind of soil.
The percentages given in figure 14 for the FC and WP are 16.9% and 28.7% respectively which yields an AW of 11.8%. This AW may be considered to mean that in 100cm of soil, there is 11.8 cm of equivalent surface water in plant available form per meter. This leads to the following value for available water per cm: 0.12 cm/cm, which equals 120 mm/m. These values are later used in the program CROPWAT.
Modeled irrigation requirements
In order to get the best results out of our model a number of other factors have to be calculated. Namely, how much water the soil can hold and how much water the plant uses. To obtain these numbers two different programs will be used CROPWAT and soil water characteristics. The soil water characteristics has given information specifically about the soil in botswana. The information gained from this program is now put into CROPWAT. This program uses the data from the soil, climate and crop to calculate the irrigation requirements that are necessary for our crop in botswana. To understand these outcomes a step by step approach is explained below. Furthermore, an explanation is given of why certain values are given as the input for the CROPWAT model and what the different outcomes mean.
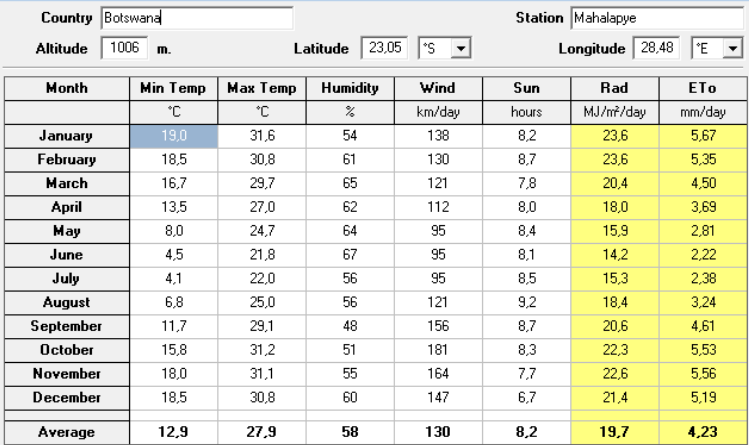
Climate data
The first information CROPWAT needs to eventually calculate the irrigation requirements is the monthly climate data. The information in the white columns which can be seen below has been retrieved from the weather station in Mahalapye, Botswana. The average minimum and maximum temperature, humidity, wind speed and sun hours are determined per month and are given as an input for this model. The information in the yellow columns are determined from this information. This information consists of the average monthly radiation (Rad) and the reference evapotranspiration from a reference surface not short of water (ETo).
Radiation
Radiation (Rad) is the amount of energy that is effectively available to the crops from extraterrestrial radiation [97]. It is expressed in megajoule per square meter per day (MJ/m^2 per day). In calculating the radiation, the model considers the following factors. The amount of effective sunshine, which can diminish due to factors such as clouds and reflection. The flux density of the incoming light rays are assessed based on the location of the weather station. Since the earth has a spherical surface, light beams tend to diverge more as they illuminate areas further away from the equator. This means that there is a different intensity based on geographical coordinates. Degrees in latitude are converted to radians, which is more convenient in the formulas. Degrees of latitude on the Northern Hemisphere are seen as positive radians and degrees of latitude on the Southern Hemisphere are seen as negative radians. This is why some radiation values may be negative, whereas physically they cannot contain negative energy. The value for Rad is to be taken absolute.
ETo
The reference evapotranspiration from a reference surface not short of water, denoted by ETo, is used to study the evaporative demand of the atmosphere independently of crop type [97]. The reference surface used is a hypothetical grass reference crop with assumed characteristics. Since this reference surface is static and therefore unaffected by the type of crop in consideration, it can be calculated by only meteorological data. As a reference surface not short of water is assumed, water is abundant at the evapotranspiring surface, hence soil factors do not affect the evapotranspiration. ETo, expressed in mm/day, is calculated by FAO approved methods. This is important as it can be used as a reference for any soil type, hence it is a parameter used in the equations CROPWAT uses.
Rain data
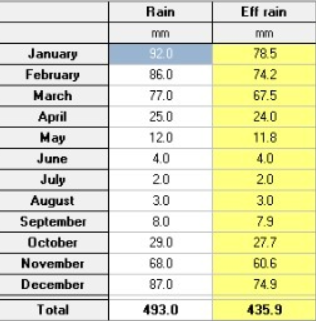
The second input information CROPWAT needs is the average rainfall per month. This data is also obtained from the weather station in Mahalapye, Botswana. The effective rain (Eff rain), which can be seen in the yellow column, is calculated from the information given before.
Effective rainfall
Not all rainfall can be effectively used, due to losses caused by runoff, percolation or evaporation. CROPWAT uses the USDA Soil Conservation Service Method [97] to determine the effective rain available to the crops from monthly averages, expressed in millimeters. Based on the average monthly ETc (evapotranspiration per crop), the effective rainfall is listed in the table below [97]. The effective rainfall is important, since it is the actual amount of water available to the plant.

Crop data
The third step is information about the crop which is planted, in this case maize. the first step is selecting the planting date, this means when the crop seeds are planted into the soil. This is important since each stage of development has different water requirements.
Crop coefficient
An important coefficient in this step, is the crop coefficient Kc [99]. This coefficient not only differs per crop, but also varies between growth stages of said crop. This is due to the fact that different stages of growth require different amounts of water. In the beginning of the growth cycle, only little water is needed. The water demand will grow gradually until it peaks somewhere around the middle of the crop growth, after which it decreases slightly until maturity. Because of the differences in water requirement, crop growth will be split into an initial stage, an intermediate stage and an end stage. These stages use Kcinit, Kcmid and Kcend respectively as their crop coefficient. This Kc is primarily used in the following equation:
ETc = ETo x Kc
This equation uses the reference evapotranspiration and the crop coefficient, to determine the evapotranspiration for a specific crop in a specific stage of growth. From this equation, one can observe that Kc is basically the ratio of ETc to ETo and it expresses the difference in evapotranspiration between the cropped area and the reference grass surface.
The Kc represents the effects of crop transpiration and soil evaporation, but this can be done with two different types of Kc. It is common practice to use the so-called single crop coefficient. This single crop coefficient, combines the effects of the crop transpiration and soil evaporation in a single coefficient Kc. This single coefficient is averaged over time, and is therefore used for intervals. A more precise, yet also more complicated, definition of Kc is called the dual crop coefficient. This coefficient is split up in Kcb, the basal crop coefficient, and in Ke, the Soil water coefficient. The dual crop coefficient requires more calculations and is only used when a high accuracy of soil moisturizing is required. For the remainder of this project, we will use the single crop coefficient [97].
Root depth
Another important factor is the root depth. While the total area of the roots is important, since it allows for more water access, it is important to note that deeper roots are more efficient than wider roots. Water near the surface is more likely than evaporate than the water deeper down in the soil.
Critical depletion fraction
The Critical depletion fraction represents the critical soil moisture level where first drought stress occurs affecting crop evapotranspiration and crop production. Values are expressed as a fraction of Total Available Water (TAW) and normally vary between 0.4 and 0.6, with lower values taken for sensitive crops with limited rooting systems under high evaporative conditions, and higher values for deep and densely rooting crops and low evaporation rates [98].
Yield response factor
Lastly there is the yield response factor, Ky. This factor quantifies the response of yield to water supply, by relating yield decrease to relative evapotranspiration deficit. The factor differs per crop since every crop reacts with a different level of severity, but also per stage. As can be seen in the picture below, the Ky can be specified per stage of growth. A lower Ky means a lower impact on yield after a lack of water. Ky is usually highest during the flowering and yield production periods.[98]
Soil data
The last type of data CROPWAT needs is provided from the Soil water characteristics and is needed to simulate the effects which the soil can have. The inputs are shown in figure 18 and explained in further detail.

Total available soil moisture
The first data which is needed is the total available soil moisture. This can be calculated by subtracting the wilting point (WP) from the field capacity (FC), which are explained above. The total available soil moisture is the amount of water actually available to the plants in the soil. It is expressed as the amount of water in millimeters per meter of depth. This is required to know how much of the water in the soil actually is reachable by the roots of the plants [97].
Maximum rain infiltration
When rain lands on the soil, it does not seep into the ground straight away. The maximum rain infiltration rate describes the permeability- how fast the water moves through the pores of the soil downwards. It is expressed as millimeters of distance per day. This allows the model to calculate how far the water will have gone into the ground after landing on the soil. This is important to keep in mind when modeling the availability of water to the roots, since the water does not stay in one place [97].
Maximum rooting depth
The maximum rooting depth describes how deep the roots of a crop can go into the soil within its growth cycle. The program uses a model for root growth which ultimately reaches the maximum rooting depth over an amount of time depending on the crop. The maximum rooting depth is needed to analyze the extent to which the plant is able to absorb water from the soil. It is expressed in centimeters of distance [97]. The maximum rooting depth is important since this is the depth where the soil acts as a barrier for the roots. This can be very variable per plot of land and can be deepened by destroying the layer which is restricting the root growth.
Initial soil moisture depletion
The initial soil moisture depletion describes the dryness of the soil at the start of the growing cycle [97]. It is expressed as a percentage of the total available moisture. Since the crops in this case are planted at the end of the dry season, there is a negligible amount of water in the soil at the start, hence it is 0%.
Crop water requirements
Given all the data mentioned before, the following table is obtained. From this table the total amount of irrigation needed per month to get a 100% yield can be obtained.
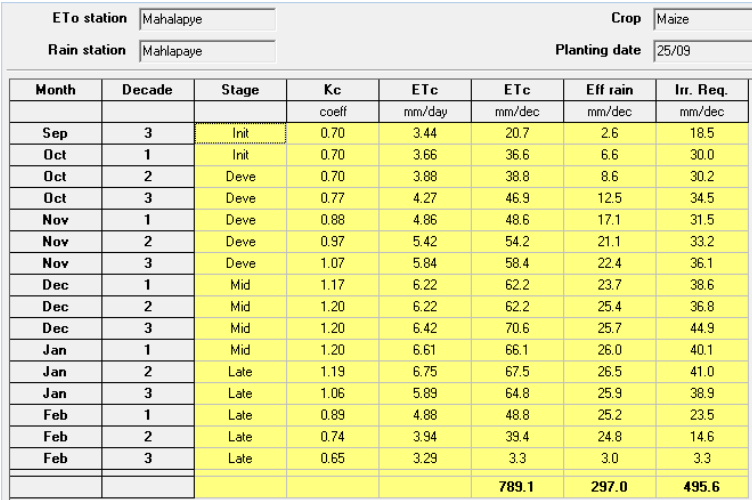
Crop evapotranspiration under standard conditions
The crop evapotranspiration under standard conditions (ETc) is the evapotransiration from well fertilized, disease free crops, under optimum soil water conditions grown in a large field and achieving full production. The crop water requirements (CWR) refers to the amount of water that is needed to compensate for the loss through ETc. Thus, these two values are identical to each other. It can be calculated from climate data by integrating the crop characteristics into the ETo [97].
Irrigation requirements
The irrigation requirements (IR) refers to the water that must be supplied through the irrigation system to ensure that the crop receives its full crop water requirements. This irrigation requirement can be higher than the crop water requirement to allow for inefficiencies in the irrigation system. It can also be lower than the crop water requirement if the crop receives water from other sources like rainfall [97].
Consecutive drought & crop yield losses
Theory
To estimate the return value of conquering unexpected periods of drought, it is important to determine the loss in production as a result of said drought. A generalized study which did not focus on the different stages of growth, but rather looked at the results of reducing the water supply during the full 130 day growth cycle, found that a water reduction of 40% correlates to a 39% decrease in yield [74]. One could use this finding to assume that the reduction of water relates to reduction in yield on a 1 to 1 ratio. This means that a quick and most likely inaccurate estimation of crop yield can be made by expressing the total precipitation as a percentage of the optimal quantity of water for maize.
However, the impact of drought varies greatly depending on the stage of growth the maize is currently undergoing and on the length for which the drought persists. For that reason, the different stages of growth will be considered below, each with their estimated production loss as a result of drought.
Growth stage. [Days 0 - 60]
First, consider the early growth stages. During this period the maximum yield is determined, which relies on the amount of kernel rows, the amount of kernels per row, and the kernel size. In the growing stages, the first symptom of water stress can be observed, the curling up of the leaves. This curling can already be observed on the first day of insufficient water. The longer the drought persists, the more the leaves will curl up. Maize can recover from a lack of water, as long as the missing water is supplied within four days. After four consecutive days of drought, crop yield will start to diminish[75]. Then, four to six weeks after sprouting, in the 6th leaf stage (V6), the amount of rows of kernels is determined. The next few weeks, up until the VT stage, is mostly just growth of both roots and leafs.
For the growth stage, up until week 9, the assumption is made that after 4 consecutive days of drought, it has been found that the yield is reduced by between 1% and 3%
Pollination stage [Days 60 - 80]
Nine weeks after sprouting, during the VT stage, the maximum amount of kernels per row is set. This takes one week on average. After the VT stage the R1 stage starts, lasting two weeks, during which the actual amount of kernels that will start growing is set. From this moment onward, water stress will cause kernels to abort their growth. [76][77]
The 3 weeks in which pollination and reproduction stages take place, called the VT stage and R1 stages respectively, are the most important weeks and the maximal yield is mostly determined in this stage. This time period encaptures the 1 week before pollination and the 2 weeks after pollination. During this period, an average of 8mm - 9mm of water is required daily. In phases VT and R1, which from now on will be referred to as the pollination phase, drought has the most severe consequences. This is due to the fact that losses caused by pollination failure can not be recovered. Every day of drought irreversibly reduces the yield by between 3% and 8%. After four consecutive days of insufficient watering, the duration of the so called anthesis-silking interval is increased, which causes a detrimental 40-50% loss of total yield.[78]
Kernel production stage [Days 70 - 130]
The kernel production, which starts in the R1 stage, makes up the last eight weeks of the crop growth. The first two weeks of this period have been covered in the pollination stage. For the remaining six and a half weeks of the kernel production, the loss in yield is initially 2.5% per day and scales up to 5.8% per day of drought, depending on the duration of the drought. Since our model is built on weekly sections rather than daily sections, this would translate to a rounded average of 30% yield loss per week.[78]
Application
We have used the information above to compose a formula which has been used in the model.
Explanation of the formula
To implement the effects of drought in our model, we use an equation of the format f(x) = x^e / c. In this formula, x is the water deficit in percentages. The result of f(x) is the percentage of yield that will be lost as a result of this water deficit. The exponent e represents how strong x and f(x) are related. A higher e implies that a change in x has a higher impact on f(x), which in turn causes f(x) to increase more rapidly when the water deficit increases. We have chosen e based upon our findings regarding the effects of drought, as described above. e Starts at its lowest initially and reaches a maximum during the pollination, after which it slowly decreases again. Since e not only amplifies the relation between x and f(x), but also increases the overall value of f(x), we introduced another variable c to account for that. We use this c to get f(x) in line with the projected yield losses during each of the growth stages explained above.
Note: Since f(x) can exceed 100%, yield loss is defined as the maximum of 100 and f(x)!
The numbers
Each numbered line represents 10 days in the growth process of maize. For example, line 7 represents the seventh set of 10 days, i.e. days 60 to 70. Since the growth duration of wheat differs depending on the climate it is planted in and the program, CROPWAT, which we incorporated in our own model gives 150 days worth of output, we have added two extra 10-day periods: one directly before the pollination stage and one directly after.
1. f(x) = x^1.4 / 4
2. f(x) = x^1.5 / 4
3. f(x) = x^1.5 / 4
4. f(x) = x^1.5 / 4
5. f(x) = x^1.5 / 4
6. f(x) = x^1.6 / 4
7. f(x) = x^1.7 / 4
8. f(x) = x^1.7 / 4
9. f(x) = x^1.7 / 4
10. f(x) = x^1.6 / 4
11. f(x) = x^1.6 / 4
12. f(x) = x^1.6 / 4
13. f(x) = x^1.5 / 4
(In)accuracy
While determining the formula to convert water deficit to yield losses, we immediately encountered some difficulties. First and foremost we have our model designed to handle 10-day periods, whereas yield loss is caused by consecutive days of drought. For this reason, we have made the decision that insufficient water in a period of 10 days is equivalent to 10 days of drought. This implies 4 days of drought in which no yield is lost yet, and 6 days in which yield diminishes. We have adjusted the formula in such a way that a water deficit for 10 days equals the yield losses for a 6 day drought in the corresponding growth stage. Let us look at the first 10 days as an example. We first take the corresponding formula, f(x) = x^1.4 / 4. Next, we look at a relatively low water deficit of 10%. Filling in x = 10 gives f(x) = 6.27%. As explained above, this loss should be equal to 6 days worth of drought during the growth stage, which is 1% - 3% per day. This is indeed the case since 6.27/6 ≅ 1.05. If we take a more severe water shortage of 20%, the formula gives a yield loss of 2.76% per day. This daily loss will increase more rapidly as the available water decreases.
The value of e varies slightly depending on growth stage, but the rate at which this e increases and decreases remains estimated by us. The value of e is based on the crop water requirements for green maize[97], adjusted to our planting date.

We acknowledge that even though a fairly accurate approximation can be made with the formula, we do not take into account the daily water distribution over a series of 10 days. As can be seen in the graph to the right, watering daily gives a higher Kc value than watering once every 10 days. Since a higher Kc value means more water evaporates and transpires, the effective water for the crop is reduced, which would cause more loss in yield.
Another inaccuracy lies within the method we define our 10-day periods. The periods are fixed, i.e. independent of the precipitation over the course of the total 130 day period. This causes an issue whenever 2 consecutive 10-day periods occur. In the first 10-day period, yield losses will begin to affect yield only after those 4 days so we can ignore these initial 4 days, whereas the second 10-day period is preceded by more than 4 days of drought so we should not ignore the first 4 days of the second period. However, we view each 10-day cycle individually and could therefore underestimate yield losses. In an attempt to compensate this, we have intentionally slightly overestimated yield losses at higher water deficiencies.
Model
To reason with more precision about the size of the canvas or the volume of the tank, a model is made. The model consist of three parts. The first part is setting up the model, inserting values in the model, recalculating some values to work for a time period of 10 days and some more setup related methods. The second part of the model are the simulations. The simulation runs 10 different scenarios. These scenarios will try to represented the droughts that the country might have, some drought will spread for several months, some droughts will be short but severe. For every scenario different sizes of canvas and different volumes of the water tank are tested. The different outcomes will be saved and added up. The last part of the model consist of portraying the outcomes of the scenario’s. All the outcomes of the model will be displayed in a table, where the most wanted scenarios will be highlighted and examined in more detail. We will discuss the different steps of the model in more detail below.
Setup
The setup consists of initializing some well defined variables, initializing the rainfall and initializing the water needed to hydrade the plants. Before any calculations can be made, assumptions must be made. The following variables are used within the model;
- StartingMonth: being the month in which the simulations starts.
- sizeOfField: being the size of the field over which we apply calculations, this field is around the average of small-based farmers.
- nrSimulations: The amount of simulations you perform, being 10 in our case.
- plantsPerHectare: The amount of plants that grow on one hectare.
- minTotalStorage: The least volume that will be tested
- maxTotalStorage: The maximum volume that will be tested
- stepTotalStorage: The increment for the storage space that will be used.
- minSizeOfCanvas: The minumum size of the canvas
- maxSizeOfCanvas: the maximum size of the canvas
- stepSizeOfCanvas: The increment for the canvas size that will be used.
Next to those variables we have a couple of methods to determine the rainfall. First we have a method that simply adds all the rainfall in a month to an array. The next method we use is the calculateTo10dayly method, this method recalculates the rain that falls from rain per month to rain per week. Between these method is also a method available to add some drought, this was for the initial estimations for the drought. The last thing that will be done in the setup is calculate how much rain
Simulations
For the simulations we run 10 different simulations. Within all the simulation the weather will be changed from the agregated rainfall. This is done to simulate real weather in these countries. For every scenario different sizes of canvas will be tested. For every size of canvas different sizes of the tank will be tested. The canvasses tested range from a size of 0 square meter till 100 square meter. The volume of the tank ranges from 500 Liter till 10000 Liter. The incrementation of the canvas is 2 meter per step. The incrementation is 500 Liter per step. This was done to optimize the result as much as possible.
Scenario
To make the simulation more real life we decided to implement some diffent scenario’s and test the different sizes and volumes in the diffent scenario. The scenario’s are partly based on real life data, partially based on our own intuition. The scenario’s will be discussed below.
simulation of drought
As described in the state of the art, drought is a loosely defined term. By the meteorological definition of the word, drought is a lower amount of precipitation than usual for a prolonged period of time. Since simulation by a mathematical model requires exact inputs, the period of time and the degree to which it is lower than usual have to be expressed in numerical values.
The standardized precipitation index (SPI) expresses the deviation from the average amount of precipitation in an amount of standard deviations. It basically is an application of the standard score from probability theory, which is given by the equation
Z = (x - μ)/(σ) ,
where Z is the standard score, x is the random variable or sample, μ is the mean of the samples and σ is the standard deviation. By filling this formula in with meteorological terms, one finds the SPI:
SPI = (xi - μ)/(σ) ,
where xi is the sampled periodic precipitation, μ is the periodic mean and σ is the standard deviation calculated from samples compared to the periodic mean [79].
The SPI indexes were calculated for the same place (Kang, Botswana) for several periods of time (Keitumetse, 2016). In the figure below, the SPI index is shown for a period of 3 months on the left and 6 months on the right [79].
What stands out is that although the graphs tend to have the same shape, they differ slightly. This is expected, as drought is unpredictable so there is no correlation between the first 3 and the last 3 months of sampling. Since the data is presented with a period in which samples are taken of at least 3 months, for the inputs of our model it is assumed that the 3 month data also applies to a period of 1 month. This means that the slight differences between the 3 month and the 6 month period SPIs are also expected when using the 3 month data to model a period of at most 1 month. These discrepancies fall under the estimation error.
As shown in the table below, there are different categories of drought based on the SPI [80]. For a periodic moisture deficit to be considered a drought, an SPI of at most -0.8 is needed.
Now the droughts can be modeled by multiplying the SPI index from data collected from the past with the standard deviation. The standard deviation is calculated by using rainfall data for the random variable X and applying the equation:
where N is the number of data inputs and μ is calculated by
By applying this method, the mean is found to be 52.57 and the standard deviation 23.63, both expressed in millimeters of precipitation. This is based on monthly precipitation amounts of 23, 40, 48, 79, 73, 82, 23, for the months october until april respectively [86].
Portraying
For every simulation the program will determine if the simulation passed (meaning there was enough water in enough simulations) or failed (vice versa). If the simulation passed the test the box in the table will appear green and the text true will be portrayed. If the simulation for certain values failed the box will be red and the simulation will say passed. For some of the best solutions (being the solutions that are true, and for which one lower value will result in a false) some extra data such as maximum amount in storage will be portrayed to give a better view of the possibilities. Using this model we can find the best possible size of the canvas and volume of the tank. This will ensure a great balance between costs and revenue.
Scenarios
The design of an automatic rainwater collection and irrigation system is subject to the exact situation of the users it is aimed to help. The artifact should act as a water reserve when drought strikes, but it is prone to a lack of funding. Therefore, it can be seen as an optimization problem. It is desired to maximize the amount of water it collects to allow more certainty in the available water reserves, while the cost should be minimized, since the projected users are poor small-scale farmers. One can identify different scenarios which require a different version of the technology.
Sufficient money is available
Botswana imports around 80% of its food [47]. According to data presented by the World Bank in 2017, this accounts for 6.98% of all imports[85]. This is approximately 500 million us dollars. If the government were to decide that they invest some of this money in their own food production, then there might be subsidies available for small-scale farmers. This money could be invested in the technology. This could allow the lower poverty rates and decrease its dependency on other countries for food.
Another way in which money could be available to small-scale farmers, is through charities or the United Nations. The technology would allow these farmers to become more independent which also benefits the poor villages around them. This means that it is a one time investment instead of sending of goods repeatedly. This could be a valuable investment. (Give a man a fish and you have fed him for a day. Teach him how to fish and you have fed him for a lifetime).
The pay model of the technology could be adapted to the farmers
The current financial situation of small-scale farmers does not allow a lot of room for expensive equipment. Therefore, the payment model could be adapted to fit their situation. No small-scale farmer in Botswana will have the money saved to buy an expensive system. Therefore, the product could be paid back in terms. As the product should help the farmer to secure his crops in a drought, the farmer will notice this in his profit. If the farmer earns more because of the product, then the farmer could use this money to pay for the product in terms.
There are drawbacks to this approach, however, since the farmer will have to take some risks. A financial risk is being in debt when the system does not prove itself to work, or if a drought longer than the system can handle occurs. Another risk is that the farmer needs to produce more in order to pay for the product, without having certainty of the product being helpful. In this case the technology should be adapted to how much risk the farmer is willing to take.
Insufficient money is available
If there is no external aid available for the farmer, then it is not likely that he will have the money to invest in the technology. While an arrangement is possible where the technology is paid for in terms by the increased profit that technology yields, the farmer might not be willing to take such a risk, since there are no certainties. If this is the case, then only the cheapest solution might be an option. If even the cheapest edition of the technology is not an option, then the farmer will not be interested.
Component selection per scenario:
Each scenario will require a different approach to how the goal of a higher yield will be accomplished. This approach will differ per scenario in terms of the system components which are used. These will be adjusted for the amount of money which is available in each scenario. To make a decision which component to use, they will be compared per scenario. The components which will be considered are the soil moisture level measuring sensors, the water storage tank, the irrigation system and the water catchment system.
Component selection scenario 1 (Sufficient money is available)
In this scenario the goal is the optimization of water usage, with little regard to the optimization of cost. For the optimization of water usage, the use of a soil moisture level sensor is essential. This would lets the system know exactly how much water to deliver to the crops. The Gro-Point mentioned earlier seems the best choice for this type of scenario. It is more expensive ($300) then the aforementioned cut-off sensor ($90) but makes up for it since it has a larger measurement volume. Furthermore, the Gro-Point does not give a discrete value like the cut-off sensor. This gives it the advantage over the cut-off sensor since it can more precisely say how much water is needed.
The type of irrigation also plays a large role in the optimization of water usage. The best type of irrigation would be a system which delivers water directly to the plant with the least amount of water lost. To make sure that the water loss is minimized the water should directly be delivered to the roots of the plant. Furthermore, the amount of water which is delivered to the roots of the plant has to be controllable. This is necessary since otherwise the excess water would run away in the ground. These requirements can be met with a subsurface drip irrigation system in combination with a pump and which is linked with the sensors. The sensors would be able to determine how much water is located in the soil. This information is then send to the system which determines how much water the pump should send through this subsurface drip irrigation system. To be sure the water goes exactly to spot where the sensor is saying water is needed, automated valves could be used. These valves could guide the water through the irrigation system to the spot of soil where the water is needed. This would lower the excessive water use as no water is wasted on soil which already has enough water. The cost of the automated valves will be around $50 per valve [81].
The type of storage tank that should be used in this scenario should have a high volume and should be of high quality. A volume of 50.000 liters should be enough to absorb any surplus. As a material galvanized steel should be used. By using this material the storage tank has a 40% safety margin, which means it can hold 40% more than the tanks actual volume and there will little to no rust. To make sure the water stays clean the tank should have a strainer on both the input and the output side. In total this tank will cost around $4.600. The storage tank will contain a submersible pump that can pump a volume of at least 10000 liters per hour and it is connected to the soil moisture sensors to make sure water is only provided when needed. This pump will cost around $100. The estimated power use of this system will be around 2,5 kWh. Consisting of 220 Wh for 20 sensors, 5 Wh for the 10 servos of the valves and 2.2 kWh hour for the pump. In the case no electricity is available a solar panel can be included for around $4200 [82]
To make sure as much rainwater as possible is caught, the canvas should have a big surface and should be of high quality to keep the chance of damages as low as possible. A surface of 10x12m will for example be able to catch 600 liters of water when 5mm of rain falls.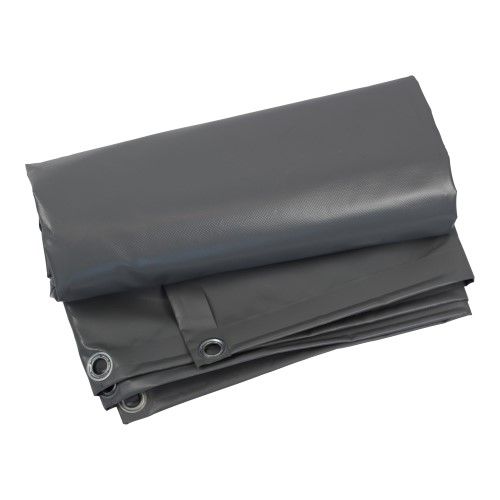
Component selection scenario 2 (The pay model of the technology could be adapted to the farmers)
In this scenario the goal is to optimize both the water usage and the cost. The system components should thus be compared to the water optimization potential whilst also looking at the cost. For the soil moisture level sensor, the cut-off sensor seems like the best option. This kind of sensor does loose some functionality over the aforementioned Gro-point, however it is also substantially cheaper ($90). If no electricity is available for the sensor a solar panel can be included. The electricity needed to run the sensors will be around 220 wH. The cost of a solar panel for this amount would be around $300 [83]
For the type of irrigation system surface drip irrigation with a manual pump may be the best solution. This has the advantage that it can still deliver water in a somewhat controllable fashion and is cheaper to maintain. Less maintenance is required since the pipes are not placed underground and thus have a much smaller likelihood of getting clogged. It also is cheaper as the pipes do not have to be replaced as much as subsurface pipes. This kind of subsurface pipes have the disadvantages that they are more prone to damage by the roots of the plant and thus have a higher cost. The use of less precise sensors go well with the combination of the manual pump. Since the sensor cannot say precisely how much water is needed, only if there is enough, a manual pump may be better. The farmer can keep pumping until the system gets a signal from the sensor that it has enough water. The cost of a manual treadle pump will be around $100 [84]
Furthermore, manual valves could be installed in this system. This could have the benefit that the farmer can close off any part of the irrigation system as he sees fit. If the farmer gets feedback from the systems or thinks there is already enough water in the soil, incorporating these valves could reduce the excessive water use. The cost of a single manual valve would be around $8 [81]
The best solution to store the water in this scenario is to take a smaller storage tank, namely one of 10.000 liters. This one will still be able to deal with most of the surpluses. The tank will also not be galvanized, since this reduces the costs significantly, and it will only have one strainer. In this way the costs will be reduced, but the water will still be kept clean. The total costs for this tank will cost around $1.300.
To make sure as much water as possible is caught, but the costs should also be optimized, the size of the canvas will be the same, so 10x12m, but another material will be used, namely LDPE coating, this material is much cheaper than PVC coating, but the quality is lower. This material can hold 100gr per m2, so the chance that it gets damaged is much higher. The costs of this canvas will be around $60. The canvas will also have a v shape to make sure the water will flow to the lowest point of the canvas where it will be collected in a small open tank. This tank will contain a submersible pump to move the water to the storage tank, but this will be a small submersible pump, which can pump max 2000 liters per hour and will costs around $70.
Component selection scenario 3 (Insufficient money is available)
In this scenario the cost of the system should be optimized as much as possible, whilst still delivering some improvement on the water usage. Since the cost of the system should be as low as possible, a choice can be made between no sensor or just one cut-off sensor. In the case that no sensor is purchased, different options are available. The farmer could guess when the plants need water, or the system would be put on a timer. In the other case the one sensor could be used as a indicator for the whole farm.
For the best type of irrigation a system such as used in Kenya would probably be the best pick. This system works by irrigating with the use of gravity and a simple plastic perforated tube as is explained earlier. This has the advantage that it is relatively cheap, does not require any kind of pump and is easy to maintain. However, it has the disadvantage that it is hard to use when the farm is sloped. In this case manual valves are optional, just as the sensor. The choice of a valve is completely up to the needs of the specific farmer. If it is highly beneficial to have the these valves installed, the farmer could always include this in the system, as it is not a essential part for the system to work.
To optimize the costs for the storage of the water, only a tank with a volume of 1000 liters will be used. There will be no strainer since this would cost too much. The material of the tank will be plastic. The advantage of this material is that is very cheap, the disadvantage is that it is very prone to damage. The total costs of this tank will be around $150.
To make sure the costs are optimized for catching the water the canvas will be setup above the tank. The lowest point of the canvas will be a hole in the middle of the canvas, which will be the point that is above the input point of the storage tank. In this way there is no pump and connection needed between the canvas an storage tank, because the water will directly flow from the canvas into the storage tank. This will reduce the costs significantly, but it also has a disadvantage, namely that there will be a small part of the storage tank that is always open, which will make some part of the water inside to evaporate. The size of the canvas will also be smaller, namely 4x6m and the material will be LDPE coating, all to reduce the costs as much as possible. The costs of this canvas are around $40.
System design per scenario
Since there are three different scenarios, three different systems need to be designed. These systems will have the same 4 concepts, namely: catching, maintaining and distributing water and the connection and control of these parts. In the way these concepts are designed per system there will be differences, but also a lot of similarities.
System design scenario 1
Since in this scenario money is not the problem, this design will be fully focused on optimizing the catchment and use of water. In this scenario we assume electricity is available at the farm.
First up, water catchment. This will be done using a canvas. As said in the component selection this canvas will be 10x12m and is made of PVC coating.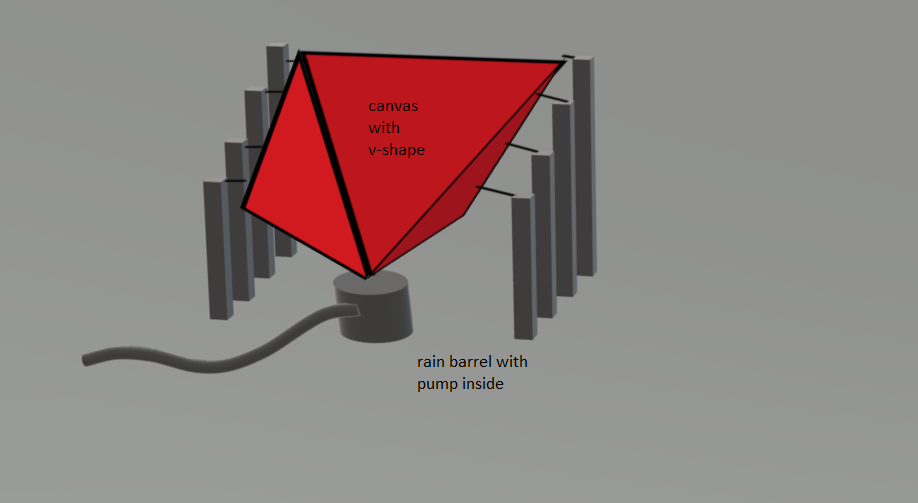
Next up, water storage. This will be done using a water storage tank. As said in the component selection this tank will have a volume of 50.000 liters and is made of galvanised steel. It has the shape of a cylinder. As soon as the pump inside of the rain barrel will start pumping water will be entering the storage tank. At the input of the storage tank there will be a strainer to make sure the water that enters the tank is clean. There will also be a strainer at the output of the tank to make sure any pollution that has taken place inside of the tank is being neutralised. At the bottom of the tank there will be a submersible pump that is connected with a hose to the output of the tank, which is on itself connected to the irrigation system again. This pump is connected to the soil moisture sensors that will give a signal to the pump when water is needed in the irrigation system. This will optimize use of water since the water is only distributed when actually needed.
For the distribution of water a subsurface drip irrigation system will be used. The output of the water storage tank is connected to the general hose of the irrigation system. This hose will then branch out into multiple smaller hoses that will lay next to the crops. To get the water straight to the root small tubes with tiny holes in them are put in the ground and connected to the hoses. A more detailed explanation of subsurface drip irrigation can be found in chapter 6.3.
To make sure the submersible pump in the water storage tank pumps water into the irrigation system at the right time, soil moisture sensors are needed. As said in the component selection the Gro-point sensor will be used for this. This sensor will be placed somewhere in the field between the crops.
System design scenario 2
In this scenario costs and optimization of use of water need to be balanced. This design will have a lot of similarities with the design of scenario 1, but it will also have its differences. In this scenario there are two different possibilities: the farm has access to electricity or not. The design will be specified for both these possibilities.
First the canvas. When electricity is available the design will basically be the same as in scenario 1, a canvas of 10x12 meters which is inclined to be able to collect the water on one side. Also the v-shape will in the canvas, the same as the rain barrel and the submersible pump. The only differences will be the material of the canvas, as said in component selection this will be made of LTPE coating which is a lot cheaper than PVC coating, and the quality of the submersible pump, this will be a pump with a lot less power.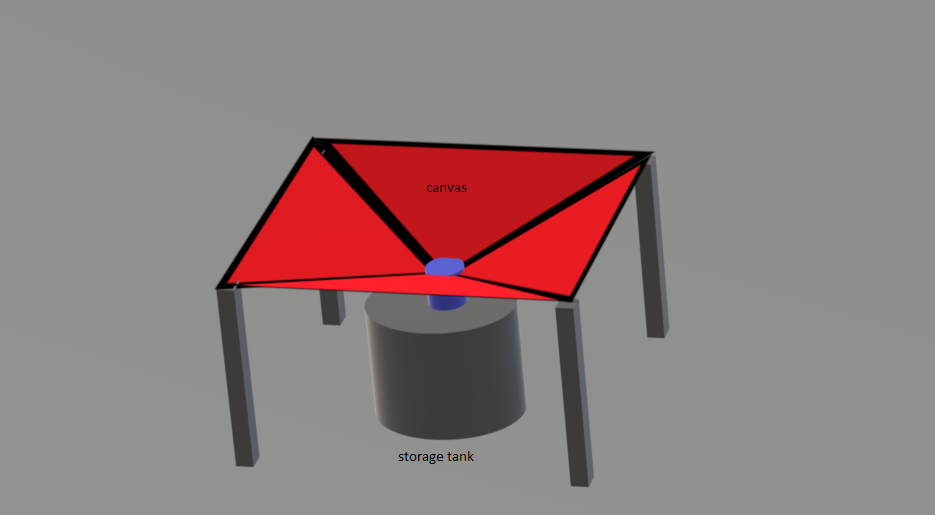
When there is no electricity available, the design will look a lot different. First of all, the canvas won’t be inclined, the lowest point will be the middle of the canvas, where there will be a hole. Underneath this hole the water storage tank will be place. At the top of the water storage tank there will also be a hole that is connected to the hole of the canvas. In this way the water that drops onto the canvas will directly be collected in the storage tank and no submersible pump is needed, but the disadvantage is that more water in the storage tank will evaporate.
The storage tank will have a volume of 10.000 liters, which is a lot smaller than the tank in scenario 1. The tank will only have one strainer, which is placed at the input of the tank. When electricity is available there will be a submersible pump inside of the tank the same as in scenario 1, but when no electricity is available this will be replaced by a manual pump.
As a irrigation system surface drip irrigation will be used, so there will still be a general hose that is connected to the output of the storage tank, that branches out into smaller hoses that lay next to the crops, but the holes that make the dripping possible will be in these smaller hoses that are above the ground instead of smaller tubes that are in the ground.
When electricity is available a soil moisture sensor will be used, namely a cut-off sensor, but when no electricity is available this unfortunately won’t be possible.
System design scenario 3
In this scenario there is no sufficient amount of money available, so the design should be focused on being as cheap as possible, but still led to improvement of water usage. This design will have some similarities with the design of scenario 2, but almost no similarities with scenario 1. In this scenario we assume there is no electricity available. The canvas will have the same design as in scenario 2 when no electricity is available. The canvas will have a hole in the middle, which is the lowest point, that is connected to a hole on top of the storage tank to make sure the water is immediately collected into the storage tank. The only difference is the surface of the canvas which will be 4x6 meters, a lot smaller than the canvas in scenario 2. As said in the component selection the material will also be LTPE coating.
As said in the component selection the storage tank will have a volume of 1000 liters and will be made of plastic. There will be no strainer inside the tank and there will also be no pump to move the water to the irrigation system, this will have to be done manually. To help the farmer there will be a valve and a hose on the output of the storage tank.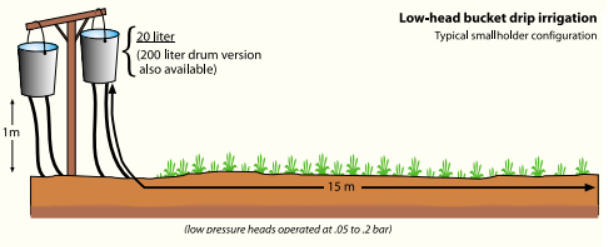
The irrigation system that is used is the low-head drip bucket irrigation. 4 buckets will be hanging on a wooden construction on a height of 1,5 meters. These buckets can be filled by the farmer itself with the hose that is connected to the output of the storage tank. To irrigate the water over the farm hoses are connected to these buckets that will branch out and lay next to the crops. In these hoses there are small holes which are close to the roots of the crops to give the plants enough water. Since the buckets are on a height of 1 meter no pump is needed since gravity will make the water through the hoses of the irrigation system.
Conclusion
Action plan
Objectives
The objective is to find a solution that improves the situation with respect to water in Africa's arid and drought-prone areas. This can be done by designing a system that collects, stores and distributes water, while closely paying attention to what the users really require. To do this, the first objective is a literature study, which is needed to provide the required knowledge. Then, the objective is to design the system based on the knowledge.
Milestones
- Summarize at least 7 scientific articles each
- Current situation sketch (SotA)
- Determine & discuss problems and possibilities for improvement
- Specify users
- Explore design posibilites
- A model to determine optimal container & canvas size
- Example scenarios
Role division & planning
The planning can be found following this link planning. In this planning The role division, or 'who will do what' section, is likely to change over time, because newly obtained knowledge can steer the project in a (slightly) different direction. There is some overlap in the tasks that are carried out, which is done on purpose to create room for discussion on the requirements. The planning will be updated every week according to the panel meeting and what needs to be done given our milestones.
Sources
- ↑ 1.0 1.1 Gujba, H., Thorne, S., Mulugetta, Y., Rai, K., & Sokona, Y. (2012, June). Financing low carbon energy access in Africa [Book, pages 71-78]. Retrieved February 13, 2019, from https://www.sciencedirect.com/science/article/pii/S0301421512002765
- ↑ Ummel, K., & Wheeler, D. (2008, December). Desert Power: The Economics of Solar Thermal Electricity for Europe, North Africa, and the Middle East. Retrieved February 13, 2019, from https://papers.ssrn.com/sol3/papers.cfm?abstract_id=1321842
- ↑ Okoruwa, V., Jabbar, M. A., & Akinwumi, J. A. (2016, April 19). Crop-Livestock Competition in the West African Derived Savanna: Application of a Multi-objective Programming Model. Retrieved February 13, 2019, from https://vtechworks.lib.vt.edu/handle/10919/65734
- ↑ Fafchamps, M., Udry, C., & Czukas, K. (1998, April 1). Drought and saving in West Africa: are livestock a buffer stock? [Journal, pages 273-305]. Retrieved February 13, 2019, from https://www.sciencedirect.com/science/article/pii/S0304387898000376
- ↑ Kay, R. N. B. (1997, December). Responses of African livestock and wild herbivores to drought [Journal, pages 683-694]. Retrieved February 13, 2019, from https://www.sciencedirect.com/science/article/pii/S0140196397902998
- ↑ Descheemaeker, K., Amede, T., & Haileslassie, A. (2010, May). Improving water productivity in mixed crop-livestock farming systems of sub-Saharan Africa [Book, pages 579-586]. Retrieved February 13, 2019, from https://www.sciencedirect.com/science/article/pii/S0378377409003424
- ↑ Canadian Society of Soil Science. (2008). Soil Sampling and Methods of Analysis (2nd ed.). Boca Raton, USA: Taylor & Francis Group, LLC. Retrieved February 13, 2019, from https://www.researchgate.net/profile/Kamal_Karim/post/Can_anyone_suggest_me_simple_protocols_for_soil_analysis/attachment/59d653e179197b80779aba47/AS%3A519479371067392%401500864941715/download/Soil+Sampling+and+Methods+of+Analysis%2C+Second+Edition.pdf
- ↑ Kalra, Y. P., & Maynard, D. G. (1991). METHODS MANUAL FOR FOREST SOIL AND PLANT ANALYSIS. Edmonton, Canada: Minister of SUpply and Services Canada. Retrieved February 13, 2019, from http://cfs.nrcan.gc.ca/pubwarehouse/pdfs/11845.pdf
- ↑ Muñoz-Carpena, R. (2004, January). Field Devices for Monitoring Soil Water Content. Retrieved February 13, 2019, from https://www.researchgate.net/profile/R_Munoz-Carpena/publication/238619241_Field_Devices_For_Monitoring_Soil_Water_Content1/links/5581630e08aed40dd8ce0f37/Field-Devices-For-Monitoring-Soil-Water-Content1.pdf
- ↑ Viscarra Rossel, R. A., Cattle, S. R., Ortega, A., & Fouad, Y. (2009, May 15). In situ measurements of soil colour, mineral composition and clay content by vis-NIR spectroscopy. Retrieved February 13, 2019, from https://www.sciencedirect.com/science/article/pii/S0016706109000408
- ↑ Widmer, F., Fliessbach, A., Laczkó, E., Schulze-Aurich, J., & Zeyer, J. (2001, June). Assessing soil biological characteristics: a comparison of bulk soil community DNA-, PFLA-, and Biologtm_analyses [Book, pages 1029-1036]. Retrieved February 13, 2019, from https://www.sciencedirect.com/science/article/pii/S0038071701000062
- ↑ Kizito, F., Campbell, C. S., Campbell, G. S., Cobos, D. R., Teare, B. L., Carter, B., & Hopmans, J. W. (2008, May 15). Frequency, electrical conductivity and temperature analysis of a low-cost capacitance soil moisture sensor [Book, pages 367-378]. Retrieved February 13, 2019, from https://www.sciencedirect.com/science/article/pii/S0022169408000462
- ↑ Pedersen, S. M., Fountas, S., Have, H., & Blackmore, B. S. (2006, July 27). Agricultural robots—system analysis and economic feasibility. Retrieved February 13, 2019, from https://link.springer.com/article/10.1007%2Fs11119-006-9014-9
- ↑ THE WORLD BANK. (2017, December 2). Agriculture in Africa: Telling Facts from Myths. Retrieved February 13, 2019, from http://www.worldbank.org/en/programs/africa-myths-and-facts
- ↑ Brouwers, J., Fussell, L. K., & Herrmann, L. (1993, July). Soil and crop growth micro-variability in the West African semi-arid tropics: a possible risk-reducing factor for subsistence farmers [Book, pages 229-238]. Retrieved February 13, 2019, from https://ac.els-cdn.com/016788099390073X/1-s2.0-016788099390073X-main.pdf?_tid=f2ea4388-c466-40f8-b80b-0b5e1b36d830
- ↑ 16.0 16.1 Binswanger, H., & Pingali, P. (1988, January). Technological Priorities for Farming in Sub-Saharan Africa. Retrieved February 13, 2019, from http://citeseerx.ist.psu.edu/viewdoc/download?doi=10.1.1.867.372&rep=rep1&type=pdf
- ↑ 17.0 17.1 Dinham, B. (2003). Growing vegetables in developing countries for local urban populations and export markets: problems confronting small-scale producers. Retrieved February 13, 2019, from https://onlinelibrary.wiley.com/doi/epdf/10.1002/ps.654
- ↑ Glover, D., Sumberg, J., & A. Andersson, J. (2016). The adoption problem; or why we still understand so little about technological change in African agriculture [Book, pages 3-6]. Retrieved February 13, 2019, from https://journals.sagepub.com/action/cookieAbsent
- ↑ 19.0 19.1 Deichmann, U., Goyal, A., & Mishra, D. (n.d.). Will Digital Technologies Transform Agriculture in Developing Countries? Retrieved February 13, 2019, from https://elibrary.worldbank.org/action/cookieAbsent
- ↑ Chetan Dwarkani, M., Ganesh Ram, R., Jagannathan, S., & Priyatharsini, R. (2015, July 1). Smart farming system using sensors for agricultural task automation [Conference publication]. Retrieved February 13, 2019, from https://ieeexplore.ieee.org/abstract/document/7358530
- ↑ Ivanov, S., Bhargava, K., & Donnelly, W. (2015, July 14). Precision Farming: Sensor Analytics - [Journal]. Retrieved February 13, 2019, from https://ieeexplore.ieee.org/abstract/document/7156034
- ↑ Kamelia, L. (2018). Implementation of Automation System for Humidity Monitoring and Irrigation System. Retrieved February 13, 2019, from https://iopscience.iop.org/article/10.1088/1757-899X/288/1/012092/pdf
- ↑ Doorenbos, J., & Kassam, A. H. (1979). Yield response to water. Irrigation and drainage paper, 33, 257.
- ↑ 24.0 24.1 24.2 Wang, H., Wang, T., Zhang, B., Li, F., Toure, B., Omosa, I., . . . Pradhan, M. (2013, September 30). Water and Wastewater Treatment in AFrica- Current Practices and Challenges. Retrieved February 13, 2019, from https://onlinelibrary.wiley.com/doi/full/10.1002/clen.201300208
[4] Binswanger, H., & Pingali, P. (1988, January). Technological Priorities for Farming in Sub-Saharan Africa. Retrieved February 13, 2019, from http://citeseerx.ist.psu.edu/viewdoc/download?doi=10.1.1.867.372&rep=rep1&type=pdf
[5] Brouwers, J., Fussell, L. K., & Herrmann, L. (1993, July). Soil and crop growth micro-variability in the West African semi-arid tropics: a possible risk-reducing factor for subsistence farmers [Book, pages 229-238]. Retrieved February 13, 2019, from https://ac.els-cdn.com/016788099390073X/1-s2.0-016788099390073X-main.pdf?_tid=f2ea4388-c466-40f8-b80b-0b5e1b36d830
[6] Canadian Society of Soil Science. (2008). Soil Sampling and Methods of Analysis (2nd ed.). Boca Raton, USA: Taylor & Francis Group, LLC. Retrieved February 13, 2019, from https://www.researchgate.net/profile/Kamal_Karim/post/Can_anyone_suggest_me_simple_protocols_for_soil_analysis/attachment/59d653e179197b80779aba47/AS%3A519479371067392%401500864941715/download/Soil+Sampling+and+Methods+of+Analysis%2C+Second+Edition.pdf
[7] Chetan Dwarkani, M., Ganesh Ram, R., Jagannathan, S., & Priyatharsini, R. (2015, July 1). Smart farming system using sensors for agricultural task automation [Conference publication]. Retrieved February 13, 2019, from https://ieeexplore.ieee.org/abstract/document/7358530
[9] Deichmann, U., Goyal, A., & Mishra, D. (n.d.). Will Digital Technologies Transform Agriculture in Developing Countries? Retrieved February 13, 2019, from https://elibrary.worldbank.org/action/cookieAbsent
[10] Descheemaeker, K., Amede, T., & Haileslassie, A. (2010, May). Improving water productivity in mixed crop-livestock farming systems of sub-Saharan Africa [Book, pages 579-586]. Retrieved February 13, 2019, from https://www.sciencedirect.com/science/article/pii/S0378377409003424
[12] Dinham, B. (2003). Growing vegetables in developing countries for local urban populations and export markets: problems confronting small-scale producers. Retrieved February 13, 2019, from https://onlinelibrary.wiley.com/doi/epdf/10.1002/ps.654
[13] Fafchamps, M., Udry, C., & Czukas, K. (1998, April 1). Drought and saving in West Africa: are livestock a buffer stock? [Journal, pages 273-305]. Retrieved February 13, 2019, from https://www.sciencedirect.com/science/article/pii/S0304387898000376
[14] Glover, D., Sumberg, J., & A. Andersson, J. (2016). The adoption problem; or why we still understand so little about technological change in African agriculture [Book, pages 3-6]. Retrieved February 13, 2019, from https://journals.sagepub.com/action/cookieAbsent
[15] Gujba, H., Thorne, S., Mulugetta, Y., Rai, K., & Sokona, Y. (2012, June). Financing low carbon energy access in Africa [Book, pages 71-78]. Retrieved February 13, 2019, from https://www.sciencedirect.com/science/article/pii/S0301421512002765
[16] Ivanov, S., Bhargava, K., & Donnelly, W. (2015, July 14). Precision Farming: Sensor Analytics - [Journal]. Retrieved February 13, 2019, from https://ieeexplore.ieee.org/abstract/document/7156034
[17] Kalra, Y. P., & Maynard, D. G. (1991). METHODS MANUAL FOR FOREST SOIL AND PLANT ANALYSIS. Edmonton, Canada: Minister of SUpply and Services Canada. Retrieved February 13, 2019, from http://cfs.nrcan.gc.ca/pubwarehouse/pdfs/11845.pdf
[18] Kamelia, L. (2018). Implementation of Automation System for Humidity Monitoring and Irrigation System. Retrieved February 13, 2019, from https://iopscience.iop.org/article/10.1088/1757-899X/288/1/012092/pdf
[19] Kay, R. N. B. (1997, December). Responses of African livestock and wild herbivores to drought [Journal, pages 683-694]. Retrieved February 13, 2019, from https://www.sciencedirect.com/science/article/pii/S0140196397902998
[20] Kizito, F., Campbell, C. S., Campbell, G. S., Cobos, D. R., Teare, B. L., Carter, B., & Hopmans, J. W. (2008, May 15). Frequency, electrical conductivity and temperature analysis of a low-cost capacitance soil moisture sensor [Book, pages 367-378]. Retrieved February 13, 2019, from https://www.sciencedirect.com/science/article/pii/S0022169408000462
[24] Muñoz-Carpena, R. (2004, January). Field Devices for Monitoring Soil Water Content. Retrieved February 13, 2019, from https://www.researchgate.net/profile/R_Munoz-Carpena/publication/238619241_Field_Devices_For_Monitoring_Soil_Water_Content1/links/5581630e08aed40dd8ce0f37/Field-Devices-For-Monitoring-Soil-Water-Content1.pdf
[25] Okoruwa, V., Jabbar, M. A., & Akinwumi, J. A. (2016, April 19). Crop-Livestock Competition in the West African Derived Savanna: Application of a Multi-objective Programming Model. Retrieved February 13, 2019, from https://vtechworks.lib.vt.edu/handle/10919/65734
[26] Pedersen, S. M., Fountas, S., Have, H., & Blackmore, B. S. (2006, July 27). Agricultural robots—system analysis and economic feasibility. Retrieved February 13, 2019, from https://link.springer.com/article/10.1007%2Fs11119-006-9014-9
[31] THE WORLD BANK. (2017, December 2). Agriculture in Africa: Telling Facts from Myths. Retrieved February 13, 2019, from http://www.worldbank.org/en/programs/africa-myths-and-facts
[32] Ummel, K., & Wheeler, D. (2008, December). Desert Power: The Economics of Solar Thermal Electricity for Europe, North Africa, and the Middle East. Retrieved February 13, 2019, from https://papers.ssrn.com/sol3/papers.cfm?abstract_id=1321842
[33] Viscarra Rossel, R. A., Cattle, S. R., Ortega, A., & Fouad, Y. (2009, May 15). In situ measurements of soil colour, mineral composition and clay content by vis-NIR spectroscopy. Retrieved February 13, 2019, from https://www.sciencedirect.com/science/article/pii/S0016706109000408
[34] Wang, H., Wang, T., Zhang, B., Li, F., Toure, B., Omosa, I., . . . Pradhan, M. (2013, September 30). Water and Wastewater Treatment in AFrica- Current Practices and Challenges. Retrieved February 13, 2019, from https://onlinelibrary.wiley.com/doi/full/10.1002/clen.201300208
[35] Widmer, F., Fliessbach, A., Laczkó, E., Schulze-Aurich, J., & Zeyer, J. (2001, June). Assessing soil biological characteristics: a comparison of bulk soil community DNA-, PFLA-, and Biologtm_analyses [Book, pages 1029-1036]. Retrieved February 13, 2019, from https://www.sciencedirect.com/science/article/pii/S0038071701000062
[36]: Doorenbos, J., & Kassam, A. H. (1979). Yield response to water. Irrigation and drainage paper, 33, 257.
[37]: Bláha, L., Babica, P., & Maršálek, B. (2009). Toxins produced in cyanobacterial water blooms-toxicity and risks. Interdisciplinary toxicology, 2(2), 36-41.
[38]:Bhattarai, S. P., Huber, S., & Midmore, D. J. (2004). Aerated subsurface irrigation water gives growth and yield benefits to zucchini, vegetable soybean and cotton in heavy clay soils. Annals of applied biology, 144(3), 285-298.
[39]:Armstrong, W., & Boatman, D. J. (1967). Some field observations relating the growth of bog plants to conditions of soil aeration. The Journal of Ecology, 101-110.
[40]:Hook, D. D., Langdon, O. G., Stubbs, J., & Brown, C. L. (1970). Effect of Water Regimes on the Survival, Growth, and Morphology of Tupelo Seedlings1. Forest Science, 16(3), 304-311.
[41]: Friedlander, L., Tal, A., & Lazarovitch, N. (2013). Technical considerations affecting adoption of drip irrigation in sub-Saharan Africa. Agricultural water management, 126, 125-132.
[42]: Vossen, P. (1988). Agricultural and Forest Meteorology (4th ed.). [Pages 369-382]. Retrieved from https://www.sciencedirect.com/science/article/pii/0168192388900445
[43]: Valentine, T. (1993). World Development. [Pages 109-126] Retrieved from https://www.sciencedirect.com/science/article/pii/0305750X93901405
[44]: Keshavarz, M., Karami, E., & Kamgare-Haghighi, A. (2010). A Typology of Farmers Drought Management. Retrieved February 23, 2019, from https://www.researchgate.net/profile/Marzieh_Keshavarz2/publication/267997549_A_Typology_of_Farmers'_Drought_Management/links/54b6356f0cf28ebe92e7b889.pdf
[45] Ministry of Agriculture Department of Research, Statistics and Policy Development. (2016). Annual Agricultural Survey Report 2014. Retrieved from http://www.statsbots.org.bw/sites/default/files/publications/Annual%20Agriculture%20Survey%20%202014.pdf
[46] Fako, T., & Molamu, L. (1995). The Seven-Year Drought, Household Food Security and Vulnerable Groups in Botswana. African e-Journals, , 48–70. Retrieved from https://pdfs.semanticscholar.org/d26d/62734b7c26f1a39f65f54aba475be1aa159d.pdf
[47] Fosu, A. (2013). Achieving Development Success (Rev. ed.). Retrieved from https://books.google.nl/books?hl=nl&lr=&id=FVtoAgAAQBAJ&oi=fnd&pg=PA187&dq=botswana+success+&ots=mSgfG3W90M&sig=RlL3ONuuhtzRCDtGb2sMzT53Jko#v=onepage&q&f=false
[48]: Lee, M. D., & Visscher, J. T. (1990). Water harvesting in five African countries. Occasional Paper Series. International Water and Sanitation Centre, (14). https://www.ircwash.org/sites/default/files/213.1-90WA-7744.pdf
[49]: Boelee, E., Yohannes, M., Poda, J. N., McCartney, M., Cecchi, P., Kibret, S., ... & Laamrani, H. (2013). Options for water storage and rainwater harvesting to improve health and resilience against climate change in Africa. Regional Environmental Change, 13(3), 509-519. https://link.springer.com/content/pdf/10.1007%2Fs10113-012-0287-4.pdf
[50]: Kahinda, J. M. M., Taigbenu, A. E., & Boroto, J. R. (2007). Domestic rainwater harvesting to improve water supply in rural South Africa. Physics and Chemistry of the Earth, Parts A/B/C, 32(15-18), 1050-1057. https://www.sciencedirect.com/science/article/pii/S1474706507000915
[51]: Biazin, B., Sterk, G., Temesgen, M., Abdulkedir, A., & Stroosnijder, L. (2012). Rainwater harvesting and management in rainfed agricultural systems in sub-Saharan Africa–a review. Physics and Chemistry of the Earth, Parts A/B/C, 47, 139-151. https://www.sciencedirect.com/science/article/pii/S147470651100235X
[52]: Hatibu, N., Mutabazi, K., Senkondo, E. M., & Msangi, A. S. K. (2006). Economics of rainwater harvesting for crop enterprises in semi-arid areas of East Africa. Agricultural Water Management, 80(1-3), 74-86. https://www.sciencedirect.com/science/article/pii/S0378377405002908
[53]: Mati, B., De Bock, T., Malesu, M., Khaka, E., Oduor, A., Meshack, M., & Oduor, V. (2006). Mapping the potential of rainwater harvesting technologies in Africa. A GIS overview on development domains for the continent and ten selected countries. Technical Manual, 6, 126. http://www.worldagroforestry.org/downloads/Publications/PDFS/MN15297.pdf
[54]: Shah, T., Verma, S., & Pavelic, P. (2013). Understanding smallholder irrigation in Sub-Saharan Africa: results of a sample survey from nine countries. Water international, 38(6), 809-826. https://www.tandfonline.com/doi/pdf/10.1080/02508060.2013.843843?needAccess=true
[55]: Inocencio, A. B. (2007). Costs and performance of irrigation projects: A comparison of sub-Saharan Africa and other developing regions (Vol. 109). IWMI. https://books.google.nl/books?hl=nl&lr=&id=BaderNusSmEC&oi=fnd&pg=PR4&dq=types+of+irrigation+africa&ots=vpEDE1pkSE&sig=tjjTD5euaqJ0Fuijmp3YH7DsaVg#v=onepage&q=types%20of%20irrigation%20africa&f=true
[56]:Charlesworth, P. (2005). Soil water monitoring. Irrigation Insights, (1). http://citeseerx.ist.psu.edu/viewdoc/download?doi=10.1.1.118.567&rep=rep1&type=pdf
[57]:Danert, K., Carter, R. C., Adekile, D., & MacDonald, A. (2009). Cost-effective boreholes in sub-Saharan Africa. http://nora.nerc.ac.uk/id/eprint/9185/1/CEB%20Danert%20Draft%204%20UNESCO%2022%20April09.pdf
[58]: Water Wells for Africa. (2008) What's The Cost. https://waterwellsforafrica.org/whats-the-cost/
[59]: New Hampshire Department of Environmental Services (2010). Recommended Minimum Water Supply Capacity for Private Wells https://www.des.nh.gov/organization/commissioner/pip/factsheets/dwgb/documents/dwgb-1-8.pdf
[60]:Frenken, K. (Ed.). (2005). Irrigation in Africa in figures: AQUASTAT Survey, 2005 (Vol. 29). Food & Agriculture Org. http://www.fao.org/nr/water/aquastat/countries_regions/BWA/BWA-CP_eng.pdf
[61]:From the World Bank collection of development indicators, compiled from officially recognized sources. https://tradingeconomics.com/botswana/cereal-yield-kg-per-hectare-wb-data.html
[62]:Botswana, S. (2015). Annual agricultural survey report 2013. Gaborone, Botswana. http://www.statsbots.org.bw/sites/default/files/publications/Annual%20Agriculture%20Survey%20%202014.pdf
[63]:From the World Bank collection of development indicators, compiled from officially recognized sources. https://tradingeconomics.com/botswana/arable-land-hectares-per-person-wb-data.html
[64]:APA. (2018). Botswana braces for hunger as cereal output declines. https://www.journalducameroun.com/en/botswana-braces-for-hunger-as-cereal-output-declines/
[65]:Food and Agriculture Organization (2015). Botswana - Cereal yield. https://www.indexmundi.com/facts/botswana/indicator/AG.YLD.CREL.KG
[66]:From the World Bank collection of development indicators, compiled from officially recognized sources. https://tradingeconomics.com/botswana/agricultural-irrigated-land-percent-of-total-agricultural-land-wb-data.html
[67]:Du Plessis, A. J. E., & Rowntree, K. M. (2003). Water resources in Botswana with particular reference to the savanna regions. South African Geographical Journal, 85(1), 42-49. https://www.researchgate.net/publication/29806515_Water_resources_in_Botswana_with_particular_reference_to_the_Savanna_regions
[68]:Botswana population density 2005. https://legacy.lib.utexas.edu/maps/botswana.html
[69]:Botswana, S. (2015). Annual agricultural survey report 2013. Gaborone, Botswana. http://www.statsbots.org.bw/sites/default/files/publications/Annual%20Agriculture%20Survey%20%202014.pdf
[70]: Karlberg, L., & de Vries, F. W. P. (2004). Exploring potentials and constraints of low-cost drip irrigation with saline water in sub-Saharan Africa. Physics and Chemistry of the Earth, Parts A/B/C, 29(15-18), 1035-1042.
[71] Clark, J. (2004, January). Saturated Vapor Pressure - an Introduction. Retrieved March 13, 2019, from https://www.chemguide.co.uk/physical/phaseeqia/vapourpress.html
[72] Buck, A. L. (August 1981). New Equations for Computing Water Vapor Pressure and Enhancement Factor. Journal of Applied Meteorology, volume 20, pages 1527-1532. https://doi.org/10.1175/1520-0450(1981)020<1527:NEFCVP>2.0.CO;2
[73] Ngigi, S. N., Thorne, J. N., Wawetu, D. W., & Blank, H. G. (2001). Low-cost irrigation for poverty reduction. Improving water and land resources management for food, livelihoods and nature, 2000-2001. https://pdfs.semanticscholar.org/722f/a9ea0ad789712e7a4bf8703aec7150ef7972.pdf
[74] Daryanto, S., Wang, L., & Jacinthe, P. A. (2016). Global synthesis of drought effects on maize and wheat production. PloS one, 11(5), e0156362. https://www.ncbi.nlm.nih.gov/pmc/articles/PMC4880198/
[75] Licht, M., Archontoulis, S. (2017). Influence of Drought on Corn and Soybean https://crops.extension.iastate.edu/cropnews/2017/07/influence-drought-corn-and-soybean
[76] Technology Development & Agronomy (2013). Growth Stages of corn. http://www.channel.com/agronomics/Documents/AgronomicContentPDF/GrowthStages%20GuidesChannel.pdf
[77] https://www.bookstore.ksre.ksu.edu/pubs/MF3305.pdf
[79] Keitumetse, O. (2016). Assessment of Drought Over Botswana Using Standardized Precipitation Index (SPI). Retrieved from https://www.researchgate.net/publication/313862481_ASSESSMENT_OF_DROUGHT_OVER_BOTSWANA_USING_STANDARDIZED_PRECIPITATION_INDEX_SPI
[80] Patel, N. R., Chopra, P., & Dadhwal, V. K. (2007). Analyzing spatial patterns of meteorological drought using standardized precipitation index. Meteorological Applications, 14(4), 329–336. https://doi.org/10.1002/met.33
[81] https://www.valvesonline.co.uk/solenoid-valves.html
[82] http://www.solarselections.co.uk/blog/2-5kw-solar-systems-pricing-power-output-in-the-uk
[83] https://www.renogy.com/renogy-100w-12v/starter-kit/
[84] https://wikiwater.fr/e58-low-cost-pumps-twin-treadle
[85] https://wits.worldbank.org/CountryProfile/en/BWA
[86] https://www.holiday-weather.com/gaborone/averages/
[87] https://www.sciencedirect.com/science/article/pii/S147470650400155X
[88] https://akvopedia.org/wiki/Natural_rock_catchment_and_Open_water_reservoir
[90] Joshua, W. (1991). PHYSICAL PROPERTIES OF THE SOILS OF BOTSWANA. Retrieved from http://www.fao.org/3/ar781e/ar781e.pdf
[91] Remmelzwaan, A., & Van Waveren, E. (1988). Botswana Soil Database Guidelines for Soil Profile Description. Retrieved from http://www.fao.org/3/ar717e/ar717e.pdf
[92] De Wit, P., Nachtergaele, F. (1990). Soil Mapping of the Republic of Botswana. https://esdac.jrc.ec.europa.eu/content/soil-map-republic-botswana-soil-mapping-and-advisory-services-project-faobot85011-map-1-2
[93] Saxton, K. E., & Rawls, W. J. (2006). Soil Water Characteristic Estimates by Texture and Organic Matter for Hydrologic Solutions. Soil Sci. Soc. Am. J, 70, 1569-1578. http://citeseerx.ist.psu.edu/viewdoc/download?doi=10.1.1.452.9733&rep=rep1&type=pdf
[94] de Oliveira, R. A., Ramos, M. M., & de Aquino, L. A. (2015). Irrigation Management. In Sugarcane (pp. 161-183). Academic Press. https://www.sciencedirect.com/science/article/pii/B9780128022399000086
[95] https://www.ars.usda.gov/research/software/download/?softwareid=492&modecode=80-42-05-10
[96] Tsoar, H., & Hillel, D. (2004). Sand dunes. Encyclopedia of Soils in the Environment. Elsevier, Oxford, 462-471. https://www.sciencedirect.com/science/article/pii/B0123485304004100
[97] Savva, A. P., & Frenken, K. (2002). Crop water requirements and irrigation scheduling (p. 132). Harare: FAO Sub-Regional Office for East and Southern Africa. http://www.fao.org/3/a-ai593e.pdf
[98] http://www.thematrix.it/irrigationit/lessons/lesson%206/0601%20CropWat%20printable%20version.pdf
[99] https://www.researchgate.net/publication/284300773_FAO_Irrigation_and_drainage_paper_No_56
[100] https://www.taylorfrancis.com/books/9781351536356
[101] https://ourworldindata.org/grapher/number-of-people-moderately-or-severely-food-insecure
[102] http://www.fao.org/3/I8656EN/i8656en.pdf
Not used Sources
[1] AGRA. (2017). Africa Agriculture Status Report: The Business of Smallholder Agriculture in Sub-Saharan Africa (Issue 5). Nairobi, Kenya: Alliance for a Green Revolution in Africa (AGRA). Issue No. 5. Retrieved February 13, 2019, from https://agra.org/wp-content/uploads/2017/09/Final-AASR-2017-Aug-28.pdf
[2] Bahiri, A., Drechsel, P., & Brissaud, F. (2016, September). Water reuse in Africa: challenges and opportunities. Retrieved February 13, 2019, from https://ageconsearch.umn.edu/bitstream/245271/2/H041872.pdf
[3] Beyene, A., Vuai, S., Gasana, J., & Seleshi, Y. (2015, June 11). Reliability analysis of roof rainwater harvesting systems in a semi-arid region of sub-Saharan Africa: case study of Mekelle, Ethiopia. Retrieved February 13, 2019, from https://www.tandfonline.com/doi/full/10.1080/02626667.2015.1061195
[8] Chia, H. W., Chia, H., Roordink, J., Rizviç, D., Song, M., & Gian, T. (2017). Water Transport Infrastructure. Retrieved February 13, 2019, from http://cstwiki.wtb.tue.nl/index.php?title=Water_Transport_Infrastructure
[11] De Trincheria, J., Dawit, D., Famba, S,. Filho, W., Malesu, M., Mussera, P., Ngigi, S., Niquice, C., Nyawasha, R., Oduor, A., Oguge, N., Oremo, F., Simane, B., Steenbergen, F., Wuta, M. (2017). Best practices on the use of rainwater for off-season small-scale irrigation: Fostering the replication and scaling-up of rainwater harvesting irrigation management in arid and semi-arid areas of sub-Saharan Africa. Retrieved February 13, 2019, from https://www.researchgate.net/publication/317065537
[21] Kurukulasuriya, P., & Mendelsohn, R. (2007, July). Endogenous Irrigation: The Impact of Climate Change on Farmers in Africa. Retrieved February 13, 2019, from http://documents.worldbank.org/curated/en/398301468004476471/pdf/wps4278
[22] Lal, R. (1988). Soil Quality and Agricultural Sustainability. Retrieved February 13, 2019, from https://books.google.nl/books?hl=nl&lr=&id=gyUVt8GphKYC&oi=fnd&pg=PA3&dq=farming+soil+africa&ots=nOHDwB2Mir&sig=V3vGXDyz-s2yPnuyfhvFpdZHy4k#v=onepage&q=farming%20soil%20africa&f=false
[23] Liao, M. C., Cheng, C. L., Liaw, C. H., & Chan, L. M. (2004). Study on Rooftop Rainwater Harvesting System in Existing Building of Taiwan. Retrieved February 13, 2019, from http://www.irbnet.de/daten/iconda/CIB10553.pdf
[27] Pereira, L. S., Oweis, T., & Zairi, A. (2002, December 30). Irrigation management under water scarcity [Book, pages 175-206]. Retrieved February 13, 2019, from https://www.sciencedirect.com/science/article/pii/S0378377402000756
[28] Prudencio, C. Y. (1993, December). Ring management of soils and crops in the west African semi-arid tropics: The case of the mossi farming system in Burkina Faso [Book, pages 237-264]. Retrieved February 13, 2019, from https://ac.els-cdn.com/0167880993901259/1-s2.0-0167880993901259-main.pdf?_tid=ea86c198-9a5e-46a2-9df9-52bd55770e2f
[29] Springer International Publishing AG 2018. W. Leal Filho and J. de Trincheria Gomez (eds.). (2017). Rainwater-Smart Agriculture in Arid and Semi-Arid Areas. Retrieved February 13, 2019, from https://doi.org/10.1007/978-3-319-66239-8_2
[30] Strauch, A. M., Kapust, A. R., & Jost, C. C. (2009, September). Impact of livestock management on water quality and streambank structure in a semi-arid, African ecosystem [Book, pages 795-803]. Retrieved February 13, 2019, from https://www.sciencedirect.com/science/article/pii/S0140196309000962
