0LAUK0 PRE2018 3 Group 13 User Research
Introduction
This page contains the user research performed by group 13 for the course Project Robots Everywhere (0LAUK0). Here we summarize the results of our own surveys as well as those that are available online. Using this information, we determine the desired functionality and set corresponding user requirements.
Summary
Survey results
The following survey results are taken out of the reference source and only contains information relevant to our case. As of such, in order to view the entire full survey, we recommend you to look at the reference link.
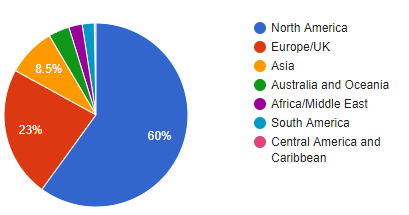
3. Screen Reader User Survey looked into the preferences of screen reader users. They have received 1792 valid responses and it was a follow-up to six previous surveys conducted between January 2009 and July 2015.
3.1 Over 95% of the responses indicate that they suffer from blindness or visual-impairment. As of such, their opinions are relevant to us.
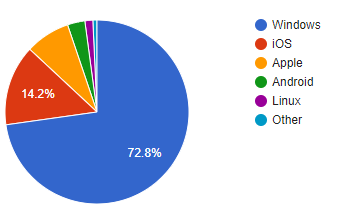
3.2 A strong majority shows that they primarily use the Windows operating system and a lot use the Apple's OS. Only a very small percentage use lesser common systems like Linux or others.
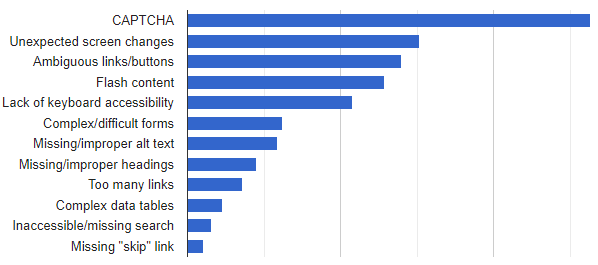
3.3 The survey asked respondents to select their most, second most and third most problematic items from a list. In giving each selected item a weighting, the following chart shows the overall rating of difficulty and frustration for each item.
Most of these items are either simply constraints to blind people or cause unexpected visual changes. Either way they relies on visual perception and create an understanding problem to blind users.
4. Braille Reader Survey Analysis 1983 by Government Studies & Systems Philadelphia is an old survey, but we mainly look at the results of reading braille on paper and their opinions which can still be applicable nowadays. There is a total of 240 responses and we summarized the result count in percentages.
4.1 Are you:
- 40% Male
- 60% Female
4.2 Age in years at your last birthday:
- 1% < 15
- 7% 15 - 24
- 38% 25-39
- 39% 40-64
- 15% > 65
4.3 Would you describe your ability to read braille as:
- 58% Excellent
- 33% Good
- 8% Fair
- 1% Poor
4.4 At what age did you begin to read braille?
- 82% < 18
- 9% 19 - 34
- 6% 35-54
- 3% > 55
4.5 In which way do you read most frequently?
- 52% Braille
- 42% Audio
4.6 If all reading material could be in the format of your choice, in which way would you prefer to read?
- 68% Braille
- 32% Audio
4.7 Do you think the quality of braille dots in press braille books is:
- 39% Excellent
- 50% Good
- 11% Satisfactory
- 0% Poor
4.8 "Thermoformed materials" are single-sided plastic copies of hand-transcribed paper masters. "Paper materials" may be single- or double-sided paper copies of braille materials. Do you find thermoformed reading materials:
- 27% Same as paper materials
- 54% Less pleasant to use than paper
- 7% More pleasant to use than paper
- 12% Have never used thermoformed materials
4.9 Some braille books are now produced on paper and some on thermoform plastic. Would you be willing to accept considerably fewer braille titles in order to have books produced only on paper?
- 16% Yes
- 64% No
- 20% It does not matter
References
Group 13 survey results
1. https://drive.google.com/file/d/1a6CgYqBcHCB3pD2HzhYHlJ-2P9snBcFE/view?usp=sharing 2. https://drive.google.com/file/d/1-KIIQkl0nYmRsft4FWjfrHaNySzV_B5I/view?usp=sharing
Online survey results
3. Screen Reader User Survey #7 Results. WebAIM, October 2017. Available at: https://webaim.org/projects/screenreadersurvey7/ 4. Braille Reader Survey Analysis. Government Studies & Systems Philadelphia, 1983. Available at: https://archive.org/details/braillereadersur00gove 5.


