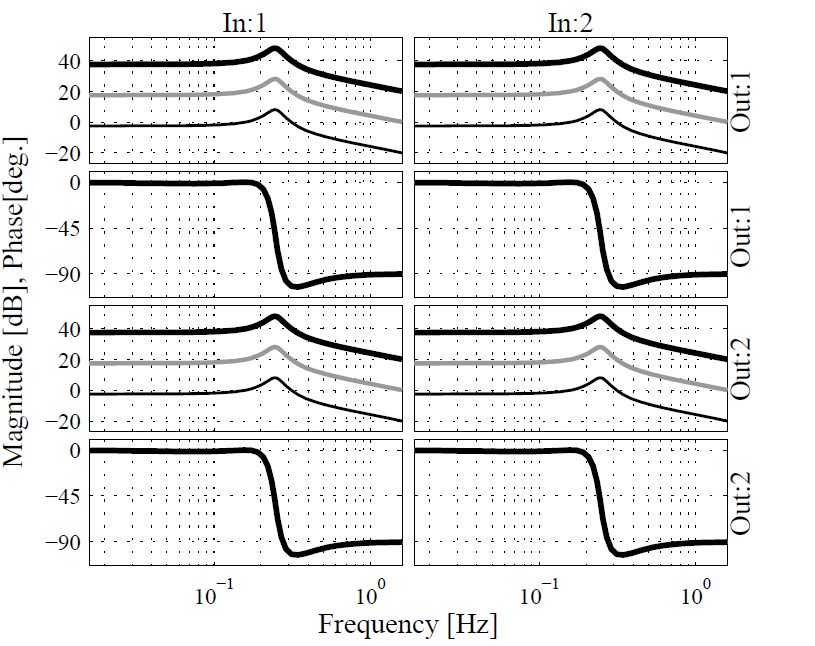
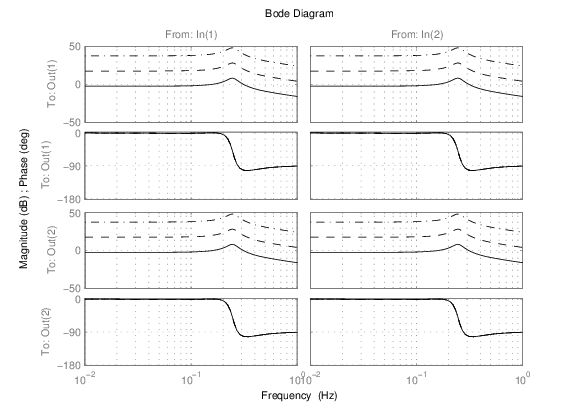
Frequency Response Function Plotting
- Files
Note: Wikipedia automatically changes the first letter of a filename to uppercase. To avoid warnings in Matlab, save the file in lowercase.
File:Frf.m, File:Frfmag.m, File:Frfphase.m
- Description
- Plot Frequency Response Function with
- Correct label sizes
- Optimized for MIMO systems
- Enable use of custom colors (lightgrey, darkgrey, pink, etc.)
- Easy to adjust limits
   Usage:   frf(sys1,'color/linetype/marker',sys2,'color/linetype/marker',...
            ...{fmin,fmax,magmin,magmax,phasemin,phasemax,wraponoff,type})

            frfmag(sys,...) and frfphase(sys,...) use the same syntax but only plot
            the magnitude or phase plot respectively

   Inputs:  You can use custom colors, e.g. lightgrey, pink, etc. (see line 180)
            example strings: 'b', 'lightgrey--*', 'orange', '-^'

            All elements in the options-struct are optional
            fmin/fmax in Hz
            magmin/magmax in dB
            phasemin/phasemax in degrees
            wraponoff: [ 'on' | 'off' (default) ]
            type: [ 'mag' | 'phase' | 'magphase' (default) ]

   Outputs: Plots the frf in the current figure.
            Note that the xticklabels might overlap the xlabel in the
            figure. In an exported pdf file they will be correct.
- Example
- frf.m vs bode.m
- Author
- Rob Hoogendijk

