PRE2017 4 Groep1
Health Warnings
Hyper- and Hypothermia Our proof of concept will use a Temperature sensor and a Galvanic skin response sensor. These two sensors can be used to warn people of a potential hypothermia or hyperthermia. When taken separately they can give an approximation of someone’s well being, mostly using averages and estimations. However, as everyone is different, for our application it is important to get a more accurate estimation of someone’s body’s state to base our warnings and actions on.
To get more accurate readings, the sensors will start with baseline measurements of the person in rest. This is to determine their average body temperature and galvanic skin response. For body temperature this is done because the range of possible base temperatures ranges on average from 36.1 to 37.2 degrees centigrade (MedLine Plus team, 2018), and a shift of one degree centigrade in either direction is already enough for a warning; if a person’s core temperature drops by 2 degree centigrade they are already experiencing a mild hypothermia (after a degree drop they experience a severe hypothermia and need medical attention). If a person’s core temperature increases by 1 to 1.5 degrees they either have a fever, or a mild case of hyperthermia. If a person’s body temperature increases by 1.5 to 3 degrees they are experiencing serious hyperthermia, and are in need of medical attention (Calvin, 2018).
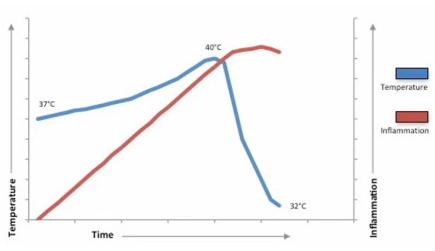
Figure 1: Accidental hypothermia in severe sepsis. The graph suggests the relationship between inflammation and temperature in severe sepsis. As inflammation increases, temperature accordingly increases. After the point of ‘critical inflammation’ core body temperature drops, this may be an adaptive response to prevent further damage mediated through inflammation.
“Accidental hypothermia” is described as the sudden drop of temperature due to environmental causes. In this figure, one can see that there is a relationship between inflammation and temperature in severe sepsis. At the intersection of the two graphs, “critical inflammation” has been reached, causing hyperthermia to turn into hypothermia. This point can be seen as the point at which the sporter is in great danger and needs medical assistance.
This would mean that a person is “safe” regarding sepsis when (s)he is between 36.1 to 40 degrees Celsius (hyperthermia). When a person hits the 40 degrees and drops down to 32 (hypothermia), one can conclude that the person is under severe sepsis. https://ugpathsoc.wordpress.com/2014/01/15/pyrogens-cryogens-and-bears-oh-my/
Even these measures are estimates based on averages however, and need to be combined with more sensor data for a more accurate warning system. People experiencing dehydration, hypothermia, or hyperthermia have a reduced galvanic skin response, because they stop sweating and their skin dries out. Galvanic skin response tends to rise when sweating, as sweat increases conductivity, and tends to drop when the skin dries up. Activities and movements such as sports can also influence galvanic skin response readings, but these can be attributed accordingly when other sensor data is taken into account (Shariff, Hingorani, Albadawi, 2015), such as heart rate data, which during exercise should be between 50 to 85 % of 220-age (Gholipour, 2018) (This heart rate data will also be used to alarm professional help in case of cardiovascular events). Under hypothermia conditions a person’s heart rate will drop, under hyperthermia conditions a person’s heart rate will initially rise, and eventually drop as the person goes into shock.When most or all spikes in galvanic skin response have been attributed to other causes such as physical activity, what is left is the base galvanic skin response. When this is base higher on average than the baseline measurement, this is indicative of a sweaty skin, when this base is lower on average than the baseline measurement, this means the skin is drying out. There is no such data found on the exact values of when things get dangerous, but what could be done is looking at the derivatives of the increase/decrease of the heart hate associated with hyper/hypothermia.
In the specific conditions our device will be used in hyperthermia seems like a less likely condition, but it can actually still happen through other causes than a high environmental temperature. Another cause for hyperthermia is overexertion. In overexertion the body has produced more heat than it can handle (rather than receiving it from the environment), and will start to sweat until it can no longer do so, making it similar as the other situation yet still relevant to our use case. Another way to therefore detect this situation is to signal a dehydration or hyponatremia in time. A dehydration is a lack of fluids in the body, and hyponatremia is a lack of salts in the body. In the case of hyperthermia the dehydration is caused by excessive sweating, which goes paired with a large loss of salts in the body, meaning in the specific case of hyperthermia, dehydration and hyponatremia go together, and can be predicted by monitoring the amount of salts in a person’s blood. This can be measured using blood sensors mentioned in previous weeks. Blood sodium levels ought to stay between 135 and 145 milliequivalents per liter (Mayo Clinic Staff, 2018); when they fall below this, a person has hyponatremia.
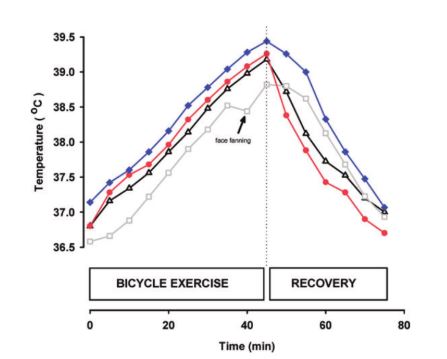
Figure 1: The body temperature change IN VEINS: oesophageal, tympanic, arterial and jugular venous blood temperature. As can be seen, a linear increase/decrease to cool down/heat up the body, trying to keep the body temperature constant. (Nybo, 2012). f(t) = 0.9e-3*t+T_base
This figure is a comparison of how quickly the body temperature can change in veins. One can calculate that for this particular case, the temperature increase is approximately 0.9e-3 degrees Celsius per second. Recovery has a faster decrease: 0.08 degrees Celsius per second (Nybo, 2012).
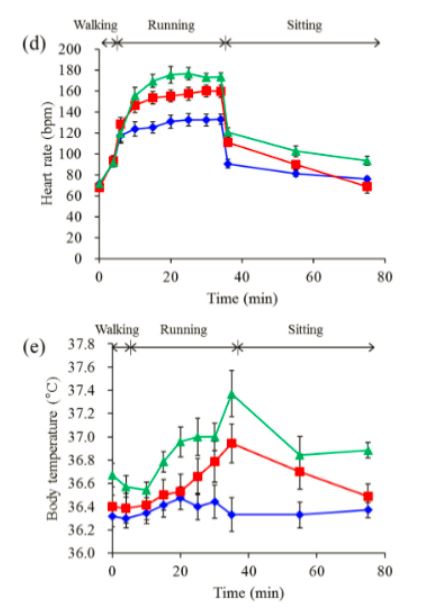
In this figure, the heart rate and body temperature have been measured for a person who went from walking (at time 0), to running (at time 5 min), to sitting (at time 35). The different curves show different speeds. The blue curve corresponds to running at 6km/h, red to 8km/h and green to 10km/h. Error bars have been included in this figure meaning that several people participated in this research. So note: Two of the seven subjects gave up 15 and 20 min after running started at 10 km/h because of difficulty maintaining the pace. Therefore, seven datasets collected at each time point, except for 20 min at 10 km/h (n= 6) and from 25 min to 34 min at 10 km/h (n=5) (Iwasaki, 2015). For the algorithm, hiking is more of a “walking-pace” intensity level with an increasing intensity when going on slopes or when actually climbing. Therefore, we will compare this intensity with the red curve (also because the green curve is incomplete). For the heart rate, the increase coincides most with a logarithmic function. Thus, when starting to increase the intensity at time = 5 min: HR = HR_base + 25 + log_1.05425(t+1) per minute. As one can see, the body temperature increases exponentially with 1.00054586 per minute or T = T_base*1.000272893^t, where t is in 30 seconds. As not a lot of data points have been taken, the temperature decrease while resting seems to linearly decrease with T = T_base-0.00333t per 30 sec (Iwasaki et al., 2015).
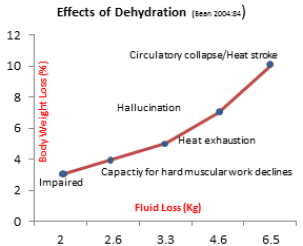
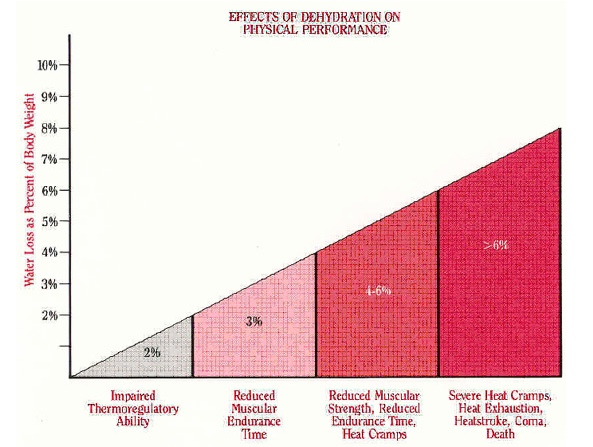
Figure 2: Effects of dehydration (Bean 2004:84) http://kilcooleac.com/dehydration-and-fluids-in-running/
As can be seen from the figure 2, it is getting dangerous when someone loses more than 2 kg of fluid. This will result in impairing. Code orange: 2 kg to 4 kg, code red: >4kg. However, these are all absolute losses, which can actually differ from person to person. Figure 2 and 3 (also) show relative weight losses. Now: code green: 0 to 2%, code orange: 2% to 6%, code red: >6%
'Figure 3: Relative dehydration risks https://tunedintocycling.com/2012/07/
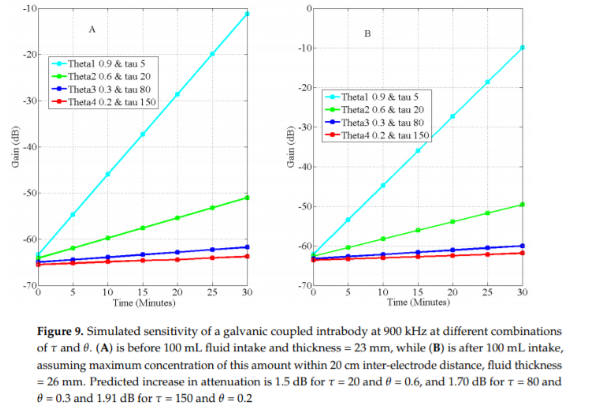
A galvanic skin response detector is able to measure a person’s hydration level. It is expressed in gain (dB). Figure 9 shows simulated sensitivity. One can see that after drinking, the gain will increase accordingly. This is just a proof that galvanic skin responses work. No further useful conclusions with respect to this project can be made with this information. Asogwa, C., Collins, S., Mclaughlin, P., & Lai, D. (2016). A Galvanic Coupling Method for Assessing Hydration Rates. Electronics, 5(4), 39. https://doi.org/10.3390/electronics5030039
http://www.ilocis.org/documents/chpt42e.htm
In the link above, there is a section under “Rational indices”, which formulates the equations and how to interpret the results of calculating the HSI (heat stress index) and ITS (index of thermal stress).
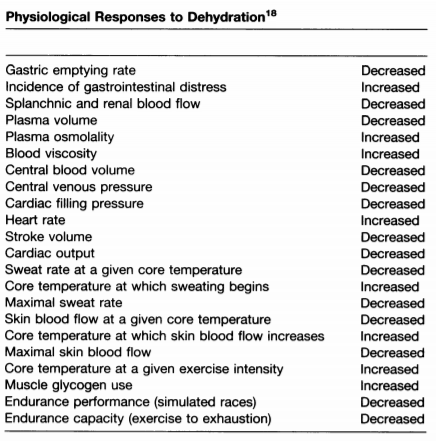
Figure 3: Consequences of dehydration (Montain, 1992).
“Although the symptoms of heat illness can vary widely among individuals, heat exhaustion due to dehydration is often evidenced by irritability, sudden fatigue, and lightheadedness, with nausea and headache also possible. Skin color is often pale with normal-to-profuse sweating. Heat stroke is characterized by high core temperature, reddened skin, and normal-to-profuse sweating. Severe heat stroke is characterized by central nervous system dysfunction (eg, loss of motor coordination, delirium), and, in the most serious cases, loss of consciousness leading to coma.“ (Murray, 1996) Murray, R. (1996). Dehydration, Hyperthermia, and Athletes: Science and Practice. Retrieved from https://www.ncbi.nlm.nih.gov/pmc/articles/PMC1318513/pdf/jathtrain00019-0058.pdf
"We found that the magnitude of increase in core temperature and heart rate and the decline in stroke volume were directly related to the body weight loss (and thus dehydration accrued) during exercise. Thus, when subjects exercise at 62% to 67% Vo2max under the present environmental conditions (33°C dry bulb, 50% relative humidity, wind speed 2.5 m/sec), the optimal rate of fluid ingestion to attenuate hyperthermia and cardiovascular drift is the rate that most closely matches fluid loss through sweating, at least until the rate of fluid ingestion replaces 81% of sweat loss."' (Montain, 1992). Montain SJ, Coyle EF. The influence of graded dehydration on hyperthermia and cardiovascular drift during exercise. J Appl Physiol. 1992;73: 1340-1350.
When the suit detects the onset of hypothermia, the drone can be dispatched to send warmer clothes, heat elements, and perhaps a light-weight tent to serve as shelter and protection. When the situation worsens the person will be warned to not actively heat up theri body, and a medical team will be sent to offer professional help. In the case of hyperthermia the drone can be dispatched to send sports drinks to replenish sodium and bring cooling elements. When the situation worsens the person will be warned to no longer ingest any food or drink, and try to cool down actively as much as possible and a team of medical professionnels will be sent. In conclusion, this means there are several options to detect hyperthermia and hypothermia. To detect hypothermia, a galvanic skin response sensor, a heart rate sensor, and a temperature sensor will be utilised. To detect hyperthermia, the galvanic skin response sensor, heart rate sensor, temperature sensor, and sodium level sensor will be utilised.
To combine these sensor readings into a more personal advice, acceptable, risky, and dangerous ranges for each sensor will be compared and combined. When at least two sensors are indicating a risk, a warning will be issued to the wearer, and the wearer will be given the option to decline the dispatch of a drone to send first aid material. When the wearer declines, another warning and drone request will be sent and offered for declination each time another sensor enters the risky range, or a sensor enters the dangerous range. When two or more sensors reach the dangerous range, a request for professional medical attention will be issued and offered for declination.
For the temperature sensor, values in the between baseline - 1 and baseline + 0.5 are ok; values between baseline -1.5 and baseline -1, and baseline +1 and baseline + 1.5 are risky; and values between baseline -2 and baseline -1.5, and baseline +1.5 and +3 are dangerous.
For the sodium level sensor, The ok range is between 140 and 145, the risky range is between 136 and 140, the dangerous range is below 136.
For the galvanic skin response sensor, provided the person is still active which is determined using the heart rate sensor, the ok range is between the midpoint of the baseline measurement and the base of when the person is active and sweating, and the base of when the person is active and sweating. The risky point is between this midpoint and the baseline, and the dangerous range is below the baseline.
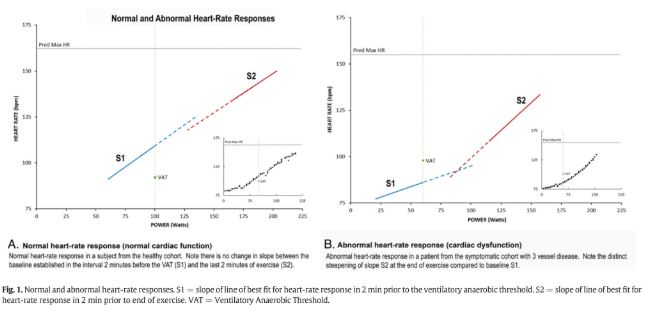
This figure shows the relation between heart rate and intensity for normal and abnormal heart rate responses. This curve has to be taken into account when also considering people with a cardiac dysfunction. For this project, when the heart rate increases with time, one can conclude that the intensity of the sport is increasing as well (Chaudhry et al., 2017).
Nes et al. (2013) have developed an equation to calculate the maximum heart rate of a person. This is: HRmax = 211 − (0.64 × age). This is not the only way to calculate this. There are a lot of other equations which have almost similar results as Nes et al. For this project, we have used this one as it is the most general one. If time would have permitted, more accurate equations would have been used which are, e.g, dependent on the gender and age as well.
Height related issues
When people ascend too fast, their blood will expand too fast, sometimes even creating air pockets. This can lead to cerebral and pulmonary oedema, where fluid starts to build up in the brain or lungs. This can be predicted by use of an altimeter to monitor their speed of ascension. This condition is very dangerous, and first aid can’t properly help them. Because of this, when the rate of ascension goes above 305 m a day (Ultimate Kilimanjaro team, 2018), a request for professional help will be offered for declination.
Another problem encounterable at great heights is hypoxia, where the blood oxygen levels are below 60 mm Hg rather than between 75 to 100 mm Hg (Mayo Clinic Staff, 2018). Considering hypoxia can speed up hypothermia, it is important to strictly monitor the blood oxygen levels using the oxygen sensors mentioned in earlier weeks. This too is a condition in which professional help is a necessity. For the altimeter, the ok range of values is between 0 and 250 m per day. The risky area is between 250 and 285 m per day, the dangerous area is 285 m per day and above, with a warning sent at 250 and 285 m per day. Considering everyone is different, and this indicator uses only one sensor, the user will be able to set the dangerous rate of ascension from the standard 305 m per day to a different level as most people attempting dangerous climbs have practiced and trained often and know their body well. For the blood oxygen levels, between 80 and 95 mm Hg is the ok range, between 65 and 80 mm Hg is the risky range, and warrants a warning concerning hypoxia and hypothermia. Levels below 65 warrant offering a declination option for professional help. Not all data is known, so sometimes, only an educated guess is available. However, other tricks can be implemented, like taking the derivative can help “guessing” the problem. For example, heart rates keep changing, this does not mean that when the heart rate increased with 30 beats per minute is necessarily dangerous. There is a factor that is being forgotten which is time. If your heartbeat increases with 30 beats per minute in 10 minutes, this is not a coincidence. However, when this changes within a 10 seconds, one should ring a bell. Therefore, the slope of the increase is a very important characteristic.
