PRE2016 3 Groep14
This is the project page of group 14. Initially, this group was focused on developing smart home technology for elderly people, to allow them to live independent for longer. Because this subject was very broad, it evolved into smart technology for just monitoring people's health by measuring their heartbeat. The group wants to ask elderly people for their preferences with a survey and then create a design and develop a simple prototype of this smart monitoring system.
Group Members
All group members are second year Electrical Engineering students
- 0965960: Jeffrey Baijens
- 0939205: Margot Emke
- 0945279: Jari van Ewijk
- 0946751: Marjolijn Kleijer
- 0944856: Bram Lustenhouwer
- 0942103: Wouter Wolthuis
Introduction
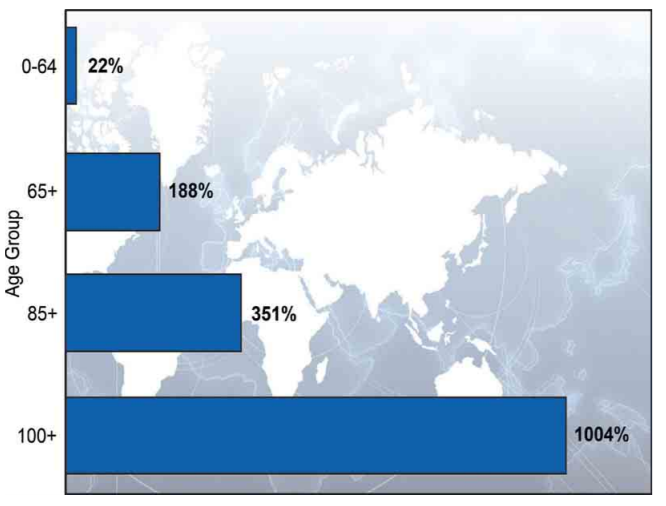
According to the Global Health and Aging report by the World Health Organization (WHO), the world population is growing and the age composition of the world population is changing over the years. This causes an increase in the amount of elderly, which can be seen in Figure 1. This increase is mainly caused by the “baby boom” between the years 1946 and 1964 in combination with the rising life expectancy within the older population itself.
With the population ageing, there are expected challenges to our health care system. Future shortages of healthcare workers and lack of the diversity of their professions is likely. To be able to manage the increasing demand for healthcare, new models of care will be required. One of the possible solutions is to develop a "smart heart", which observes the heart of an elderly and alarms care givers, family or someone else when something goes wrong with the heart.
Our Goal
The goal of our project is to build an interface for the application of a smart heart. First, it is important to determine what the needs of the elderly and care givers are.To determine what the elderly and care givers want, a literature research will be done and a questionnaire will be taken. After the questionnaire, the results will be processed and discussed, where after decisions can be made about the design of the user interface.
Heart problems
Heart attack
With a heart attack, there is acute danger of life. Especially, lack of oxygen to the brains is causing problems. After only 4 to 6 minutes, brain cells become irreversibly damaged. After that, the other organs can get damaged too.
Cardiac arrhythmia
A cardiac arrhythmia is a deviation in the cardiac conduction system, a small electric network that controls the pinch of the heart muscle. There exist a lot of different kinds of a cardiac arrhythmia. They can affect the pumping force of the heart, but they are fairly harmless. An example of a cardiac arrhythmia is a heart block.
Pain on chest
Pain on the chest can be caused by heart failures.
State-of-the-Art
Types of heart measurements
In this wiki, it will be discussed how certain measurements of the heart can detect serious heart problems and failures, as well as certain state-of-the-art devices that can continuously perform these measurements in someone’s daily life. Before going into these topics, a number of the most common or promising types of heart measurements will be discussed, so that these can be referred to further into the wiki. [4]
Electrocardiography
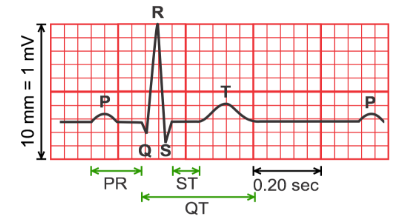
Electrocardiographs, abbreviated with ECG, and sometimes EKG, are a type of heart monitoring that can measure the electrical activity of the heart. With ECGs, the presence of deviations to the arteries surrounding the heart, disordered heart rhythms, and other types of heart failures can be discovered. This will also be discussed in the next section.
ECGs are performed by connecting certain wet silver/silver-chloride (Ag/AgCl) electrodes to the body, that measure the differences in electrical charges on the skin, that come as a result from the electrical activity from the heart. A problem is that moving other muscles also causes electrical changes on the skin, which makes continuous monitoring in someone’s daily life more difficult. Over time, however, electrodes have been developed that apply signal amplification, filtering and noise reduction, so that ECGs can be used for wearable health monitoring. A number of these ‘active’ electrodes have already been developed. [3]
The requirement of the aforementioned wet electrodes brings a number of downsides. For one, these contacts can cause skin irritation. Secondly, the measured signal becomes less readable over time as these electrodes dry up. To counter these issues, electrodes that can be put on top of clothing and dry electrodes have been developed, respectively.
Signal analysis
Signal analysis on a ECG can be used to find serveral heart deviations[5].
A heart attack can immediately be recognised on an Electrocardiography (ECG), which can be seen in Figure 3, by a deviation in the ST-segment of the ECG. During a heart attack, this segment is higher than normally.
A heart block can be recognised by an ECG, which can be seen in Figure 4. On the ECG this is visible as the intervals between the P-top(contracting of the atria) and the QRS-complex (contracting of the ventricles) are no longer associated. The P-top and QRS-comples do not follow on each other but start to show their own -independent- rythms.
Pain on the chest can also be recognised on an ECG, which can be seen in Figure 5. On the ECG the line between the QRS-complex and the T-top (the ST-segment) lies lower than usual during a pain attack.
-
Figure 3: ECG of a heart attack
-
Figure 4: ECG of a heart block
-
Figure 5: ECG of pain on chest
Heart rate
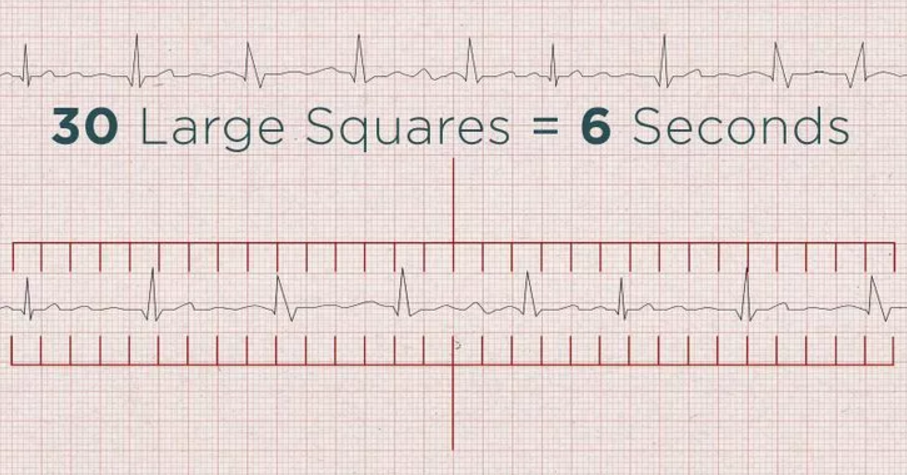
An ECG can also be used to determine the heart rate. This can be done in two ways: by using the distance between the QRS complexes on the ECG or the six seconds method, which uses a six seconds strip, which can be seen in Figure 6.
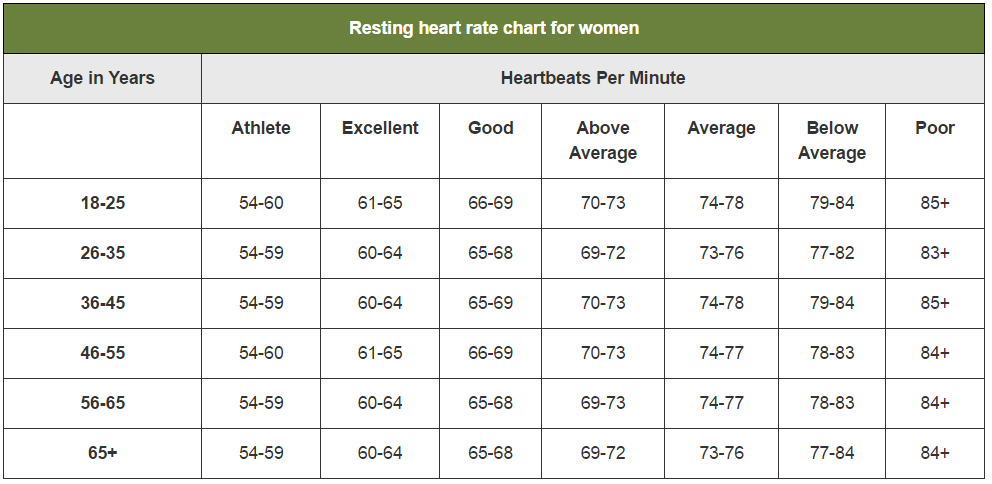
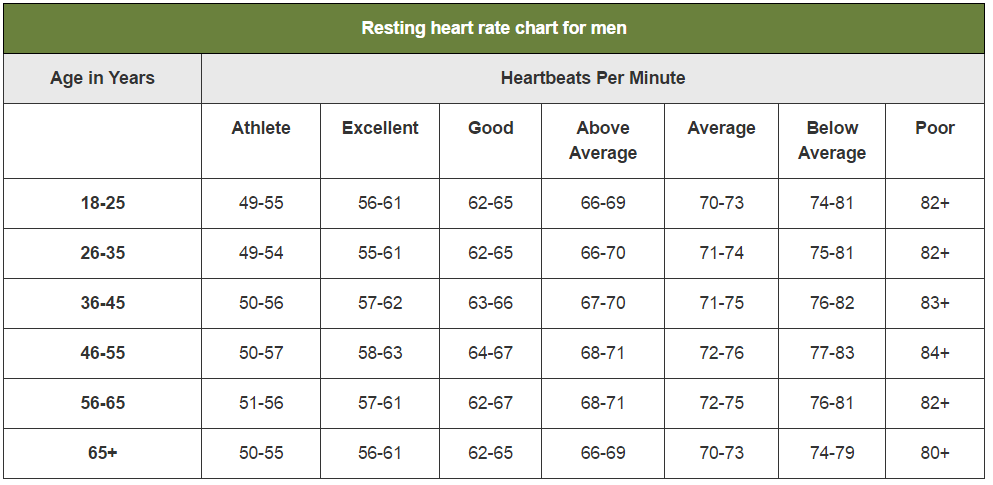
A normal heart rate relies upon body size, heart conditions, age, gender, medication use. Even emotions and air temperature can influence the heart rate. The heart rate based on age, condition and gender is displayed in two charts in Figure 7 and 8. The charts show that a normal heart rate lies between 60 and 80 beats per minute.
-
Figure 7: heart rate of women
-
Figure 8: heart rate of men
During a heart attack, the heart rate deviates from very low to very high. A very low heart rate, below 60 beats per minute, is called a bradycardia. If the heart rate becomes below 40 beats per minute, dizziness, passing out and a dangerously low blood pressure can occur. A very high heart rate, above 100 beats per minute, is called a Tachycardia. A high heart rate can lead to an increase in risk of stroke or cause sudden cardiac arrest or death.
Detecting heart problems with the heart rate is the easiest way. Signal analysis and comparison is way too much work.
Photoplethysmogram
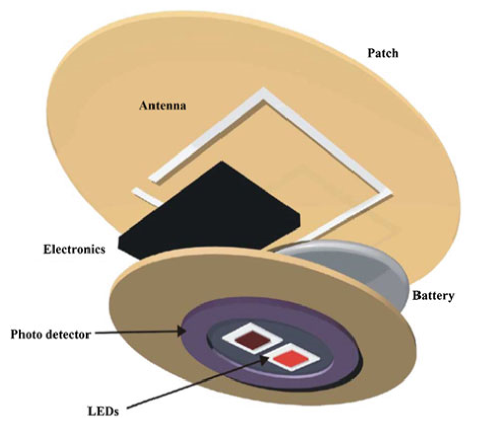
Photoplethysmograms (PPGs) are graphs depicting measurements on the volume of an organ, such as blood vessels. With these graphs, changes in the blood volume can be measured. This can be used to monitor blood oxygen saturation, blood pressure and the amount of blood the heart pumps with every beat. PPGs (figure 9) are made using a light emitter, usually a light emitting diode (LED) and a light detector, usually a photodiode. Light is shone onto a person’s skin and either the reflection of this light, or the light that passes through gets examined. The reflection is due to the fact that LED light cannot shine through red blood cells. Such measurements can be performed on fingertips, toes, ears and noses. The main issue and advancement for PPGs in wearable technologies is that LEDs require a high power consumption. The advancement is a photodiode that is shaped like a ring, capturing more of the light emitted by the LED and therefore requiring less light and power from the LED [6]
Blood pressure measurements
Another way with which blood pressure is normally measured, is with the use of a sphygmomanometer. These measure blood pressure by inflating a cuff to close an artery and release it again, monitoring at what point the blood flows again. Such a device would be immensely uncomfortable for continuous health monitoring, although they are used at times for a day for patients of cardiovascular disease. For long-term monitoring, they are deemed too be unpractical however. An alternative that was found when a relation was discovered in the delay between the R-peak from an ECG (figure 2) and the peak of a PPG. This relation, called pulse transit time (PTT) is displayed in Figure 10.
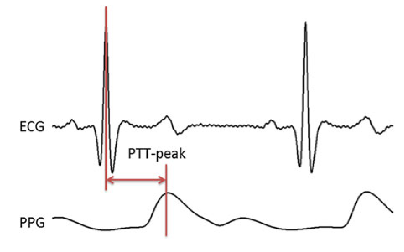
This relationship means that blood pressure can be estimated from the measurements of the ECG and PPG, and therefore do not require undesirable use of unpleasant cuffs being regularly inflated. This method is most likely paramount for blood pressure measurements in wearable technologies in the near future, but is still being developed. This PTT is highly individual and different methods for this estimation are still being researched. Methods such as estimating it with ECG, continuous wave radar and bio impedance. [7]
Respiration rate measurements
The respiration rate of a person is simply said the amount of breaths per minute. This rate can tell a lot about people’s health in general, and it can also be linked to heart failure. A study found that the average respiratory rate increased in the week leading up to patient with heart failure requiring to be hospitalised. [8] This respiratory rate can for example be measured with a respiratory inductive plethysmography (RIP). This setup consists of two sensors, placed at the ribcage and abdomen accompanied by electronics that process the signals. The measurements work on the fact that the inductances of the sensors change, depending on the cross-sectional area of the ribcage and abdomen, related to inhaling and exhaling. These have been developing over the years and already are capable of being worked into clothing.
Types of wearable heart sensors
There are multiple ways to implement a heart rate sensor, namely in clothes, watches or a waist band. It is even possible to put a heart sensor in your ear. Of course, every heart sensor works in a different way. Underneath are some examples.
Smart watch
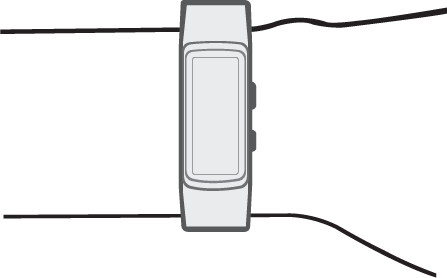
The smart watch uses an optical LED light source and sensor to measure the beats per minute. This LED light sensor measures the amount of LED light that reflects back due to the passing red blood cells. The amount of light reflections depends on the number of blood cells passing through, which is more when there is a heartbeat. According to the official Samsung website, the heart sensor is only to advise the user of his overall health. It can help you with exercise, so that the user knows if the exercise is intense enough, but also if the resting procedure is according to the health standards. One disadvantage is that the sensor can be afflicted by factors as environmental conditions, types of skin and placement on the skin. The best way to wear the heart sensor is right behind the wrist (see figure 11). Also, it cannot tell what your physical health is. It can only advise the user in his health. Also it cannot track any diseases on the heart or in blood vines. For example Samsung clearly states that the heart sensor is not a medical device, but is only used to keep track of your exercises.
Another disadvantage is that you need to sit still when measuring the heartbeat. Thus when the user is taking a walk, the heart sensor is not able to measure the heartbeat. For people with a pacemaker the heart sensor can be very dangerous. The heart sensor of the watch can interfere the signal used with the pacemaker. In that case the pacemaker can stop working, or does not function properly. Therefore it is advised to keep the sensor at least six inches away from the pacemaker. [9].
Waist band
A heart sensor can also be implemented in a waist band. Most of the waist bands work with electrodes that measure the heart beat on the chest. A waist band is more accurate than a wrist band, as it uses a better technique and is closer to the heart. Still the sensor cannot keep track of your health, but is only to keep track of your exercise. One difference with some of the waist sensors is that it can be tracked with the phone via Bluetooth. This is easily done with an app that can be downloaded, in which the user can see the beats per minute and even the heart signal. Further it can have the same disadvantages as the smart watch.
Earpiece sensor
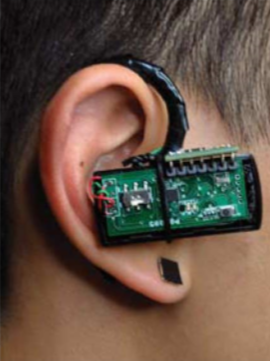
Another device for continuous heart monitoring could be an earpiece combined with an earring, which can be seen in figure 12. Such a device [10] can estimate heart rate and other characteristics of the heart via PPG. As mentioned, movement noise is always an issue with continuous wearable sensors. An advantage to this device is that there is less movement noise from the ear, than from for example from the wrist. Ears do not move as much when compared. Another advantage is that earpieces are generally rather comfortable for continuous wearing and it could even be combined with a hearing device if the elderly person in question already has to wear one of those.
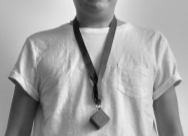
1-Lead ECG necklace
Another recently developed device containing possibilities for ECG measurements is a necklace. This necklace, which can bee seen in figure 13, with electrodes placed in the neck, was also designed for continuous heart rate monitoring and successfully implemented. As before, motion artefacts are a considerable issue for such devices. The paper reports that with limited activity, the device is reliable. In other words, for elderly that we assume do not partake in highly intensive activities around the house, such a device would be sufficient to accurately provide ECGs and process the information to provide feedback on healthier living and alarm people when signs of heart failure occur. Such a necklace could be preferred by elderly, but in its current state is most likely not the most reliable. [11]
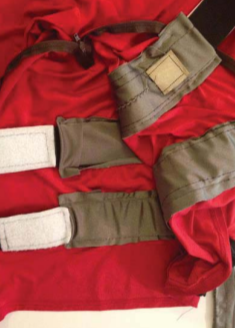
Health shirt
A shirt that uses electrodes and other materials in the textile can be used for long-term and continuous monitoring of physiological parameters. The advantage to such a health shirt is its versatility. Such a shirt can monitor the electric activity, or potential, of the heart from the chest (ECG). Moreover, it can also monitor other physiological parameters such as body motion activity, tilt, respiration rate and heart rate. Having all these sensors integrated into one piece of wearable fabric could make them comfortable for long-term use, as well as lead to early diagnosis of (heart) diseases, due to the many sensors. This does require a person to wear specific clothing that they otherwise might not want to wear. Motion still gives issues, but with a shirt there is enough room to integrate sufficient signal processing materials to improve the measured signals. [12] A prototype of such a shirt can be seen in figure 14
-
Figure 11: A smartwatch
-
Figure 12: An earpiece for an heart monitoring device
-
Figure 13: An necklace for ECG measurements
-
Figure 14: A shirt with electrodes
The National Instruments myDAQ
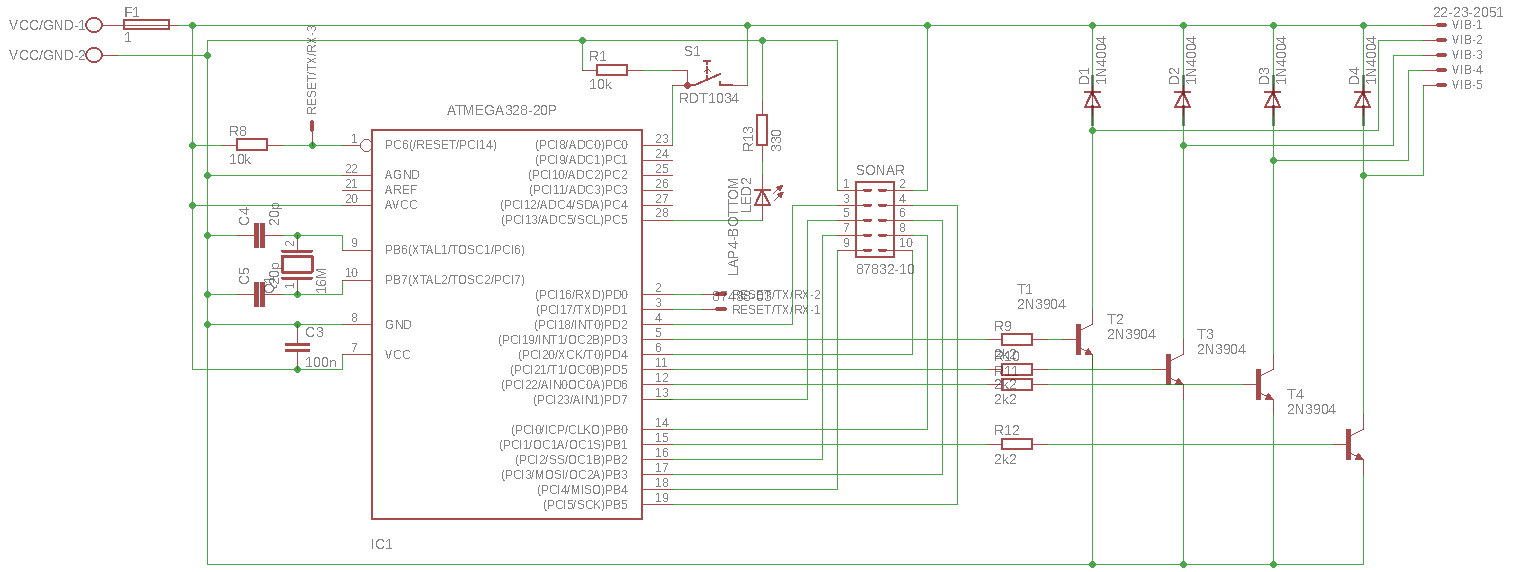
This setup is used at the course 5XEA0: Spectrum of electrical engineering, care and cure lab. This heartbeat sensor also uses electrodes. These electrodes are coupled to both wrists and one ankle. These electrodes are coupled to the myDAQ, in which it passes a high- and low-pass filter (see figure underneath). This device comes closes to an ECG when processing the signal, in which exactly the heart signal can be filtered.
With the help of software, the received signal can be filtered to give an exact graph of the heartbeat, Figure 16.
There are some disadvantages to this system. The processing unit is too big to wear, and thus is not easily implemented to the body. Also, the unit needs to be connected to the computer by cable, which is not desirable.
-
Figure 15: myDAQ circuit
-
Figure 16: graph of signal from the myDAQ
Sending the heartbeat signal
There are different ways in sending the heartbeat signal to a laptop or a smartphone. This can be done via Wi-Fi, Bluetooth or a wired link. It is wanted that the heart sensor is wireless, so that it is easy to wear.
Bluetooth
Bluetooth is most commonly used to send data from one appliance to another. Current Bluetooth can almost send everything to other appliances. As seen at the waist band, it is possible to send the data to the users smartphone. Bluetooth does not require much battery usage and does not take a lot of room. One disadvantage with Bluetooth is that the receiver appliance needs to be close to the sensor. This can be a problem when the signal needs to be sent to the care giver. Therefore the receiver appliance needs to be connected to the Wi-Fi.
Wi-Fi
There are multiple ways to send the signal via Wi-Fi. As mentioned, the Bluetooth will send the heartbeat from the sensor to the phone of the user. Then it can send the signal to the wireless internet connection to the care giver. The care giver will be able to connect to the sensor and look at the heartbeat. Another way is to place a wireless internet connection directly in the sensor. In that way the sensor does not have to be connected to the phone of the user. One disadvantage is that not all elderly have an internet subscription. Also, being connected to the internet and sending data at all time to the care giver takes a lot of battery usage.
USE aspects
The USE-aspects of a smart heart for elderly are discussed here:
- With a smart heart, more elderly can be saved because of more supervision on heart functions.
- Because of a smart heart, care givers get more time to focus on other tasks then just checking on elderly with heart problems.
- When care givers get more time, they are able to care more elderly. Therefore, family and friends do not have to take care of the elderly anymore, which is an advantage for the society.
- Through the smart heart for elderly a new market is created, which focusses on new monitoring devices, etc. Thereby, new jobs and companies can be developed, which is an advantage for enterprise.
User needs
Conclusions that can be drawn from the questionnaire. The questionnaire can be found in appendix A.
Primary users:
The elderly:
- The elderly are not really interested in the ability to measure their own heartbeat. Therefore the user interface does not need a graphical representation of the average heartbeat over time. The user interface only needs a clear heart beat in beats per minute;
- The elderly are not a fan of constantly being monitored when they are feeling healthy; however they are in favor of constantly transmitting their heart rate when they are suffering from heart disease;
- The elderly do want the heart rate sensor to transmit an alarm when the sensor detects an interruption or other fault in the heart rate;
- The elderly want a button on the sensor that they can use to alarm caretakers when they are feeling unwell. This alarm function can also be included in the user interface but that is not strictly necessary;
- The elderly want to be able to cancel an outgoing alarm when they feel it is not needed;
- The elderly want their care givers or family to be able to see their heart beat signal;
- The elderly want the sensor to be small and portable
Furthermore, the elderly will not feel safer when wearing this device and it will not lead to them feeling more confident in going outside on their own.
Secondary users:
The care givers:
- The care giver do think this is a great technology for the elderly to use on a daily basis. The only worry is people with dementia forgetting to charge the heart sensor.
- The opinions are divided. Some care givers say that the elderly will stay longer at home, because a heart disease can easily be found and cured. Another group thinks that elderly move out of their house for other reasons.
- The care givers are unanimous about this question. They do think that the heart sensor improves the safety of elderly.
- Most of the care givers only want to see the measurements in case something goes wrong. However, they do want to do a weekly check to see the measurements of that week and if any problems occurred that week.
- Mostly computer or smartphone.
- The care givers do not think that it will decrease the work pressure of their function. They do however think that they can act faster when there is a problem with a patient.
- Opinions are divided among the care givers. Some will recommend it to the elderly, especially to the elderly who still live at home, some are still not convinced that our technology will help the elderly.
- Need to be alarmed, when an alarm is triggered by the smart heart.
The family and friends of the elderly:
- Need a display to see the heart beat signal of the elderly.
- Need to be alarmed, when an alarm is triggered by the smart heart.
Tertiary users:
Engineers or doctors who need to install or implement the system:
- Want that batteries of the system are easy to change.
- Need a manual for the system.
The requirements, preferences and constraints of our new technology
RPCs for the “smart heart” heartbeat sensor with automatic alarm function
Requirements:
+ There has to be some type of sensor that can detect and register a heartbeat
+ This sensor has to be able to send data to a receiver in some way
+ The receiver has to be able to draw conclusions from this data
+ The receiver has to act upon its drawn conclusions
+ The receiver has to send data to user interfaces
+ The receiver can contact family members in case of an emergency
+ The receiver and sensor are connected wirelessly
+ The sensor can be worn by a person
+ The user interface for elderly has to show heart beat over time
+ The user interface for caretakers has to show heart beat over time and give warnings when something is wrong
+ The sensor needs a manual alarm button that sends a message to caretakers or even the emergency services.
Preferences:
+ The sensor is very small and hidden in clothing or accessories( 1.5 cm, 20g)
+ The sensor is waterproof and smash proof
+ The sensor can measure heartbeats accurately (max 15% false-positives or misses)
+ The sensor data is sent 3 or 4 times per minute to the receiver
+ The receiver can very accurately convert the raw data to a beats per minute signal ( max 1% false-positives or misses)
+ The receiver can draw accurate conclusions from the data (max 1% misses)
+ The receiver can contact by sending emergency popups, calls or messages
+ The manual alarm button is not sensitive to normal movement
+ The user interface is clear and presents all data continuously
+ The user interface works on mobile devices and the PC
Constraints
+ Has to be affordable (100€)
+ The sensor needs batteries (preferably works for a long time)
+ works with Wi-Fi, so not operable when not connected to the internet
+ Emergency button has to be reachable at all times
+ Needs to be turned off when the patient wants to
+ Only detects BPM signal
+ Weak AI that decides what to do due to limited processing power caused by the budget.
Responsibility
So far certain design aspects of the smart heart have been discussed and how it should work, but what if the sensor fails to do what is was supposed to do? What if, for whatever reason, the device fails to alert caregivers when an elderly person needs it? Let’s consider a number of scenarios in which we put the responsibility of such a failure by a number of the parties involved.
Responsibility lies with the user
The users are responsible for failure of the Smart Heart, if such failures come from incorrect usage of the device. Thus, so long as the condition under which the device can be operated are clearly stated as well as if there are clear instructions on how to use the device, and on how not to use it, the users are responsible for any misuse of the device. For example, the device starts providing inaccurate measurements or unintended shocks when the device is worn while swimming, or when it gets cleaned with water. If it is clearly state the device is not waterproof and not intended for such usage, the designers are not responsible for any faults or dangerous situations that might occur. The users have to use the device in the manner that was intended by the designers. If a certain sensor’s measurements have shown to be inaccurate during intensive physical exercise, the designers are technically not responsible for any issues that occur from faulty measurements made during moments where the user is very active. Oppositely, when the sensor is intended for complete continuous functionality, but the user decides to turn off or remove the device from their body. This could be equated with a doctor prescribing medicine to a patient, which the patient then decides not to take. Any issues as a result from this are not the fault of the doctor, but the fault of the user misusing what is prescribed to them.
Responsibility lies with the designer
Conversely to the misuse by a user, if the designers advocate the use of such a device in a way that it has not been approved for is illegal. [13] In such cases the responsibility lies fully by the designers of the heart monitor. Furthermore, the designers of the monitoring devices will be most likely be most often held accountable for failures from the Smart Heart. If the sensors produce inaccurate or faulty readings, which leads to heart failure not being detected, is blameable on the designers. Such is any unanticipated harm or discomfort due to design errors. Errors in the embedded software are also the responsibility of the designer. These come in two types. For one, no errors must be made as result of a decision of an autonomous device, such as unwarranted defibrillator shocks. Additionally, the user interface (UI) also needs to be properly designed. When the UI is poorly designed, leading to incorrect usage from the user, any problem situations to arrive from this are blameable on the designer. Such situations are a bit more unclear as to who is responsible, the user or the designer, but this depends on the situation. Nevertheless, the designers can be held responsible for an ill-designed UI.
Responsibility lies with the producer
So far unanticipated harm or discomfort due to design errors was mentioned. However, these unforeseen issues can also occur due to manufacturing errors. When this is the case, the responsibility lies with the producer, not the designer, assuming the design was proper and clear.
Responsibility lies with the caregivers
When the Smart Heart correctly detects heart failure, someone needs to be alerted so that help can be sent to the user. This brings up the issue of whom is allowed to see and monitor the information from the device. When considering who should monitor the data from the device to prevent heart failure, one of the first options are the caregivers of the elderly. If it would be their job to monitor the users to notice any discrepancies in the heart signal, they would be responsible if a heart failure goes undetected. This puts a large workload on the caregivers. A similar situation is when it is not their task to notice heart failure, but to get help to the elderly when the Smart Heart notifies them that something has gone wrong with the user. If mistakes occur due to the alarm not being raised by the device, the designers are responsible. If the alarm works as intended, but still no help has been sent to the user in time, the caregiver would be responsible.
Responsibility lies with the neighbours
If a caregiver would be tasked with getting medical personnel to the user, it might take to long for them to reach the victim of heart failure. To speed this up the device could notify people in the surrounding area immediately on its own. This could be family, but this could also be the neighbours of the user. For example, in the Netherlands there is a system that allows citizens with the capability to resuscitate people to get notified when someone in their neighbourhood is having a heart attack. [14] For now, such a system only works if there is someone to notify the authorities if someone is having a heart attack, which does not work if the victim is alone. Connecting the aforementioned system to our concept of a Smart Heart, elderly people having a heart attack can be revived by their neighbours, increasing the chance they will survive as neighbours are closer than medical personnel. Returning to the subject of responsibility, this would lie with the neighbours if the Smart Heart can be proven to have functioned properly, while the victim of a heart attack still died due to nobody coming to their aid (in time).
Advantages and disadvantages
Advantages
- Distance monitoring: With the help of a heart sensor, the elderly can be monitored from a distance. This can improve the living quality of elderly and will make home rehabilitation possible. When there is a heart attack or a raised heart rate, a doctor or the ambulance can be called immediately, giving higher survival rate and the person in need is helped a lot quicker.
- Disease check: With the heart sensor, heart diseases can be checked from a distance. In this way a lot of hospital visits can be cancelled. When a heart disease is monitored by the heart sensor, then the elderly can make a visit to the hospital.
- Economy: With this technology, a new market can be started. Companies will invest in this technology and will possibly gain profit from the heart sensor. In that way the companies can invest in more technologies or can improve the privacy and the security of the heart sensor.
Disadvantages
- Hackable: the heart sensor will be connected to the internet or Bluetooth at all time. In this way, the heart sensor can be hacked, which allows hackers to gain private data from the elderly. This can be solved by applying extra data security, but that will cost more money.
- high price: as with most of the medical machines that can be used, the heart sensor will be expensive. Therefore, the heart sensor will only be available for the upper class of society. A way to solve this is to let the insurance company pay for the heart sensor. But as in most of the cases, insurance companies only allow the money when medicine of medical appliances are needed.
- Privacy: as with all appliances that are connected to the internet, privacy of the user can be at stake. This can withdraw people for buying a heart sensor.
Cyber security
As with all applications that are connected to the internet, Bluetooth or other sharing methods, cyber security is a big issue. As private data will be present in the heart sensor, it is interesting for hackers to break into the system. There are multiple threads that can occur in the sensor:
- Malicious software: these are threads like malware, viruses or a Trojan horse which can send the private data to the hacker. This is the most common thread amongst computer users.
- Denial-of-service attacks (DoS): With these kind of attacks, the device will be blocked for the user unless he/she pays to unlock there device. In 2007, 25% of the respondents encountered a DoS attack in that year.
- Phishing: with this new technology, there will be a new kind of phishing methods. Phishing means that the user receives an email of their bank that they need to send their data via email. This can also be done with the heart sensor. In the email it will be asked to send the data of the past month to the health insurance company, and most of the people will still do that.
- Application vulnerabilities: through an internet connection, backdoor can be downloaded which gives the owner of the backdoor full control of the device. It can retrieve personal data and photos. Most security applications are not capable in defensing the device to these kind of attacks.
There are many more examples in threads that can occur in the device, but the above are most commonly used. There are multiple ways to prevent these threads to occur as described below [15].
VPN
Virtual Private Network (VPN) is a network that works across the internet. With this technology users can send and receive data from the network as if they were directly connected to that private network. It is harder for hackers to break into this system, as there are a lot of security systems implemented in this network. Usually the network is strongly secured, as most of the private data of a company is stored on a VPN network. This system is very useful for the heart sensor, as data can be send through a secret network and is hardly accessible for hackers. In that way the data of the heart beat can be send to the care givers [16].
WEP
Wired Equivalent Privacy (WEP) is a security algorithm for wireless networks. With this technique, the data that is send via internet is encrypted to a 10 or 26 hexadecimal digits. For extra security, the same authentication code is never used twice. This will make it a lot harder for hackers to break into the system [17].
WPA and WPA2
Wi-Fi Protected Access (WPA) are two protocols and security certification programs to secure the wireless networks of the users. Most of the networks these days work with WPA2. WPA is an extension of WEP, but more secure and harder to hack. With WPA, there is a Temporal Key Integrity Protocol (TKIP), which dynamically generates a new 128-bit key for each packet in a device. Also, there is a message integrity check which checks the data coming in and out of the device, in order to prevent a hacker for changing data [18].
strong password
One will be automaticly logged on to the alarm part (password saved on device). For any further data a password will be needed. This should be of decent quality.Currently with elderly, the passwords are not strong enough. Usually it is something simple like the name of their dog or their birth data. passwords that are that simple are easy to hack. Strong passwords can make sure that it can even take years to hack the passwords. Strong passwords are in the trend of random letters (with capitals in between) and numbers. The care giver can help the elderly in putting together a strong password. One problem is that elderly can forget important stuff like passwords. But this can be solved by just writing the password n a note and store it somewhere in the house.
Design decisions for the prototype
After the literary study was finished, a system for the measuring and viewing of a patient’s heart rate had to be designed. In this section, a number of critical aspects of this design and the reasons behind these decisions will be explained. It will describe why heartbeat per minute measurements have been chosen, rather than ECGs. It will also elaborate on signal analysis and the user interface design.
Sensor output signal
For the prototype that would be produced during the project, it was decided to go for a sensor output signal of heart rate in beats per minute, instead of a full ECG measurement. This decision was made because it became apparent from week 2 that doing a full signal analysis of the ECG signal would be far too time-consuming and would be a project on itself. As can be seen in the section about heart measurements and heart diseases, quite some of these can be ‘diagnosed’ based on a monitored BPM signal over time. Therefore we felt that the BPM signal would qualify for this project and that the signal would not be too difficult to work with. Furthermore, this signal can easily be simulated by us in case we cannot show a prototype with a working heartbeat sensor.
Way to display the user interface
There are several methods to display the measurement data. Some of them are not convenient for this project at all, such as printing and sending measurement data per mail once a week. Or sending the data by pigeon. However, there are also some methods that do make sense, such as a personalized app for the user or a computer program, or even a smartwatch app.
Because the elderly are not always familiar with the use of newer technologies, it was decided to go for the most accessible type of user interface platform, a webapp. This can not only be used with smartphones or tablets, but also with computers. This means that the elderly can open the data with their device of preference. Furthermore, it was thought that programming a webapp would not be far too difficult or time-consuming for this project and would allow us to implement all functions we wanted. As a future addition, this webapp could also be integrated in a smartwatch, which would make it even more user-friendly for the elderly.
The smart server
With all the data arriving from the heart sensor, the data needs to be filtered and combined to gain the proper data. for this a smart server is needed to fully process the incoming data. The server must be capable of sending and retrieving data from different appliances, and combining them in order to retrieve the correct data. For this the server needs to have Wi-Fi or Bluetooth. Of course for larger distances Wi-Fi is more applicable to the server. Also the smart server must be secure so that the data cannot be hacked. This will increase the cost of the smart server which is not desirable. Then the care givers must be able to retrieve the data of different patients from the server, therefore the server must be able to separate the different data’s from multiple patients.
To cover all these needs the server that has been chosen is the Raspberry Pi, described in the section “Data processing using a Raspberry Pi”. The Raspberry Pi is capable of collecting data via a Wi-Fi connection, process them and send them through to another device. It is also easy to implement and capable of processing multiple data.
WiFi
As mentioned before, the data must be send via a Wi-Fi connection, as larger distances must be covered. He disadvantage of Wi-Fi is that it draws a lot of power. Therefore a larger battery is needed in the server and the sensor. The server however can be connected to the power grid at all time so power is not an issue.as mentioned before the Wi-Fi also must have a strong data security so that the data that is being send is not easily hackable.
Wi-Fi is however the best solution for this project, as it easy to send the data of the patient and can work at all time. Also with current data security it is hard to hack the data. Wi-Fi is easy to implement and already implemented in most appliances.
User interface for the elderly
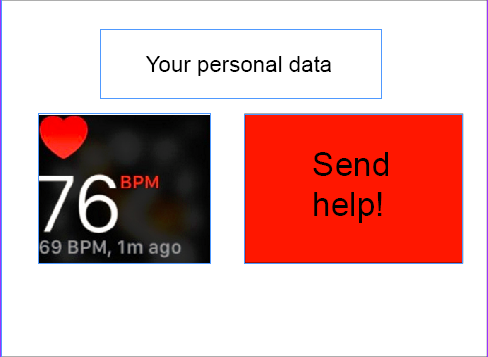
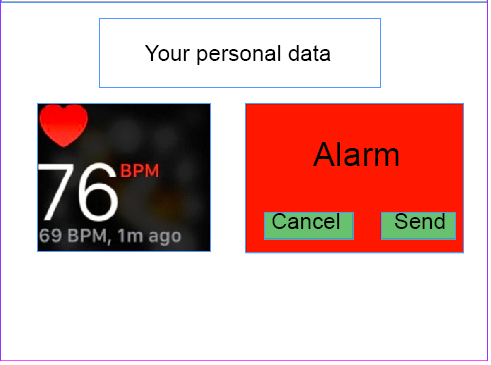
The elderly have shown interest in viewing their own BPM when they desire. However, the majority did not want to continuous overview of their heart rate over time. Therefore, such a graph that is present for the caregivers, is not shown in the UI for the elderly. Secondly, from the survey it became clear that the elderly would like to remain in control of the device. This has been implemented in the design of the UI in two ways: Firstly, aside from the alarm that gets raised by the device itself when it detects a worrying heart rate, the UI for the elderly possesses a button that allows the users to manually raise an alarm is they feel they are suffering from a heart failure. These design decisions are visible in the following figure. By limiting the information shown on screen to these mentioned functions, the UI of the device remains simple to use, even for people less familiar with computers and apps.
The second method by which the elderly remain in control involves the ability to cancel an alarm that is sent by the device themselves, if they feel that it is an unnecessary warning. When an alarm is raised, the UI looks as follows:
-
Figure 17: User interface for elderly
-
Figure 18: User interface for elderly when alarm is raised
User interface for the caregivers
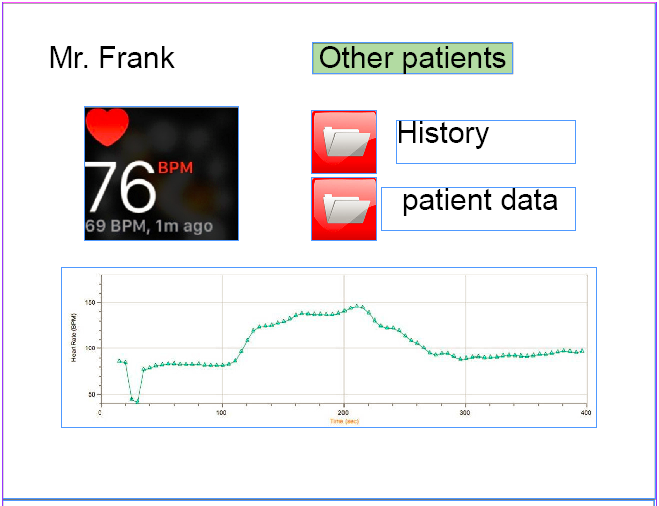
Unlike the elderly, the caregivers have shown interest in a continuous view of the measured heart rate. They want to be able to be able to fully check upon a patient’s condition when they think it is required. Furthermore, they would like the option to review the state of the heart from a certain period of time, like the past week. It has been researched that certain types of heart failure, like heart attacks, can be seen coming from a monitored heart rate so far as a week prior to the actual occurrence of such an event. Providing such information to caregivers will be very beneficial to the prediction of heart failures. This history of the patient, along with general information of these patients, can be viewed straight from the user interface for the caregivers. Additionally, a distinct view of the current BPM of the patient can be seen in the UI, similar to what is visible for the elderly. These design choices can be seen in the figure below.
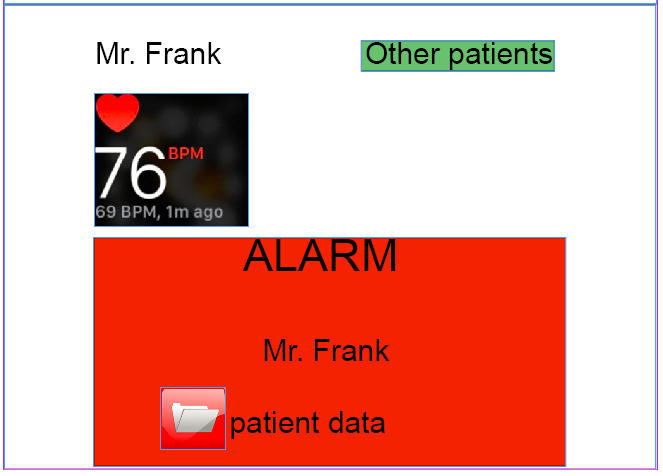
The caregivers have also mentioned that they want to thoroughly be warned when something seems to have gone wrong with one of the monitored elders. When an alarm goes off from one of these people, an overlay pops up on the current screen of the UI of the caregiver, clearly displaying that the status of a certain patient requires attention. This altered UI can be seen in the figure below. Such an alarm clearly depicts something has gone wrong, displays the name of the corresponding patient and provides a link to the data on the person’s health.
-
Figure 19: User interface for care givers
-
Figure 20: User interface for care givers when alarm is raised
Prototype Development
One of the goals of this project is to deliver a prototype according to the design decisions. However, considering the limited time, it has to be a simplified version to showcase the main features of the design, even though some of the design choices already simplified the design a lot.
Inputs: The heartbeat sensor
The prototype will simulate the inputs from the sensor that the patient (the primary user) carries with them. No simple heartbeat sensors that could transmit the BPM to another device were available, and developing one during the project would have taken too much time. Smartwatches and some more professional heartbeat sensors were considered, but their data could not easily be exported to another system. These inputs would have been send to a server (for multiple users) or central processing device (for a single user), but will now be simulated directly on the processing device.
The heartbeat sensor also would have had an user interface on which some information regarding the measurements would be displayed. It would also alert the user if the system had made the decision to call a caregiver or emergency service. Users would also have the option to manually call for help or cancel a call. However, some errors during the development of the software for the implementation of the UI has caused it to remain unfinished and unable to be used and implemented in the prototype itself.
Data Processing Using A Raspberry Pi
The processing device which receives (in this case: simulates) the input from the sensor, makes decisions and calls caregivers/emergency services could have been either a local unit for each household or a central unit that processes the information for many patients. The result of the survey could have been that the primary user (the elderly) would like to have full control over the system and the data it collects and sends to others, in that case a local processing unit would be preferred. However, it might be easier to send all data to a data center and process it for all patients, maybe even training the system with all this data it receives.
For this first simple prototype, the “brains” behind it will be a Raspberry Pi. It will be setup as the server that receives inputs from the sensor, processes this input and takes the right actions. That a Raspberry Pi would be used as the backbone of the prototype was chosen well before the survey was even carried out. It is a very flexible device that can basically do (almost) anything a normal personal computer or server can do, while also being fairly inexpensive and widely available. Furthermore, it is optimized to run code written in the Python language, which has some comprehensive data processing extensions available, like for example the NumPy/SciPy libraries for doing complex vector and scientific calculations. Python is used a lot for processing large sets of data, and is a very popular language and a strong competitor to the R language in the Data Science field.
Simulating The Inputs
Because using a real heartbeat sensor as input for the Raspberry Pi proved to be difficult, it was decided to simulate inputs on the device itself. An application in Python was created which would accept manually entered (integer) numbers that represented the heartbeat. This small application would act as an interface to the decision making software and it would provide it with the right input parameters. Further additions could easily have been made. For example, the script could also have been adjusted to regularly send a simulated BPM number, with some small deviations and sometimes a random peak. However, for the initial testing stage it was deemed more effective to manually provide numbers and see how the system would act.
Making Decisions And Taking Action
Because Python was already used to simulate the input, it was easiest to also use the language for the decision making software. Initially, a simple piece of software was build that would simply go through a list of possibilities and “make a decision” when the conditions were met. At this stage, the only actions were either doing nothing, or alarming a caregiver, which was simulated by sending a message to a Telegram account. Telegram is an instant messaging app similar to WhatsApp. There were plans to make the decision making smarter by including patient history or previous measurements and comparing them, but also by analyzing the rate at which the BPM signal would rise or fall. An actual intelligent system (to some degree) that could easily be extended by adding more logic about the detection of BPM signals for different conditions of the heart would also have been a possibility, but would most likely have taken a lot of time.
In the end however, the simple system remained, because it became clear that the user interfaces for the patients and the caregivers would not be finished in time. There would not have been much to show other than a commandline interface through which could be communicated with the software. It was decided to stop further development of the prototype and focus on presenting our literary research and design concept, without the prototype.
User Interfaces/Applications
The control application/interface for the caregivers will be a web-based application for this first prototype, because this again allows most flexibility. A full-fledged native application for a particular platform (Android, iOS, Windows, or maybe even a custom platform) would require more time and this approach again allows for a more simple and adaptable prototype which can easily be extended during the development, while still being able to showcase the main ideas of the design.
The web app was to be developed in the Ruby language with the Rails framework, because this seemed to be a popular and well-documented way of building web applications. However, it turned out that it also made development of simple application such like the intended user interface a quite complex task. Because a major part of the coding had to to with knowing the framework and the language it costed a lot of time compared to the results. This also meant that a big portion of the time used on ruby was spend on how to utilize the framework instead of actually creating results. Sadly enough the framework also led to an unexplainable error. The error was referring to a part of the framework which was unused and unedited. This part of the framework was responsible for 'cookie privacy' as far as known. The error itself referred to an empty file, but the lines of code to which the error referred was found in another file. (Making the error even more unexplainable) Due to this the interface remained unfinished and could not be implemented in the prototype. Because the user interface for the patients themselves would be implemented in a similar way, also this interface is unavailable.
Technical Specifications
Some of the relevant specifications for the Raspberry Pi 3 Model B, used in the prototype:
- 1.2GHz 64-bit quad-core ARMv8 CPU
- 1GB RAM
- 4 USB ports
- Ethernet port
- 802.11n Wireless LAN
- Bluetooth 4.1
While it does not have the processing power of a high-end desktop computer or dedicated server, it provides plenty of power for doing some simple to advanced simulations and calculations in a reasonable timespan. The built-in Wi-Fi and Bluetooth receivers/transmitters gives it two easy ways to wirelessly communicate with other devices. Through the USB ports, more storage space can be added to keep more data about the user for future reference, if desired.
The Raspberry Pi is setup with the Raspbian Jessie Lite image, a derivative of the Linux-based Debian Jessie operating system. The version used was the image from March 2nd 2017. One top of the software included in this image, packages for Ruby (version 2.3.4) and the Rails framework (version 5.0.2) were installed to accommodate the user interface web application. Furthermore, the Python library twx.botapi was installed to allow the decision-making software to “call” a user by sending them messages on the Telegram app.
Written Code/Used Software
- Some of the code written in Python that would have been part of the prototype can be found in a .zip file on: https://drive.google.com/file/d/0BzPeqtioO4Vfc0FxMG9lVWRUR3c/view?usp=sharing
- Some parts of the Python code depend on a library to communicate with the Telegram API, which can be found on: https://github.com/datamachine/twx.botapi
- Some parts of the software had to be censored, because it included user id's and API keys.
- Other used software should be available in the Debian software repositories.
- ui code https://drive.google.com/drive/folders/0B_4WdMvYq8ejQVptUzNnSE1iUVU?usp=sharing
- note that some of the ui code might be missing due to last minute debugging, also it includes the entire framework of rails
User Interface
The Ruby code for the UI receives three inputs from the data processing software: two integers, one being the current beats per minute the other being a value to indicate something noteworthy (ex. high change in beats per minute or very low or high bpm). The third input is an array containing the beats per minute history, containing the beats per minute of the last hour. These three inputs will be displayed on screen, the current beats per minute will be visible in the top left corner and next to it the noteworthy message, if available. Directly below this a graph shall be shown displaying the history of the beats per minute.
The program reads out the text files containing the previously mentioned inputs. The bpm can be directly used for the output since the string contains exactly the data which should be displayed (excluding the layout). The value error value shall first be checked if it is 0, if this is the case the value means there is no error to display, meaning the patient is fine and no warning was to be displayed. However if the value does not equal zero the code will get the corresponding html file containing the warning which should be displayed. The last part of data to be processed is an array, which is used for the graph. For this a code was used which could not be tested (due to an unexplained error). It would use the array to create a jpeg file containing the graph. This is done by taking each part of the array, which represents a bpm form x time ago, and links it to its corresponding time. (at first to time ago but preferably based on the current time, so instead of 2 hours ago it would say at 12:00) Then it would combine the two to create a jpeg with a graph.
Project conclusion
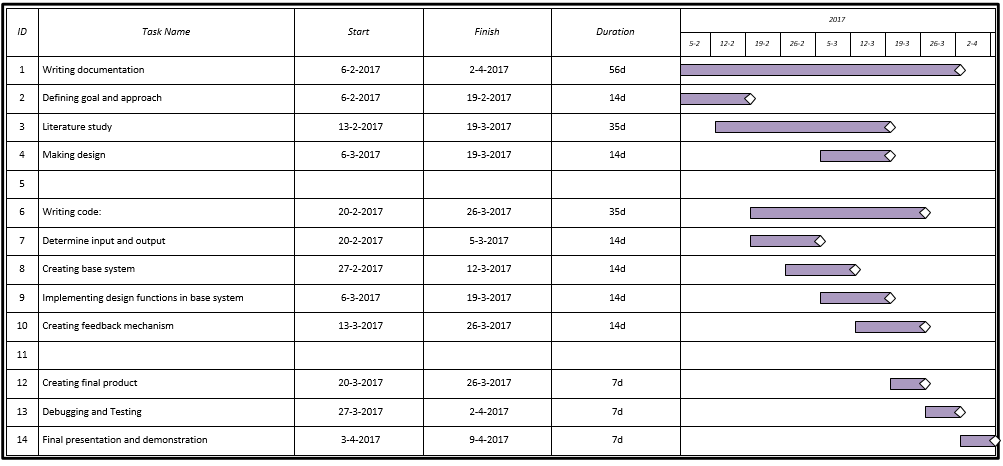
After 8 weeks of participating in the 0LAUK0 – robots everywhere project, we want to take a step back and review what we have been working on for the past two months and what we should have done differently, looking back.
The first three weeks of the project we had trouble focusing our project sufficiently. We started off with the idea of creating a smart home focused at the elderly, to ensure a longer life in their own home. We wanted to do a literature research but also to create something. First, we wanted to create a scale model smart home with some integrated functions, but changed this plan after realizing that this would cause our workload to be too big. It was decided to build an user interface instead, and to focus our project around the “smart heart”, as we named our smart heartbeat sensor.
The refocusing of our project cost us quite a lot of valuable time but of course this paid off, as now we had our idea straight and could get to work. We started with literature research and expanded this study whenever we found new things that had to do with our technology. For instance, we researched heart measurement technology, signal analysis software for ECGs and legal liability for our technology. Also, we attempted to conduct a user research amongst elderly and their caretakers, in order to find out their preferences that could be included in the requirements of the design. Sadly, elderly homes did not allow us to conduct the research on their premises. Therefore, we had to digitalize our questionnaire and spread it via Facebook. It did cost us quite a lot of time to attempt to be allowed to interview the elderly at elderly homes.
After determining our design requirements somewhat too late in the project, we started to build the user interface. The chosen platform for this was a web app. We had developed quite a large part of this web app, but then ran into some technical difficulties that we have not been able to resolve until this day. If we could do this part over, we would choose a different programming language that is easier to program in, even if that causes the user interface not to look as good as it would in a more advanced programming language.
The server part of our project, that would take in a signal, process it and pass the information on to the user interface was finished but we could not demonstrate this, as the input signal (a heartbeat) could not be measured and the output could not be shown due to the technical difficulties in the user interface. Another thing that we would do different if we did this project again is to work either more on the practical aspect –and less on the literature research- or not at all on the practical aspect and spend more time on our theoretical design. This would improve the quality of the overall project.
In the end, we have produced a rather extensive literature research and design of our proposed technology. The idea for this project and its focus has changed multiple times throughout the project, from smart home to smart heart; from small literature study and large practical part to extensive literature study and small practical part. Choosing our main focus in an earlier stage and keeping to this focus would have benefited the project a lot.
Further implementations
Signal analysis
As mentioned in the section “Electrocardiography” signal analysis and comparison is way too much work. However with signal comparison much more information can be obtained from the heart than with just the heart rate, so this could be implemented in the future to improve the system. With signal analysis deviations in the ECG, which indicate a heart attack, a heart block or pain on the chest, can be detected.
Current methods in ECG characterization Right now, there already is some software that can detect and analyze subtle changes in the electric potential patterns of the heart, that are indicative of the disease that the patient is suffering from. Various computer aided cardiac diagnosis (CADC) systems are up to this task already. Only nonlinear methods can capture these small variations in the ECG signal.[19] Nonlinear methods, here, are signal processing algorithms that are not preset to certain parameters but can adapt over time to what is ‘normal’ for a specific patient. These methods involve a large share of artificial intelligence.[20]
One of these systems is developed by Medtronic and called the TruRhythm detection system. On their website it is claimed to be “A smart detection algorithm that streamlines data” using smart filtering and self-learning. This software also includes an interface that claims to reduce signal reviewing time by 56%. This is believed to make a nice pair with our current idea for smart heart technology. The algorithm detects changes in the regular heart signal pattern and is able to draw conclusions based on these changes.[21]
An active elderly
With the current designed system, the difference between an elderly who is exercising or who has a problem with his heart cannot be determined. This is a disadvantage of the system, but could be solved by the signal analysis, which is mentioned above.
An analysis of the raising heart rate can also be used to detect this difference. When the heart rate gradually increases, it can be assumed that the elderly is exercising. When the heart rate suddenly increases very hard, it can be assumed that the elderly has heart problems.
Another option could be to implement a motion sensor in the system, which can check if the increasing heart beat is due to exercising.
Locating the elderly
The current designed system only works in the home of the elderly. When elderly are outside their home, it is not possible to send an alarm. This could be solved by adding a GPS tracker in the system. However, with a GPS tracker there may arise a privacy problem.
Appendix A: questionnaire
In order to gain proper information in what elderly think of the heart sensor, a survey is held under elderly and care takers. The survey can be found underneath (the survey is in dutch, as it is held under dutch citizens):
1. Bent u verzorger of oudere?
- Verzorger
- Oudere
2. Wat is uw geslacht?
- Man
- Vrouw
3. Wat is uw leeftijd?
Deze enquete gaat over een slimme hartslagmeter. Deze hartslagmeter kan in uw kleding zitten, pacemaker (als u die heeft) of in uw horloge. De komende vragen hebben betrekking op functies die kunnen worden geïmplementeerd in de hartslagmater. Bent u een verzorger, ga dan door naar vraag 17.
4. Heeft u last van hartklachten, of heeft u een pacemaker?
5. Bent u geïnteresseerd in het meten en zien van uw eigen hartslag en waarom?
6. Hoe zou u het vinden als er een hartslagmeter continu uw hartslag in de gaten kan houden?
7. Zou u het fijner vinden als deze hartslagmeter gelijk hulp belt wanneer er geconstateerd wordt dat dit nodig is?
8. Wilt u ook een functie hebben op de hartslagmeter om hulp op te roepen wanneer u zich niet lekker voelt?
9. Zou u langer thuis blijven wonen of hebben gewoond als u een slimme hartslagmeter zou hebben?
10. Zou u eerder alleen uit huis gaan wanneer u een slimme hartslagmeter om zou hebben (om bijvoorbeeld boodschappen te doen of om een wandeling te maken)?
11. Zal u zich veiliger voelen wanneer er met een hartslagmeter continu uw hartslag in de gaten wordt gehouden?
12. Zal u het toestaan voor uw verzorger, thuiszorghulp of familie om van een afstand uw gezondheid in de gaten te houden?
13. Zou u zich er fijner bij voelen wanneer uw verzorger, thuishulp of familie alleen een signaal binnen krijgt wanneer er een afwijking is in uw hartslag, in plaats van een signaal wat ze altijd binnen krijgen?
14. Wilt u zelf controle houden over de hartslagmeter, bijvoorbeeld wanneer hij wel een signaal moet doorgeven en wanneer niet?
15. Wanneer er onregelmatigheden plaats vinden in uw hartslag, vindt u het dan fijn als uw familie automatisch gealarmeerd wordt of niet?
16. Heeft U nog overige opmerkingen of ideeën? De komende vragen zijn alleen voor verzorgers. Bent U een oudere, dan kunt U hier stoppen met deze enquete.
17. Wat vindt u van de technologie dat ouderen met een slimme hartmeter rondlopen?
18. Denkt u dat met deze technologie ouderen langer zelfstandig thuis kunnen blijven wonen?
19. Denkt u dat deze technologie een bijdrage heeft aan de veiligheid van de ouderen?
20. Met deze hartslagmeter is het ook mogelijk dat u de hartslag kunt checken. Heeft u dan de voorkeur om deze constant te kunnen bekijken of alleen wanneer er afwijkingen ontstaan in de hartslag?
21. Via welke apparaten wilt u de hartslag kunnen meten?
22. Denkt u dat deze technologie uw werkdruk verlaagt?
23. Gaat u deze technologie aanraden wanneer het eenmaal op de markt is verschenen?
24. Heeft u nog overige opmerkingen of ideeën?
Appendix B: logbook
The logbook uses the following abbreviations for the names of the groupmembers:
- JB: Jeffrey Baijens
- ME: Margot Emke
- JE: Jari van Ewijk
- MK: Marjolijn Kleijer
- BL: Bram Lustenhouwer
- WW: Wouter Wolthuis
Week 1
- Brainstorming regarding the idea for this project and its feasability.(all)
- Create a presentation to present our idea in week 2. (WW)
Week 2
- Present our ideas and make the idea more concrete, as we received feedback that the idea was way too broad for the duration of this project.(all)
- Create another presentation to present the new version of our idea in week 3. (MK, ME)
- Figure out how to edit the wiki page and add our idea for the project to the page. (all)
- Start of literature research regarding smart homes and the elderly (ME, MK, BL, JB)
- research upon different ui possibilities (WW)
Week 3
- Present our final version of the idea and work on the feedback that we received, as the idea that we had condensed before was still too broad.(all)
- Continue literature research, this time with a focus in the smart heart and healthcare region.(all)
- Update wiki.(all)
Carnaval break
- Work on the questionnaire that will be used to get the user preferences from the elderly and their caretakers. (BL)
- Establish first contact with elderly homes.(BL, ME)
- making very basic set-up for ui (WW)
Week 4
- Maintain contact with elderly homes, contacting some more elderly homes. (ME, BL)
- Determining some of the user needs from literature research. (MK)
- Preparing the raspberry PI for this project, research and installing software. (JE)
- making display a warning message (WW)
Week 5
- Literature search about heart problems. (MK)
- Preparing the Raspberry Pi to act as the "control unit" of the prototype, working on some software that check for inputs, can process these inputs and take appropriate actions. (JE)
- Finalize questionnaire and put it online. (ME, BL)
- Visit an elderly home to hopefully be allowed to interview the elderly or caretakers (ME, BL)
- Research state of the art for wearable devices. (JB)
- Maintain contact with some of the elderly homes. (ME)]
- coding layout (WW)
Week 6
- Research advantages and disadvantages of a heart sensor. (BL)
- Research state of the art in heart measurements. (JB)
- Research heartbeat sensor types and ways to send & receive data. (BL)
- Work on RPCs. (ME)
- Change wiki from smart home to smart heart. (MK)
- Research responsibility. (JB)
- Worked on processing recieved data (WW)
Week 7
- Worked on finding user needs from the questionnaire. (ME, BL)
- Worked on getting a more concrete plan for the demo in week 8. (JE)
- Finished the state-of-the-art on the wiki. (MK)
- Find a way to process measurement data and transform that to a graph for the UI. (WW)
- Create a prototype for the user interface in indesign. (JB)
- Continued work on the raspberry PI. (JE)
- Created a telegram bot that can send alarm messages when necessary. (JE)
Week 8
- Added a piece of information about cyber security. (BL)
- Worked on the further implementation of our project. (ME, MK)
- Changed logbook to a new format. (ME)
- Worked on creating the final presentation and demo. (BL, JB)
- Worked on user interface (WW)
- Worked on integration of user interface and raspberry PI software (WW, JE)
Week 9
- Worked on design choices for project prototype (ME)
- Worked on signal processing methods (ME)
- Discussed peer review (ALL)
- Checked full wiki (ALL)
- Cleaned up chapter locations and figures in the wiki (MK)
- Worked on User interface for the elderly & caregivers (JB)


