From Control Systems Technology Group
Jump to navigation
Jump to search
Further Testing
Experiment 2
Results A
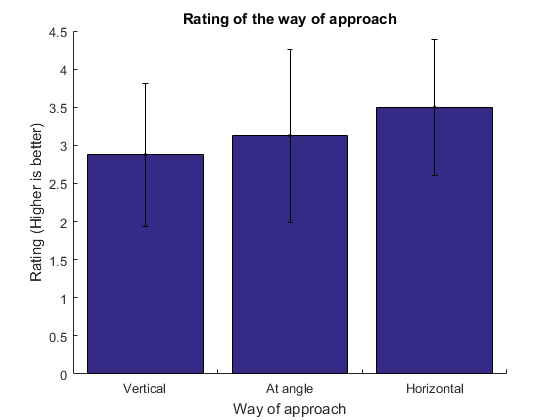 Figure 3: A bar graph of the three ways of approaching
| Experiment
|
Very bad
|
Bad
|
Neutral
|
Good
|
Very good
|
| 1A
|
|
X
|
|
|
|
| 2A
|
X
|
|
|
|
|
| 3A
|
|
X
|
|
|
|
| 4A
|
|
|
|
X
|
|
| 5A
|
|
|
X
|
|
|
Results B
Figure 3: A bar graph of the three ways of approaching
| Experiment
|
Very bad
|
Bad
|
Neutral
|
Good
|
Very good
|
| 1B
|
|
|
|
X
|
|
| 2B
|
|
|
|
X
|
|
| 3B
|
|
|
|
X
|
|
| 4B
|
|
|
X
|
|
|
| 5B
|
|
|
|
X
|
|
Results C
Figure 3: A bar graph of the three ways of approaching
| Experiment
|
Very bad
|
Bad
|
Neutral
|
Good
|
Very good
|
| 1C
|
|
|
|
X
|
|
| 2C
|
|
|
|
|
X
|
| 3C
|
|
|
|
X
|
|
| 4C
|
|
X
|
|
|
|
| 5C
|
|
|
X
|
|
|
