Group2 19-1 Week5: Difference between revisions
No edit summary |
No edit summary |
||
| Line 57: | Line 57: | ||
{| | {| | ||
|- | |- | ||
! | ! | ||
! scope="col" width="width:20em;" |Volume | ! scope="col" width="width:20em;" |Volume | ||
! scope="col" width="width:20em;" |Weight | ! scope="col" width="width:20em;" |Weight | ||
| Line 223: | Line 223: | ||
{| border="1" cellpadding="2" | {| border="1" cellpadding="2" | ||
|---- | |---- | ||
! | ! | ||
! scope="col" width="width:20em;" |t(1/2) (a) | ! scope="col" width="width:20em;" |t(1/2) (a) | ||
! scope="col" width="width:20em;" |ρ (kg/L) | ! scope="col" width="width:20em;" |ρ (kg/L) | ||
Revision as of 14:31, 6 October 2019
How long does the mission need to last?
Europa could possibly be regarded as being spherically symmetric, were it not for Jupiter’s strong gravitational influence on her. Many processes are probably highly influenced by Jupiter, either positively or negatively. Since we don’t know for sure what processes can sprout life and/or how those processes are influenced by external gravity, it can be interesting to search for life both on the Jovian and the Anti-Jovian side of Europa.
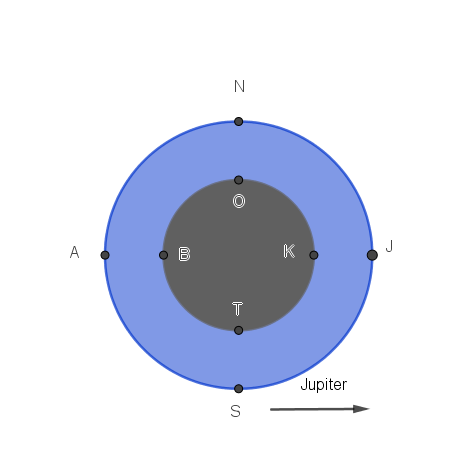
Regard the picture to the right. The surface points indicate the surface of the ocean, below the crust, and are noted as Jovian (J), Anti-Jovian (A), North (N) and South (S). The seafloor points have the same letters, shifted 1 forward. To search the Jovian and Anti-Jovian poles, the lines AB and JK make the most sense. Have the submarine sail across these lines and take a sample every so often. To travel between these lines, the semicircle BOK or BTK seems most logical because the radius of these circles is the smallest possible. The total route ATOKJ is 4700 km. However, that does require that the submarine can remain at seafloor levels of pressure for extended periods of time (on the order of years). To avoid this, the route ATANJK can be taken. This one, however, is 5320 km. The observant reader may have noticed that 5320 km is A LOT. A car driving on the Dutch highways will have to drive from Groningen to Maastricht and back almost 8 times. This will take roughly 60 hours. Bathyscaphe Trieste (the first submersible to reach the bottom of the Challenger Deep) submerged and resurfaced with an average speed of 0.9 m/s, with which it would complete the journey in 68 days, ignoring the fact that Trieste could only go up and down. The Trieste submersible had a mass of 14 metric tons. This is obviously much too big. However, it was made to harbor 2 people and protect them from the immense pressure, which we don’t need. The inside pressure needs only be small enough that the equipment can still function. On the other hand, our submersible needs to withstand double the pressure that Trieste did. Furthermore, Trieste used gravity to sink and rise, which is much lower on Europa. All in all, the maximum diving speed of the submersible may cap out well below 1/10 of Trieste’s speed. Furthermore, the lateral speed of the submersible is probably even lower, due to complicated driving systems. Since the exact velocity of the submarine is difficult to estimate precisely at this point, we will accept this 0.05 m/s as the actual top speed. At this velocity, the long route takes 3.37 years, and the short route ‘only’ 2.98 years. Only going back and forth between the ice and the seafloor takes 70 days. This is a total distance of 300 km. Please remember that this is calculated in a straight line, completely ignoring the fact that the route straight down may not be possible due to obstructions, or desirable due to interesting finds along the way. All this also disregards the dig down to the sea. Valkyrie achieved a velocity of 0.9 m/hr. This means it would take 46 days to dig through the crust. Combine this with a startup time, communications check, and pre-disembarking measurements, and the total time before setting off could easily be 60 days. Considering the interest in both the Jovian and anti-Jovian poles of Europa, the ATOKJ is likely most useful. To allow for deviations, we will add an estimated 41% length to the route; this will allow a deviation off the route of 45 degrees at all times. At an average speed of 0.05 m/s, this will take an estimated 1538 days, or 4.21 years. Add the 60 days to get 4.4 years. Plus some room for error, we’re looking at a mission of between 4.5 and 5 years.
Navigation
Going up and down by making the total density equal to water, but adding a piston filled with a fluid that is just slightly more compressible than water to the outside of the submarine.
Parts list
Surface base:
- Fixation stuff
- Power source
- Communications
- Emitter
- Receiver
- Research equipment
- Seismometer
- Spectrometer
- Camera
- Gas emission experiment tools
Digger:
- Digging stuff
- Power source
- Shielding
- Battery
- Accelerometer
- Fixation stuff
- Communications
- Emitter
- Receiver
- Cable
- The cable is with the digger to avoid having to drag all that length of cable all the way through the ice, and to make sure that it's possible to unroll the cable
Submarine:
| Volume | Weight | |
|---|---|---|
| Barometer | d=4 cm, r=5 cm | ~50 g |
| Propulsion | ||
| *Up-down | ||
| *Sideways | ||
| Gyroscope | in computer | negligible |
| Accelerometer | in computer | negligible |
| Research equipment | ||
| *Gas emission | ~30x30x30 cm | ~2.5g |
| *Camera x2 (each) | 6.2x4.5x2.8 cm | 100 g |
| *Spectrometer | 6x8x2 cm | 100 g |
| Pressure-resistant hull | ~15 cm external | dependent on dimensions |
| Power source (100 W?) | 9 cm3 | 170 g |
| *Shielding | 0.51 cm | 200 g |
| *Reloadable battery | new prototype battery has power density of 10 microwatts per cubic centimeter, so for 100 W size of 10 m3? | |
| Cummunications | ~10x5x5 cm | ~200 g |
| *Emitter | ||
| *Receiver | ||
| Method to sample water | 1 L | 2 kg |
| Lights | 0.06 m3 | 1 kg |
| Computer | 1 L | 3 kg |
Model for digging through the ice
In this case it is important to consider the balance between influx and outflux of energy. The digger needs to heat the ice in front of it enough to melt and possibly vaporise it, and the ice around it to allow the water to pass it by. At the same time, the surrounding ice tries to take away energy, preventing the water from freezing. Because QuickField cannot model phase changes, we will be approximating the phase changes by a temperature difference. The latent heat of fusion of ice is 334 kJ/kg. At 0 degrees Celcius, ice has a specific heat of 2.050 kJ/kg K. Dividing l/C_v gives ΔT=334/2.050=163 K. Latent heat of fusion solids Ice specific heats That means that in the model, temperatures between 0 and 163 degrees Celcius correspond to a phase change between ice and water. Below 0 degrees is pure ice of temperature T, and above 163 degrees is pure water of temperature T-163. Three pictures made are shown below:
The pictures display a source in the front of the digger, with a total output of (from top to bottom) 1, 4 and 10 kW. Furthermore, the isotherms in the picture are spaced by 163 degrees Celsius, starting at -163 degrees. That means that the outermost isotherm indicates still far below freezing temperatures, but the 2nd and 3rd outermost isotherms indicate the lower and upper edges of the freezing regime.

This shows that at 1 kW, the digger is unable to melt any of the surrounding ice. At 4 kW it is visible that a small layer just in front of the digger will melt completely.
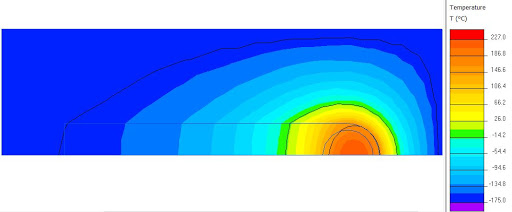
However, as the digger would progress and this water would flow to the back of the digger, it will quickly return to the half-molten regime. It is only at 10 kW that we see the digger form a significant layer of fully molten water around it, with a thickness of between 10 and 20 cm.
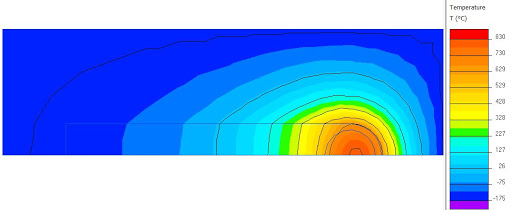
However, not even halfway down the length of the digger, all this water will refreeze. As shown in the next picture, to warm the entire digger 100 kW is required. This is obviously a lot, and based on the model a large portion of the equipment would reach absurd temperatures. Furthermore, in the model, convective processes are neglected so the actual necessary energy could even be a factor of order 1 larger or smaller.
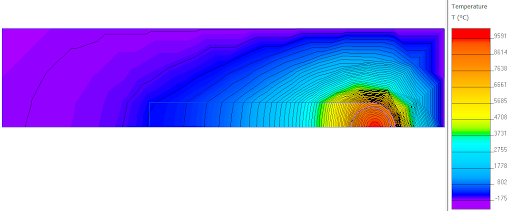
To overcome this, a very small, long heat source along the length of the digger is proposed. In this case, the same water layer can be established, but with only 20% the total power: 10 kW for both sources. Mind you that this power source is a hollow cylinder.
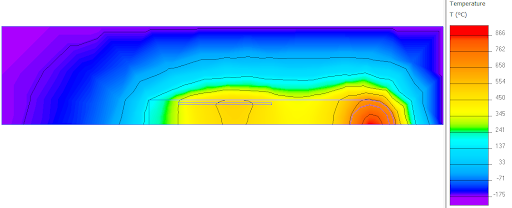
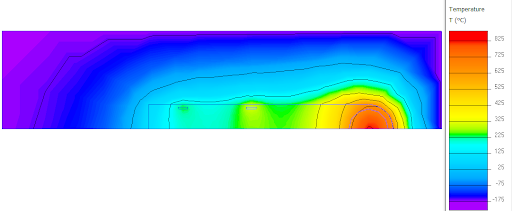
The last configuration is one in which the cylinder has been replaced by two rings that produce 4 kW each.
Furthermore, from the power output of the source, the maximum speed of the digger can be determined. This is based on the amount of ice in front of the digger that it can melt per second. The energy H required per kilogram of ice to melt it is equal to: H = lf+Cv*ΔT, where lf is the latent heat of fusion, the energy required to induce a phase change, Cv the heat capacity and ΔT the temperature difference to be established. for ice, lf=334kJ/kg, Cv=2.05kJ/kg/K and in the case of Europa ΔT=50 -- 200 = 250K at least. The lower temperature boundary is the lowest temperature we expect to encounter on Europa, whereas the upper temperature boundary is there to ensure that the water stays molten for a while. This temperature difference will likely decrease as the digger gets deeper into the crust, because the ice warms up slowly. However, in the worst case this will allow the digger to go somewhat faster. The total energy then becomes H=334+2.05*250=846.5kJ/kg. The energy per unit volume can be determined from the density of ice: 920 kg/m3, resulting in 778780 kJ/m3. The digger’s speed v can be calculated by dividing the total power used to melt the ice directly in front of it P by the energy required per unit volume H and the total frontal area of the digger A. The latter is equal to π*r2, where r is the radius of the digger's cylindrical part. v = p/(H*π*r2) For instance, at 10 kW and a radius of 25 cm, the velocity of the digger becomes 65 μm/s. At this velocity, the digger would take about 4.8 years to dig 10 km. At 1 MW effective power, this is reduced to a much more manageable 17.7 days.
Scaling up the power source
Considering the amount of power required for the digger, accounting for losses is a luxury not available to us. Hence, the heat production should be done as close to the place where it is needed, namely in front of the digger. An additional advantage of this is that it will weigh the digger down, meaning it may push itself through the ice a little faster. RTG source selection (If not mentioned otherwise, radioisotope data in the remainder of this section is derived from this document.) There are several consideration to be made when selecting a power source for an RTG:
- Sufficient (power) density
- Sufficient duration
- Right type of radiation
- Non-critical
(Power) density
In particular in space missions, the power density of the source is important. For instance, it is possible to get a block of Am241O2 that produces 10 kW, but at a power density of .097 thermal Watts per gram, this block would weigh 103 kg. As a comparison, Am2442O2 has a power density of 2.01 Wh/g, resulting in 10 kW of power at only 4.98 kg. Furthermore, the material's density itself matters as well. To illustrate: Cs137Cl has a power density similar to Am241O2, but not 1/3 the density. As a result, a block of Cesium Chloride must be 3 times as large to produce the same power as a block of Americium Dioxide, whereas both blocks have about the same mass. Thus, the perfect power source should have a large enough power density to decrease its mass, as well as a high enough mass density to decrease its volume. The mass of the power source is equal to the desired power divided by the power density. This mass should be divided by the mass density to find the volume of the power source.
Duration
One disadvantage of RTGs is that due to the decay of the radioactive source, the power of the source slowly decreases over time. An isotope with a sufficient half-life should thus be chosen accordingly. Consider 3 isotopes:
- Uranium-235, with a half-life of 8.9*10^8 years Uranium half-life
- Plutonium-238, with a half-life of 87.74 years
- Cerium-144, half-life of 284.4 days.
The activity of isotopes is proportional to the number of isotopes. In particular: A(t) = A(0)*2(-t/t(1/2)) with A(0) the initial activity (to which power production is proportional) and t(1/2) the half-life of the radioactive source. Filling in the half-lives for t = 7 years, a rough estimate of the travel time to Europa, results in activities at the time of arrival of 1, 0.946 and 0.00198 times the initial activity for U-235, Pu-238 and Ce-144 respectively. This goes to show that an isotope like Cesium-144 would reduce in power by 99.8% over the course of the journey to Europa. To achieve a power of 10 kW upon arrival, the initial power source must then be 5 MW. This power requires a 200 kg Ce source. Uranium and Plutonium, on the other hand, retain most of their activity over the course of the mission. However, this would imply that Uranium would be a better source than Plutonium. This is not the case. Even though the activity of U decreases more slowly than Pu, the activity of Pu is higher than U. This can be understood by realising that U has a longer half-life ‘’because’’ it decays slowly. If it decayed faster, all the atoms would deplete in a much shorter timespan. There is a general inverse correlation between activity and half-life. As a result, the half-life of the perfect isotope is too high nor too low, preferably about an order of magnitude greater than the duration of the mission. The power density upon leaving earth can be calculated as follows: P(t) = P(0)*2(-t/t(1/2)).
Type of radiation
Now we shall consider the type of radioactive decay that the perfect radioactive source undergoes. To avoid radioactive contamination of environments or the destruction of on-board equipment, it is important to shield the radioactive source. At the same time, due to weight considerations, it is also important that said shielding is not too thick. To achieve the latter, the right type of radiation has to be chosen. Of the four main types of decay - alpha, beta, gamma and neutron - alpha is by far the most easy to mitigate, with air half-value layers of the order of cms. Hence, it also makes sense to choose a radioactive source that decays via alpha radiation. Examples are Plutonium-238 and Curium-244.
Non-critical
Lastly it is important that the mass of the radioactive isotope does not exceed its critical mass. If a hunk of the isotope exceeds the critical mass, the decay of atoms in the isotope will accelerate the decay of other atoms in the isotope, causing a runaway chain reaction like the ones that occurred in Tsjernobyl and Fukushima, like the ones that are induced in nuclear bombs. If the mass is kept small enough, or the geometry is chosen efficiently, the atoms don’t interact with each other as much and the chain reaction will remain under control. These comparisons hopefully suffice to illustrate why a runaway chain reaction is undesirable. The considerations to be made are as follows:
- ’’High critical mass of the isotope’’: This allows for a larger amount of isotope to be taken along on the mission.
- ’’Geometry’’: As in a spherical configuration the atoms are most densely packed together, the critical mass is lower in a sphere. Critical masses
The best power source
Below is presented an overview of the most promising radioactive sources, with from left to right their half-life, power density, mass density, critical mass, P0, mass, volume, attenuation layer. To determine what source is ‘most promising’, the right principal type of radiation and the right half life of some isotopes were picked from the article on RTG source selection mentioned in the beginning of this section. Most information was gathered from that article as well. To determine the attenuation layer, the lead layer thickness required to reduce the gamma dose (alpha does not transmit through lead at all) at 1 m to .1 mSv. In this article (Curium attenuation), the shield required to meet precisely that condition is given for Curium with lead. For other sources this information appears impossible to find. Thus, to get an order of magnitude estimation of the other materials, we will be using the ratio between this value and the values listed in the article on RTG power sources. With an attenuation thickness for Cm-244, this ratio is 2.155. Results are in the table. Curium mc Plutonium mc Americium mc and density The isotopes chosen were Curium-244, Plutonium-238 and Americium-241.
| t(1/2) (a) | ρ (kg/L) | ρw (W/kg) | mc (kg) | P(0) (W) | m (kg) | V (L) | r (dm) | d (dm) | ml (kg) | |
|---|---|---|---|---|---|---|---|---|---|---|
| Cm | 18.11 | 13.51 | 2840 | 20.07 | 13072 | 4.6 | 0.341 | .433 | 1.1 | 167.4 |
| Pu | 87.74 | 19.33 | 560 | 8.2 | 10568 | 18.9 | 0.976 | .615 | 0.0547 | 3.224 |
| Am | 432.0 | 13.66 | 110 | 56.4 | 10113 | 91.93 | 6.73 | 1.17 | .3832 | 102.1 |