PRE2016 3 Groep8: Difference between revisions
No edit summary |
|||
| Line 535: | Line 535: | ||
[15] http://www.diabetes.co.uk/blood-glucose-meters/iso-accuracy-standards.html | [15] http://www.diabetes.co.uk/blood-glucose-meters/iso-accuracy-standards.html | ||
[16] https://www.dvn.nl/files/site/DVN%20Acceptatie%20jan%202015.pdf | |||
[17] https://www.dvn.nl/files/site/DVN%20Zorgwijzer%20Jongeren.pdf | |||
[18] https://www.dvn.nl/files/site/DVN%20Kinderen%20feb%202014.pdf | |||
[19] https://www.bbcgoodfood.com/howto/guide/how-eat-diabetes-top-10-tips | |||
[20] https://www.sugarkids.nl/diabetes/eten-en-bewegen | |||
[21] https://www.diabetesfonds.nl/over-diabetes/dagelijks-leven | |||
[22] https://www.stichtingdon.nl/diabetes-type-1 | |||
Revision as of 17:16, 19 March 2017
Student Numbers
- 0957735 Ainse Kokkelmans
- 0895428 Joris Veens
- 0955135 Jolien van der Thiel
- 0957168 Joris Verhagen
- 0960769 Ineke Kil
- 0959019 Bjorn van Rixtel
Problem definition
More than 1.2 million people in the Netherlands have diabetes. That is about one out of every fourteen people and everyday about 169 people are newly diagnosed. [1] Although it is treatable with medicines or insulin, it is a chronically disease you are confronted with everyday. Depending on the type of diabetes, people have to insert insulin three times a day, around every meal. A diabetes patient always has to keep track of the number of grams of carbohydrates that have been consumed. On the basis of a formula, it can be calculated how much insulin is needed to keep ones blood sugar level on healthy terms. However, this is a standard formula for everyone and throughout your own life it also differs how much extra insulin is needed for every gram of carbohydrates. This formula should actually differ for every person and change from time to time. It is also quite some work to always keep track of the food or carbohydrates you have eaten, especially for a plate full of hot steaming food...
Our Solution
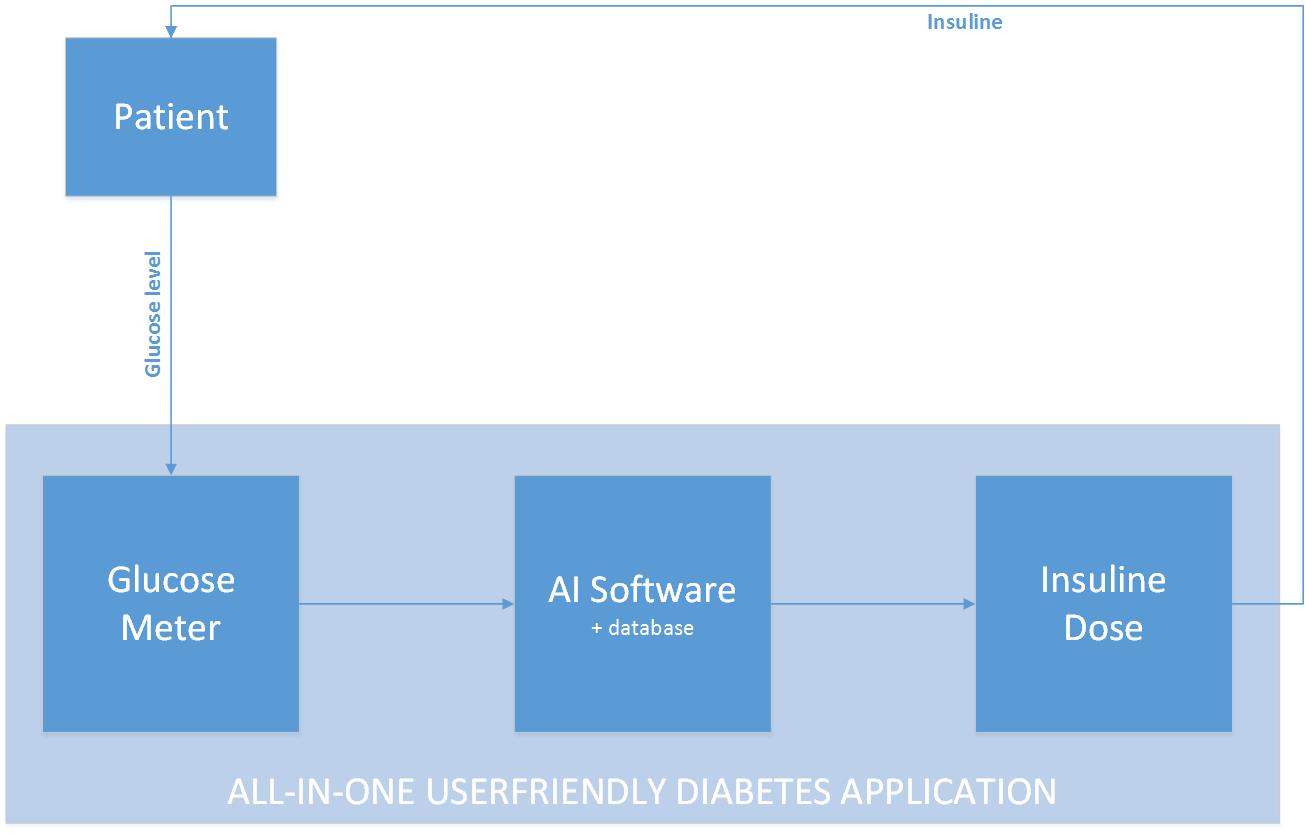
Our goal is to optimize the formula which calculates the amount of insulin a person with diabetes needs. The optimization will be tested by a diabetes application (web-app) which we will make ourselves. Our concept idea can be visualized in the figure below. We want to create an all-in-one user-friendly diabetes application which enables a patient to get a right personalized dose of insulin in an easy way. Instead of monitoring a patient all day long, we want to develop an algorithm that is based on and learns from the feedback it gets.
Because of most people have a kind of a fixed day rhythm, an algorithm could recognize this after some time and adapt to this. The adaption is based on the feedback that the software will get. This is the glucose level of the blood, after a period when insulin was injected. The glucose values always have to be in a certain range. And by coupling the data from the amount of insulin injected and the glucose level afterwards, the algorithm could learn to “know” somebody, because not everyone reacts the same on a certain amount of injected insulin. By receiving feedback over a longer period, the algorithm learns to recognize someone’s behavior too. Because of most people have a weekly fixed day schedule and for instance mostly sport on Monday, the algorithm could learn by making use of the feedback it will always need to give more insulin on Monday.
At the start of using the application you have to fill in what you have eaten on a day and your blood glucose level for a longer period. From this information the algorithm learns what your blood glucose level will be depending only on what you have eaten on a day. This information will be used to let the user know how much insulin must be inserted.
This piece of artificial intelligent learning software, has the possibility to be for instance implemented in an insulin pump, which is something a patient definitely has to wear all the time. Because of the fact that the algorithm learns to know it’s patient by receiving feedback in the form of training data it will calculate a personalized and therefore better and healthier dose of insulin that has to be given by the pump. The only thing the user has to do is measure it’s glucose level and eventually indicate a deviate day.
Additionally, the input of what you have eaten should be simple. This can be done with text. The program also remembers what you often eat at a certain time of the day, so if you want to fill in what you have eaten you receive suggestions of specific meals or snacks.
As extra help the application could be linked to a kitchen scale with Bluetooth. If you scoop up dinner on your plate while it is on the scale the application immediately knows how much grams of a certain kind of food you are going to eat. What the food that the user is weighing is, can be selected on the smartphone application. But since our main goal is the optimization of the formula, with the application only as a test tool, we will not look further into this.
To test the developed software we’ll make a web-app and “train” it with the year data of one of our group members. For us it is not possible to implement this for instance in a real insulin pump, but by making the app, we could have I look if it works or not. Furthermore we could investigate more in opportunities and possibility’s the implement our solution in real live existing and user friendly systems.
State of the Art
Artificial Intelligence Systems in Diabetes
Currently the most known AI approach in diabetes is the approach from PEPPER [8] (patient empowerment through predictive personalized decision support). PEPPER is a newly launched three-year research project, funded by the EU Horizon 2020 Framework. It’s goal is to create a portable personalized decision support system to empower individuals on insulin therapy to self-manage their condition. PEPPER employs CaseBased Reasoning to advise about insulin bolus doses, drawing on various sources of physiological, lifestyle, environmental and social data. It also uses a Model-Based Reasoning approach to maximise users’ safety.
Case-Based Reasoning (CBR) is a consolidated artificial intelligence technique, extensively applied in medicine, that tries to solve newly encountered problems by applying solutions learned from similar problems encountered in the past.
The system will be integrated with an unobtrusive insulin patch pump and has a patient-centric development approach in order to improve patient self-efficacy and adherence to treatment.
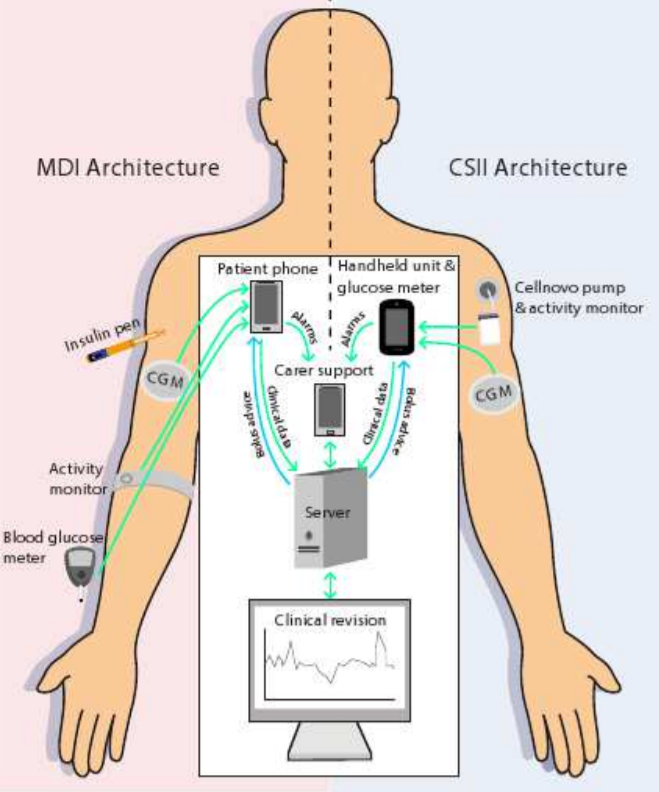
In the figure below, two architectures can be seen. These methods principally don’t differ quite much. In a nut shell, the PEPPER systems provide a portable personalised decision support system for insulin dosing that combines data from multiple sources such as body-worn sensors and manual inputs. These body-worn sensors for instance are the activity monitors that can be seen in the picture above. The manual inputs are given to the system by making use of a phone or handheld and consist of personal inputs like for instance the time someone sported, the amount and kind of food someone ate or the whether or not consumption of alcohol. The CaseBased Reasoning module is designed to provide a personalised insulin dose which adapts over time.
Another, similar apprach of AI in diabetes is the METABO [11] approach. The METABO approach is a diabetes monitoring and management system which aims at recording and interpreting patient's context, as well as, at providing decision support to both the patient and the doctor. The METABO system consists of (a) a Patient's Mobile Device (PMD), (b) different types of unobtrusive biosensors, (c) a Central Subsystem (CS) located remotely at the hospital and (d) the Control Panel (CP) from which physicians can follow-up their patients and gain also access to the CS. METABO provides a multi-parametric monitoring system which facilitates the efficient and systematic recording of dietary, physical activity, medication and medical information (continuous and discontinuous glucose measurements).
Based on all recorded contextual information, data mining schemes that run in the PMD are responsible to model patients' metabolism, predict hypo/hyper-glycaemic events, and provide the patient with short and long-term alerts. In addition, all past and recently-recorded data are analyzed to extract patterns of behavior, discover new knowledge and provide explanations to the physician through the CP. Advanced tools in the CP allow the physician to prescribe personalized treatment plans and frequently quantify patient's adherence to treatment.
Data Mining Techniques in Diabetes [12] [13]
Data mining is the process of selecting, exploring, and modeling large amounts of data to discover unknown patterns or relationships useful to the data analyst. Medical data can be trained using data mining techniques to predict the diabetes. For this, dataset has to be preprocessed to remove noisy and fill the missing values. The management of diabetes is very well suited to a data mining approach, because of the availability of electronic health records and monitoring facilities a huge data sets are available for research. However, because diabetes is a lifelong disease, the available data for one individual may already be huge and very difficult to interpret.
Data mining are very useful techniques consists of a variety of methods like computer science approaches as multidimensional databases, machine learning, soft computing and data visualization and statistical-based methods, like hypothesis testing, clustering and regression. Data mining can be classified in two different “goal-tasks”. First of all this is description with the purpose to extract understandable patterns and associations from data. The second goal-task is prediction with the purpose to forecast one or more variables of interest, in the diabetes case this will be the blood glucose level.
The usual way to review the outcome of a certain therapy scheme starting from the analysis to the blood glucose is to check if someone shows a cyclostationary pattern. On other words, if someone shows a daily behavior that is almost the same over the monitoring time. The blood glucose pattern summarizes the patient’s own response to a certain amount of insulin. Mostly this is visualized by plotting the blood glucose data on a 24-hour scale or by computing the frequency histograms of the blood glucose measurements.
However, the problem is that a series of blood glucose data mostly isn’t cyclic or stationary. It’s has kind of a stochastic nature that leads to confusing data. Because of this a combination of signal processing and artificial intelligence is well suited. First of all a filtering approach, known as a structural analysis needs to be applied. Structural analysis decomposes a time series into a collection of signals with known “temporal structure”. This means that each blood glucose (BG) measurement can be expressed as a sum of separate components: a trend component (T), a cyclic component (C) and a stochastic component (E), for each measurement (i).
BGi=Ti+Ci+Ei
The problem of extracting Ti and Ci can be solved mathematically in different ways, including Kalman filtering, least-squares fitting, and Bayesian smoothing. By using the same technique it is possible to also separate daily cycles from weekly or monthly cycles, which may correspond to changes in the lifestyle during the weekend or through the year. Given the availability of trend and cyclic components, it is possible to pose some interesting clinical questions: (1) is there a trend in BG data, (2) Is there one or more cyclic behavior in BG data? Even more interestingly, it is possible to combine trend and cycle information with the absolute value of BG?
Following a data mining approach, a way to answer these questions is to apply an artificial intelligence technique known as temporal abstractions (TAs). The principle of TAs is to provide an interval-based representation of monitoring data: time-stamped data are processed into time intervals during which a certain event occurs. In the case of the blood glucose monitoring it’s a useful to apply three different kinds of TAs: state TAs (high / low value), trends TAs (increasing or decreasing) and complex TAs (daily patterns). The application of TA methods can therefore be seen as a way to search for patterns in continuous monitoring data.
Existing Techniques
Since the treatment of diabetus is going on for a long time, a lot of new technologies were created for measuring the current blood sugar level of the patient and determining the necessary dose of insulin for the patient. These old and new techniques are summarised below:
Meauring the blood sugar level
- Blood sampling:
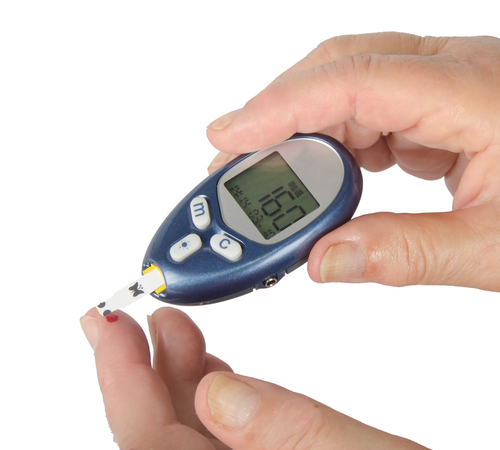
The most popular and easiest way of measuring the current blood sugar level of a patient is using a lancet. With this device, which is shown below, the patient can prick the scin to draw a small sample of blood which will be analysed by a blood glucose monitor or blood glucose test strips. In many cases, the blood glucose monitor and the lancet is one device. The blood which is sampled from the patient is directly monitored to determine the blood sugar level.
- Artificial pancreas:
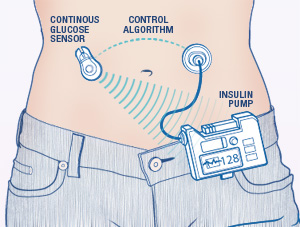
An artificial pancreas is supposed to automatically control the blood glucose level of the patient. It does this by replicating the endocrine functionality of a healthy pancreas since this system is generally not working properly for diabetes patients which is the reason why patients need the insulin doses. The artificial pancreas is implemented on the skin and, together with an insulin pump, gives an insulin dosage to the patient. There are different approaches to the "Artificial pancreas" such as the "medical equipment approach" (determining insulin dosage via closed loop control data from a continious blood glucose sensor), the "bioengineering approach" (creating a biological correct pancreas from real cells which is implemented under the skin of the patient), and the "gene therapy approach" (giving the patient a genetically changed virus which causes cells to become insulin-producing cells. In this project, the artificial pancreas is seen with the "medical equipment approach" in mind. This fits our approach to this project the best.
Determining the insulin dose
Once the glucose level is determined using one of the mentioned methods above, the patient needs to determine the insulin dose. This can be done in multiple ways as well. The most common ones are explained below:
- Manually calculating:
Manually calculating is perhaps the oldest and most common method of determining the correct insulin dose. To calculate the insulin dose, the patient needs several known variables. These are the 'blood glucose level' which can be measured and (often) displayed by the lancet, the 'target blood glucose level' which is below the measured blood glucose level, the 'carbohydrate intake' which is the amount of carbohydrates that the patient is going to eat in the upcoming meal (for which he is injecting insulin), the 'carb-to-insulin ratio' which is personalised and gives the amount of grams that are covered by one dose of insulin for the patient, and a 'correction factor' (also called the 'insulin sensitivity') which gives how much the patients blood sugar level lowers with one dose of insulin. This factor is not unique to the patient since it is an estimate, but it is different from patient to patient. With this information, the patient can calculate the number of insulin units he or she has to take for covering eaten carbohydrates using the following formula:
Insulin doses = (amount of carbs in the food)/(carb-to-insulin ratio)
To calculate the amount of insulin doses for lowering the patients blood sugar level, the following formula can be used:
Insulin doses = (current BG - target BG)/(insulin sensitivity)
If a patient has a high blood sugar level and he or she needs to eat, the patient can combine the two formulea into one which calculates the total amount of doses needed:
Insulin doses = (amount of carbs in the food)/(carb-to-insulin ratio) + (current BG-target BG)/(insulin sensitivity)
Take not that an insulin pump, as those that are used today, still depend on this way of calculating the insulin those. This means that although the insulin pump automatically gives a short-working insulin dose to the patient, it still depends on the input from the patient and simple calculations.
- Using an application:
Modern cellphones and computers can often calculate the insulin dose for the patient using an application. These applications require the exact same inputs as mentioned in the "manually calculating" part. The formula used is then also exactly the same. This means that even though cellphones and computers have a lot more calculating power than the patient has, it does not use this in calculating the correct dose of insulin. What the application does add, in some cases, are some diet recommendation and a better way to keep track of the patients blood sugar level with the use of generated graphs from the data etc.
Giving the dose to the patient
Once the correct insulin dose is calculated (in any sort of way), it has to be given to the patient. This can be done in multiple ways as well. The most common ones are explained below:
- Manually injection with a pen
By far the most common way of receiving the insulin dose as a patient is injecting him or herself with a special diabetus pen. This pen often contains a rotating disk on which the patient can determine the dose and a very small needle through which the insulin travels to the body. There are reusable and disposable insulin pens but both work in the same way and don't need any individual explanation. The insulin pen is nowadays rather affordable and paid for by the healthcare insurance in the Netherlands, which means that normal needles and syringes are not used as much as they used to.
- Using an insulin pump
A rather new technology but already in use by patients is the insulin pump. This device gives short-acting insulin. An insulin pump, which is shown on the image below, is connected to the patient by a cathether placed under the skin. When the pump is connected, the patient can receive short-acting insulin. The patient can increase the dose with buttons on the pump itself. This is to compensate the carbohydrates from a meal. The pump can also treat high blood glucose levels by taking a bolus. This is also determined by the patient him- or herself. It is important to note that the pump does not automatically correct the dose for everthing that the patient undergoes (such as meals and activities). The dose calculation is still done by the patient itself. The insulin pump has some advantages and disadvantages with respect to normally getting your insulin. These are stated below:
Advantages
The website from the American Diabetus Society gives multiple advantages [6]. The main one is that the patient does not have to bother with individual insulin injections which can really interfere with the patients life. Other advantages are:
- Insulin pumps deliver insulin more accurately than injections do.
- Insulin pumps result in fewer large swings in your blood glucose level since the doses are applied in a constant way.
- Insulin pumps allows the patient to be flexible about when and what he or she eats since the insulin pump directly corrects the insulin level in the body.
- Insulin pumps allows the patient to excercise without having to eat large amounts of carbohydrates.
Disadvantages
The insulin pump does come with some disadvantages however. These are also given by the American Diabetus Society [7].
- Insulin pumps can cause weight gain to the patient.
- Insulin pumps can be expensive (and certainly are when they are not included in the patient's insurance).
- The insulin pump is connected to the patient most of the time. This can be bothersome.
In short, although the insulin pump solves some of the problems for the patient, it does not solve the biggest one which is manually increasing the insulin dose.
- Using an artificial pancreas
The artificial pancreas is a recent technology which is still in development. The artficial pancreas takes over the endocrine functionality of a healthy pancreas. The new pancreas is supposed to create insulin for the body and ease the incidentals of diabetus for the patients.
Test App for the software and formula
Purpose of the app
We have given ourselves the task to implement the improved formula into an web-application. As mentioned above, our target group needs a stimulation to correctly start with their diabetes treatment in the beginning of their lives. We want to stimulate this with an attractive, interactive, complete/informative, and easy to use application. We have choosen for a web-app because it can not only be accessed by mobile phone but also by a laptop/computer or a tablet. The web-page can then be opened within an app which simulates an app environment without the need for two different programs. Lastly an informative web-app can be achieved by providing statistics on the patients blood sugar level and insulin doses and by generating graphs for easy-to-understand and easy-to-read information for the patient.
Attractive To make the web-app attractive, a free template is used that has a calm design so that the user does not get distracted by bright colours and an overdose of information.
Interactive The app will be made interactive in that it shows plots and gives advice to the patient. This is done because it motivates the patient to use the web-app, which makes sure that the diabetes medication will start off on the right foot (the usefulness of this has been described in chapter ABCABC), and because it gives the patient more insight about their medication and blood sugar levels throughout their lives.
Complete and informative To keep the patient motivated and to give the best advice about diet and excercise, the web-app needs a complete recordkeeping of the patient and a way to use this data in an interesting way. The user might want to see information about their blood sugar level over time or how much the insulin dose has risen on average after one year. The easiest way to show this information is in graph-form. This has to be made possible by us.
Easy-to-use The easy-to-use property that the app should have is closely linked to its attractiveness. An attractive and calm web-app has buttons where the user expects them, graphs where the user wants to see them, and desired inputs when the user actually has the information for them. We want to achieve this by using the template and by looking closely at other apps that have a function that is close to ours (whether this is medical or not is not important). When we have made a plan on where all the settings and buttons need to be, the app has to be tested in its easy-to-use property. This can be done in the last week since although making the app more easy-to-use is an important aspect, the layout can easily be tweaked in the web-app developer program.
USE Aspects
The development, success and consequences of a technology have always been shaped by the coherence between the User, Society, and Enterprise aspects in engineering. The key to developing a good technological solution is to find one that complies with the individual needs and desires of these three actors. Therefore, it is essential to create a clear image of each of them, before working towards a technological solution to our problem.
User
Different User groups (that consists of those who use the technology) formulate different desires and demands for the functioning of the technology around their needs as consumers.
- Primary users
In our case, the specific primary users that we will target, is the group of patients known to have diabetes type 1. The reason we chose this user group specifically is because they will profit the most of the solution we will develop. This is because those with this diabetes type are the most dependent on a proper estimate of their needed insulin intake, since they are incapable of producing any on their own. Furthermore, we do not intend to exclude those with diabetes type 2. Yet, since they are less dependent on such a technological solution (they do produce insulin to some extent), our primary focus will remain on type 1 diabetes patients. Our ambition is to reach and help as many diabetes patients as possible.
We expect the primary user’s needs, that shape the desires and demands of the technological solution, to be centered around three main requirements: its usefulness, accuracy and user-friendliness. Next to that, we will look into some less direct, but not unimportant requirements as well, such as: protection of user privacy and build-in safety features (for example not displaying an advice when the user input is too unrealistic).
- Secondary users
The secondary user to which this technology will apply, are the primary user’s doctors and other medical staff (such as pharmacy personnel). This User group will be in indirect contact with the technology, yet their desires and needs are of importance too.
We expect the secondary user’s needs to be centered around two main requirements: the ability to check and/or influence the direct output to the primary user (as a safety measure and for feedback on advice improvement) and the ability to look into the total collected primary user’s data (for the doctor, in order to give a more accurate medical advice for example).
- Tertiary users
The tertiary user consists of those who will be producing and maintaining the system. They are the ones that will benefit by the profits they make from investing in this technology.
Needs that we expect to apply to them are: its easy maintainability and cleaning and a high marketable value.
Society
The Societal aspect is formed around all societal problems surrounding our problem. In our case, the most predominant one is the reduced risk of heart disease, high blood pressure, strokes and pancreas malfunctions.
The societal benefit will mostly consist of lower costs in the healthcare industry by lowering the health risks of a large group of diabetes patients.
Enterprise
There are multiple enterprises that could profit from a technological solution to this problem. Developers and investers in this technology could make profit from selling it to the primary user.
Furthermore, it could also be of interest too some semi-government institutions such as "Het Voedingscentrum", which strives for a healthier lifestyle for all. Institutions such as “Het Voedingscentrum” and others that try provoking a healthy living could benefit from the research that can be done on the primary user’s collective data.
The most convenient enterprises for which this product could be of interest, are of course enterprises that already have a diabetic application on the market. These enterprises already have the experience with conceiving an CE-certification and can easily address the target group. Our application can either be a addition to their current application or can be used to improve or even replace their current product. It is beneficially for them to expand their current assortment of applications on the market to keep their current 'clients' and hopefully bind new ones. An additional motivation for them to buy our product is to prohibit that another enterprise or institute brings it on the market, thereby possibly worsening their own position on the market.
Examples of these enterprises ExperIT, mySugr and Sweetbee. ExperIT is now on the market with an application called 'HelpDiabetes'. HelpDiabetes is a carbohydrate counter with Dutch, English and French food composition tables. The user puts in the the amounts of food that were consumed and the application calculates the number of carbohydrates the food intake consisted of. Additionally, it is possible to do a calculation of the for the patient needed amount of insuline. This calculation is based on the users' personal carbohydrate - insulin ratio's, correction factor and active insulin. However, this calculation is similar as many patients do nowadays by hand. Patients have to fill in all this information and their is no algorithm which can detect a relation between insuline intake and carbohydrate absorption. If ExperIT would add our algorithm to optimize this calculation, it would be a real addition to their product. https://sites.google.com/site/hippoandfriends/bolus-wizard/bolus-calculation---en
Our algorithm might be a real concurrent to the current application of mySugr. mySugr has a different approach than most diabetic applications, especially in the USA. In Europe they work similiar to the application 'HelpDiabetes', as described above. The user fills in his or her data and the application keeps track of it over time and calculates the patients bolus insulin. However, the version that is available in the United States of America does not calculate your bolus for you but provides you with a personal diabetes coach. This coach can provide the user with personalized advice anytime or so mySugr promotes: 'Analysis of your data while you live your life. If the algorithm we develop might take over this analysis of the data, it would mean that extra payment for a personalized coach becomes redundant. This is why it might be fruitful for mySugr to invest in this product themselves, so that others stay behind them in this market. It could also help them broaden their target group, because not all people who live with diabetes are interested in having a real person as coach via their smartphone. In any case, it would be a good investment for them for the European market since they do not offer personal coaching in this continent. https://mysugr.com/
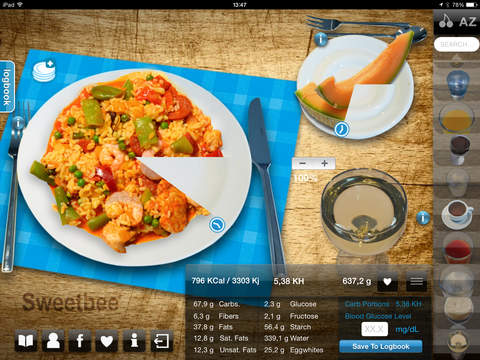
The last example which will be discussed here is Sweetbee. Sweetbee is the provider of two applications that can be useful for diabetic patients. The first is the Carbcounter and the second is the Platemate. The Carbcounter and Platemate both fulfill the function of the counting and keeping track of the carbohydrates that have been consumed. The Platemate also adds the option of keeping track of your blood sugar level. Especially interesting about this application is the way of input for the amount of food. This is done in a very visual way by really putting the food on a plate and the amount adjustment is done by adjusting how much space the food takes in on the plate.(see image ...) Of course, it can be questioned whether such a way of input is precise enough for a diabetic patient. This application is now missing the full globe of aspects by which a person with diabetes can be helped and primarily focusing on the carbohydrates counting.The chances for Sweetbee of improving their product are present by making use of our optimizing algorithm. Adding this to their current product can finish the complete picture and make their product distinguishable from the dozens of other diabetes apps that are already on the market. http://be.sweetbee.eu/nl
Newly diagnosed with Diabetes
General
Being recently diagnosed with diabetes, especially diabetes type 1, can be quite overwhelming or being a shock for people. You’re diagnosed with a chronical disease that will never pass and asks a for a lot of change in your lifestyle, both physically and mentally. In particular for young children and teenagers a diabetes diagnose could have a major impact. Where adult people try to relativize earlier and accept that they have to deal with the disease, children could become rebellious, depressed or even get the feeling that they failed. Children are very likely to compare them self with other children of for example their school classes or sports teams. A diagnosed child will compare itself with other non-diagnosed children. By doing this a child could develop feelings that he or she is an exception or that he or she failed. At the end this kind of behavior will have a bad effect on the development and treatment of the disease. Neglecting of the disease could for instance lead to neuropathies or numbness in the limbs. Thus in conclusion it can be stated that it’s very important to for especially children and teenagers to learn how to deal with the disease and how to get in and get used to the daily rhythm of a diabetes patient.
When you are recently diagnosed with diabetes type 1 as a child in The Netherlands, you will be brought into contact with a so called ‘children’s diabetic team’ in a hospital or in a center for diabetes. Such a team consists of a pediatrician, a children’s diabetes nurse a dietician and a psychologist. This team is very important for you as (new) diabetic patient. They help you through the first diabetic period of your life, until you will make the change to an internist (a specialist in internal medicine). If it is just known that you’re a diabetic, you will have a lot of contact with the children’s diabetic team. In the beginning this could be like every day or sometimes multiple times a day. The children’s diabetic team will search, together with the child and it’s parents, how the disease best could be treated and helps you to understand and get used to the disease. Together they make a care plan, which for instance includes the amount of blood glucose measurements the new patient has to do and the HbA1c value is set as goal (the HbA1C value is an average number of your blood glucose level of the last two or three months and is a good indication how the ‘good or bad’ your diabetes (treatment) is for you).
Diabetes in your dialy life
Fitting diabetes into your daily life could be a real big challenge, because it brings lots of changes and you have to take a lot new things into mind. When you are new to diabetes a lot questions could arise. You will need to get used to these questions in order to live like and do things like you did before you got diagnosed with diabetes. Some examples of these questions could be like:
• How do I need to measure my glucose level?
• Where do I need to prick?
• What do I need to do when my value is to high (hyper) or to low (hypo)?
• What do I need to do when I have a party?
• What do I need to do when I go out for sports?
• What do I need to do when I am ill?
A second thing in order to handle diabetes in a right way is nutrition. It’s not enough to only know much about insulin and glucose levels. On the first place it’s important to note what and when you ate something, in order to calculate the correct amount of insulin needed. On the second place it’s important to get a proper understanding and feeling for (types of) food and nutrients. If will come into handy when you know how your body will react onto the food and nutrients you ate. The body of a diabetic person could react different to some nutrients or product then the body of a healthy or normal person does. You will need to eat more nutrient balanced meals and have to make more healthier food choices than the average person will do. In the case of diabetes many tips to make the right food choices exist, some of the most important of those are:
• Eat regular meals: Spacing meals evenly throughout the day will help control your appetite and blood glucose levels – especially if you are on twice-daily insulin.
• Opt for slowly absorbed carbohydrates: All carbohydrates affect blood glucose levels, so be conscious of how much you eat and opt for carbs that are more gradually absorbed.
• Cut the fat: Eat less fat – particularly saturated fat, as these types of fat are worse for your heart.
• Cut back on sugar: Having diabetes doesn’t mean you need to eat a sugar-free diet, just aim to have less of it. However sugary drinks are excellent to treat a hypo.
• Reduce your salt: Having too much salt increases risk of high blood pressure. This in turn increases your risk of heart disease and stroke, which people with diabetes are already at higher risk of.
Another third important thing in order to handle with diabetes is physical activity. You will need to understand what sports and other activity does with your body and your blood glucose levels. Doing sports when you have diabetes won’t cause any problems, but only asks for some attention. Physical activity is important and good for anybody, but actually it can be said that it might be even more important for a diabetic person because:
• The insulin in your blood will be better absorbed.
• Your blood sugar levels remain better.
• It reduce the risk on diabetic complications on higher ages.
• It keeps you in a good physical condition.
So if you are new to diabetes this is –together with the foods- a good thing to keep in mind. Doing some extra exercises and pay some more attention on what you will eat will for example pay off in a better insulin management in your blood and in the long run a better blood sugar level (HbA1c). It could be a bit overwhelming when you need to take all those, sometimes pretty big, lifestyle choices into account. Therefore some help in the shape of for example a scheduling assistant or overview maker could be use full.
Checklist
In a proper diabetes treatment as a child you will be regularly checked by your children’s diabetic team. These checks are consults which will take place right after the diagnosis of the disease, once in three months, once in a year and once in the five years. In the tables below the most important points per type of consult can be found.
_picture_
How could the application be helpfull?
The application we are developing right now couldn’t be only helpful by the determination of the optimal and personal amount of insulin needed. According to the paragraphs above there are a lot of things that –especially children and teenagers- encounter when they get diagnosed with diabetes. Some really big life style changes are needed in order to have a suited treatment for the disease. So next to the optimal determination of the amount of insulin needed the application could also be helpful for example:
• Information about the disease
• A FAQ and what-to-do-if page
• Nutrition tips and advice
• Sports advice and eventually a scheduling assistant
• Contact page or connection with the children’s diabetic team
• Some simple points form the checklist, like: weight and height (so growth can be tracked), blood glucose level tracking with HbA1C determination and note the number of hypo’s and hypers.
Ethics - Liability
Medical applications in the Netherlands
Medical applications have a continue growing contribution in the healthcare market. Many consumers in the Netherlands use applications like ‘Moet ik naar de dokter?’, ‘Huidmonitor’ and the ‘iP plaslijst’. Even 60% of the doctors in our country says to make use of medical apps. Although the goal of those applications is to improve the quality and efficiency of patient care, certain risks of misdiagnosing are attached to them. [9]
To avert such risks there is the CE marking in the European Economic Area (EEA). This marking is mandatory for applications that make a medical claim. It ensures that medical devices suffice the European requirements for safety, health, environmental and consumer protection. Without this mark a medical device is not allowed to be commercialized. However, the CE-marking should not be confused with a quality mark. It does not guarantee the quality or clinical relevance of the product. [9]
The use of not CE-marked medical products can have consequences for many parties. Developers and doctors can receives fines. Institutions will be addressed upon the base of the law for quality of healthcare institutions. When a patient suffers damage because of the use of a not CE-marked medical product (so also applications), it is a professional misconduct of the doctor. In that case, the product developers will also be liable. [9]
An example for our situation can be that because of a programming mistake, the algorithm in the applications gives consistently too high values. If someone with diabetes suffers from this because he or she administers wrong doses insulin, this can lead to a claim. [9]
Is our app a medical device?
Whether our idea for applications should have a CE-marking can be checked with the flowchart in figure 1.
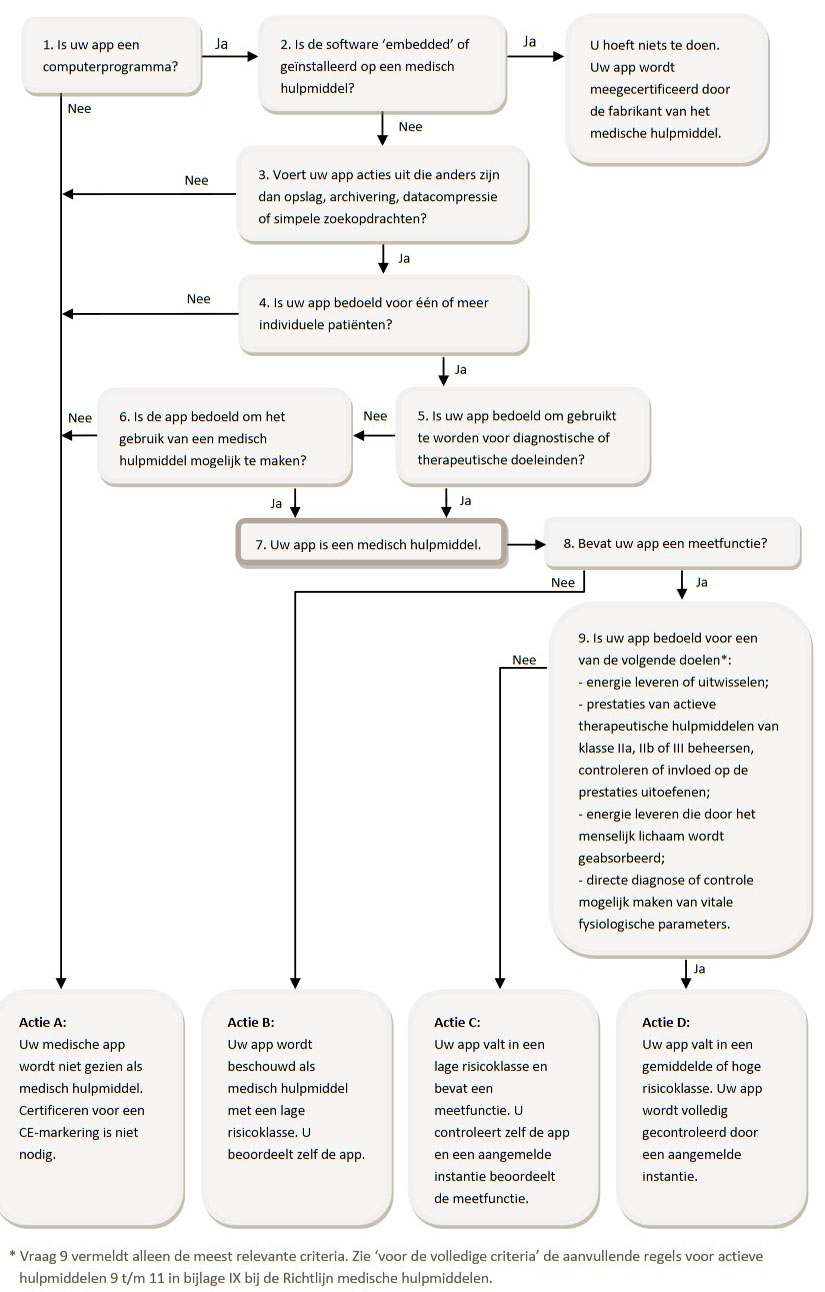
Figure 1, [9]
This will lead to the conclusion that the application for our goal definitely will be seen as a medical device. It does (not???) contain a measuring function??
Liability
Liability of the producer
As a starter the producer of the application is primarily responsible for it legitimate bringing to the market of the application. This means, among other things, taking care of the CE-marking as mentioned in the paragraph above.
Besides, on the basis of article 6:185 BW, the producer of a product is responsible for the damage caused by a malfunctioning product. However, the question rises whether a medical application can be viewed as a product. A product is defined as a moveable property, but a medical application does not have this required materiality. Assuming that the rules for product liability are applicable on a medical application, man can think of mistakes in the production process, design mistakes or instruction mistakes. For the successfully addressing of the producer on article 6:185 BW, it is the patients task to prove that the producer marketed a malfunctioning application and that the application caused harm. Although the burden of proof is with the patient, it is wisely for the producer to be very careful by making and maintaining of the software to limit it’s liability. [10]
Liability of the care giver (hulpverlener)
In most cases it is the caregiver who chooses which kind of medical device will be used. This makes the care giver responsible for it legitimate using of a medical device during the treatment. This includes the use of a medical device with CE-marking and the correct use of the medical device. A care giver is also liable when, according to objective standards for a reasonable acting care giver, he or she could and should have acted differently. Like situations in which the care giver gives insufficient explanation about an application that is used on his or her initiative, causing the incorrect use of the application leading to shows of incorrect results in the application. Additionally, it is the care givers responsibility to not unthinkingly take over diagnoses that the application gives, even if it carries the CE-mark. [10]
Errors
As mentioned in the chapter 'Ethics - liability', we as the creators of a medical advice app bear a certain responsibility for the results or calculations that the app gives. When the app gives a wrong insulin dose, the patient might encounter negative side-affects. Even though the web-app will not be finished for publication after this course, it is still important to take a look at the errors that might occur with the measuring devices. The blood glucose level gets measured by a so called 'Blood glucose monitor' which has a certain error when measuring which translates into a maximum and a minimum value around the measured number. When the patient measures, for example, a blood sugar level of 8 mmol/L, the value can either be below 8, exactly 8, or above 8. For every measured value, this error can be taken into account for the further calculations that use this value.
The blood glucose monitor that we are going to look at for this small analysis is the 'Accu-Chek Aviva Expert' since this is the monitor that was used in the data analysis. The Aviva Expert meets the 2013 ISO standards for blood glucose accuracy [14]. The 2013 ISO accuracy requirement states that 95% of the blood glucose results should not differ more than 0.83 mmol/L from a laboratory result for concentrations up to 5.6 mmol/L and 20% for concentrations of 5.6 mmol/L or more [15]. This means that when a patient would manually calculate the insulin dose, which uses the measure blood sugar level, he or she would get 3 different numbers as a result. For our program, the accuracy of the blood sugar monitor is included in a different way. Since the measurements before and after the insulin is given, are inputs that would improve the approximation for insulin doses for new blood sugar levels, we have to make sure that we take the errors into account. The measurement before and after the insulin is given both have three values which lay on top of eachother on a time scale. The actual value lays somewhere inbetween these three.
The image underneath shows an example:
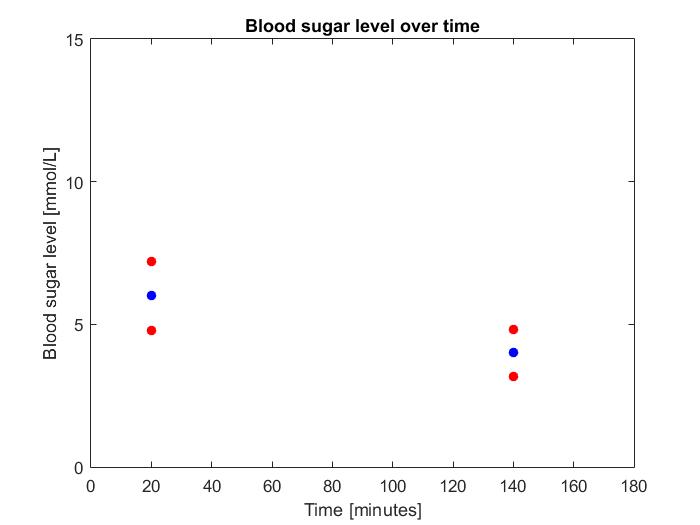
In this graph, the blue dot is the measured value, the red dot above the lue dot is the maximal error and the red dot below the blue dot is the minimal error. Keep in mind that this is a graph from made up data and can thus not be used for any kind of quantification. The errors from the 2013 ISO standard are implemented in the Python script.
Data Analysis
First Attempt
The first attempt to analyse some diabetes data is based on a linear regression approach. Therefore the half-year data of one of our group members is used. The blood sugar measurement device saves all kinds of data per measurement. In this case the data stored by the device consists of the time and date of the measurement, the given insulin dose, the amount of carbohydrates, the current glucose level of the blood, illness and activity.
The first data analysis attempt is done by making use of the programming language Python with the Scikit-learn and Numpy libraries. First the existing saved data of the measurement device are loaded in. To draw any conclusions of the data analysis at the end, it is important to couple the blood glucose levels before and after the insulin release. In other words, the effect of the insulin injection should be made clear by before and after values of the blood sugar level. This is highly important, because it makes the algorithm able to learn from the data.
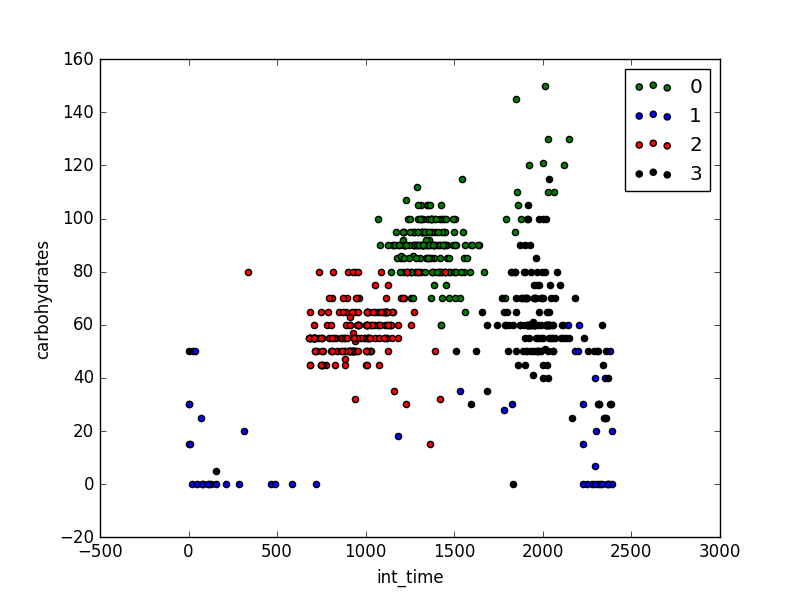
The next step is the clustering of the existing data. A cluster is a group of data points that have similar properties. The created tool is able to do this automatically using simple k-means clustering. The data used for clustering are: time of day, amount of insulin, glucose level before, glucose level after, illness and exercise. Before the data is clustered, it undergoes some preprocessing. In this case the time is converted to a point on a unit circle, this is done as two measurements on 23:59 and 00:00 are close together, while linearly they are the two points farthest from each other. Then each attribute of the data is standardized. This means that the resulting data set each column of the data (attribute) has a mean of 0 and a standard deviation of 1. After the preprocessing the clustering process can get started.
In the diagram below, the amount of carbohydrates is plotted against the time (the time is converted to a integer). As can be seen the data is clustered, where each colour stands for a different cluster. To be clear in this case, a colour does not solely implicate a different time period of the day like morning, afternoon or evening, although these periods are clearly represented in the clusters. There also seems to be a connection between points with a similar amount of carbohydrates. When looking to the evening (around 2000 int_time) one can see that not only the time matters, but also the number of carbohydrates that are eaten. It can be seen that around diner time the data can be divided into two different clusters (green and black) so probably the equation to determine the insulin for the evening when eating relatively many carbohydrates looks more like the formula around lunch than the formula for diner with less carbohydrates. Also the blue cluster represents points with few carbohydrates consumed, this might indicate that the current linear (on carbohydrates) may not be the best fit.
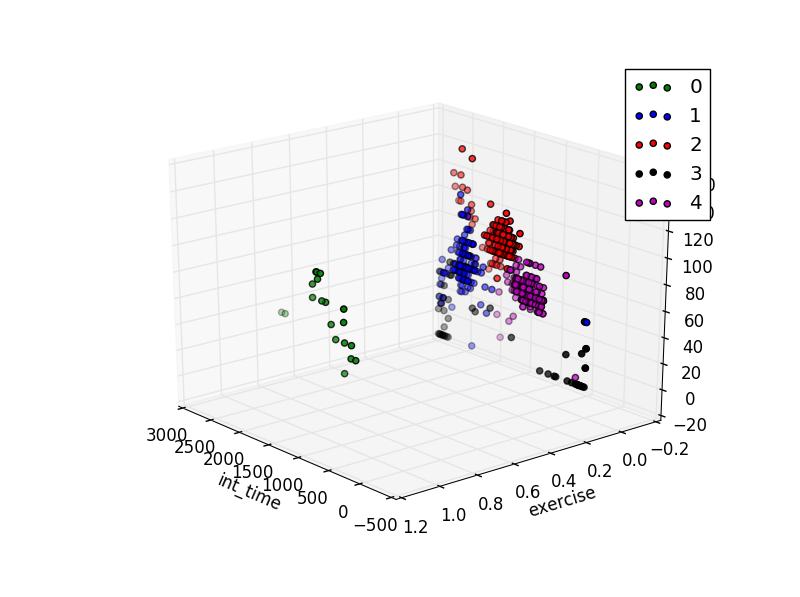
In the diagram below, the amount of carbohydrates is plotted against the time and the exercise (sports). Where exercise is represented by an integer representing a boolean with values 1 and 0 for true and false respectively. As can be seen the software is also able to find clustered data groups for this three distinct values. Furthermore, there’s less to say about the links the clusters have between each other. The only thing that can be said is that some clusters exist between data groups for all kinds of data the blood glucose level measurement device keeps track of.
When the clusters are made, a linear regression is fitted through the different clusters each. So for each existing cluster a different equation is created. So the cluster groups all have their own equation, new data could be added to the existing database. For this new data the computer will look into which cluster it fits best. By adding the ‘new’ data to a certain cluster also the corresponding equation of that particular cluster is coupled to the new data point. At the end, by making use of the coupled equation the best value for the next insulin dose could be calculated in order to reach the desirable blood sugar level.
Preliminary results linear regression
For the linear regression the following attributes were used, as input: amount of carbohydrates, glucose level, insulin dose, illness and exercise, and as output: the difference of glucose level of the next measurement and the current measurement. The coefficients of the result of this regression can be used to predict the glucose level of the next measurement.
From the obtained results we can clearly see that there is a difference between the different clusters. as the for 1 cluster the factor for carbohydrates was -0.9 while in the other clusters it was -0.25. The current results show promise, as in a majority of the cases the predicted difference is in the right direction. so a positive or negative difference. Also the amount of difference seems to give a sound indication in some cases. Mainly when the sugar levels stays relatively stable, the prediction is accurate. But some predictions are way of, this is to be expected as sometimes the guessed amount of carbohydrates may not be close to the actual amount of carbohydrates. And the amount of exercise is not represented, only no exercise or medium to heavy exercise.
An idea is to cluster the obtained predictions, as it seems that the prediction is less accurate with a high blood sugar as starting point. This may lead to new insights.
Unfortunately, we don't have exact statistics and visualizations at the moment, but those are being worked on.
Diabetes and changing rhythms
By use of data analysis it is tried to determine patterns and phases in a person's sugar metabolism. However, it should not be forgotten that years of research have gone before us. A look at results of research in diabetic patient's sugar metabolism can help give an idea what kind of results are to be expected. This can help validate our model. There are many aspects in someones life that can influence the reaction on insulin. Think about vacation, menstrual period, pregnancy but also standard seasonal variations.
Vacation
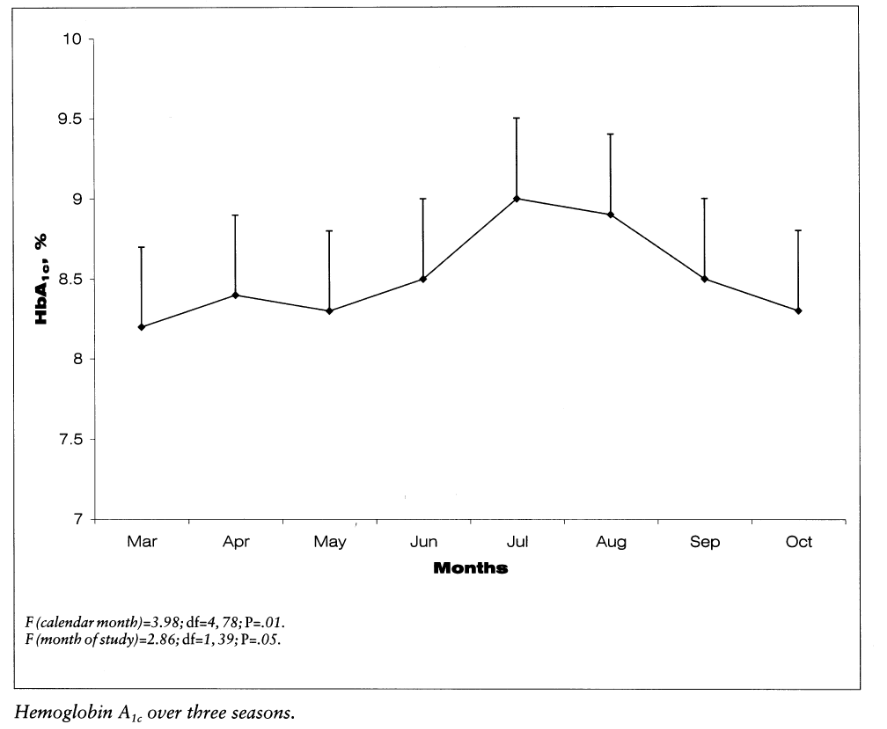
One of the studies looked at was 'A summer Vacation from Diabetes: Evidence From a Clinical Trial'. This study examined the metabolic trend and possible factors associated with a change in Hba1c levels during the summer period. HbA1c levels shows the average glucose blood level over the last 2 to 3 months. The study was done with 40 intensively treated adolescents, age 12 to 20, with diabetes type 1. The results of the study were increased HbA1c values by a mean of 0.73% from May to July and afterwards a decrease by a mean of 0.75% from August to October. So, when the subjects went back to school.
The most plausible explanation for the worsening of diabetes control in the summer is a change in routines and lifestyle. The study also included a questionnaire for the participants of the study and this supports this assumption. The teenagers with the fewest consistency in their summer schedules had the most decline in metabolic control. Adjustments in the diabetes regimen should have been made to to maintain a steady metabolic control during the summer vacation.
Factors of this inconsistency in lifestyle are changing sleeping rhythm, inconsistent diet and less physical exercise. In summer, some teenagers may sleep late and therefore awaken with higher fasting blood glucose levels. This might be corrected by moving, for instance, the supper intermediate insulin dose closer to the new bedtime. Participants with a very inconsistent diet could perhaps be helped by using quick-acting insulin before each meal, also known as a basal-bolus plan. And adolescents who were very active at sport clubs during the year, might have to compensate for this decrease in exercise by inserting extra or larger insulin doses.
http://journals.sagepub.com.dianus.libr.tue.nl/doi/pdf/10.1177/014572179902500105
Seasonal variation
Summary. Blood glucose screening results, obtained using two different screening procedures, are reported from two occupa- tional groups. Post-prandial blood glucose levels were mea- sured in 3346 subjects aged 45 years or more employed by the Greater London Council/Inner London Education Authori- 9 ty. In women, mean blood glucose levels were higher in the af- ternoon than the morning (t7 < 0.05). Ninety-fifth centile levels were substantially higher in the fternoon in both sexes, though the differences were not constant in all age and sex sub-groups. In both sexes mean glucose levels were highest in the winter (December-February, inclusive), but seasonal vari- ation did not significantly affect the proportion exceeding the ninety-fifth centile for the total population. In the Whitehall tudy, the blood glucose was measured in men, in the morn- ing, 2h after a 50-g glucose load. Significant seasonal variation in mean blood glucose values occurred, with highest values in winter and lowest in spring (March-May, inclusive). How- ever, there was no significant difference by season in the pro- portions exceeding the arbitrary cut-off levels of 7.8 and 11.1 mmol/1.
Article about the seasonal variation suggest that during the summer glucose values are lower and in the winter higher, while the first study suggests differently. Important is that the first study was by young adolescents, where the relevant factor was the change in life style not the fact which season it was. The seconds study on seasonal variation was done with adults who have less of a changing rhythm during summer period, so really the influence of seasonal difference was measured. These results can also be verified by the fact that warmth lessens your need for insulin and results in a faster absorption of insulin. Which is why the diabetesvereniging Nederland advises to measure extra carefully on a day in the sun to avoid that too much insulin is taken and risking a hypo.
https://www.dvn.nl/diabetes/vakantie-en-diabetes
Menstrual cycle
The study revealed that blood glucose level changes along the period of menstrual cycle, due to the interaction between the hormones that control menstruation (estrogen and progesterone) and the insulin hormone.
This suggest that it would be wise that an extra input for women would be the start and ending of their period.
http://www.iosrjournals.org/iosr-jdms/papers/Vol9-issue2/B0920911.pdf?id=4526
Pregnancy
Week planning
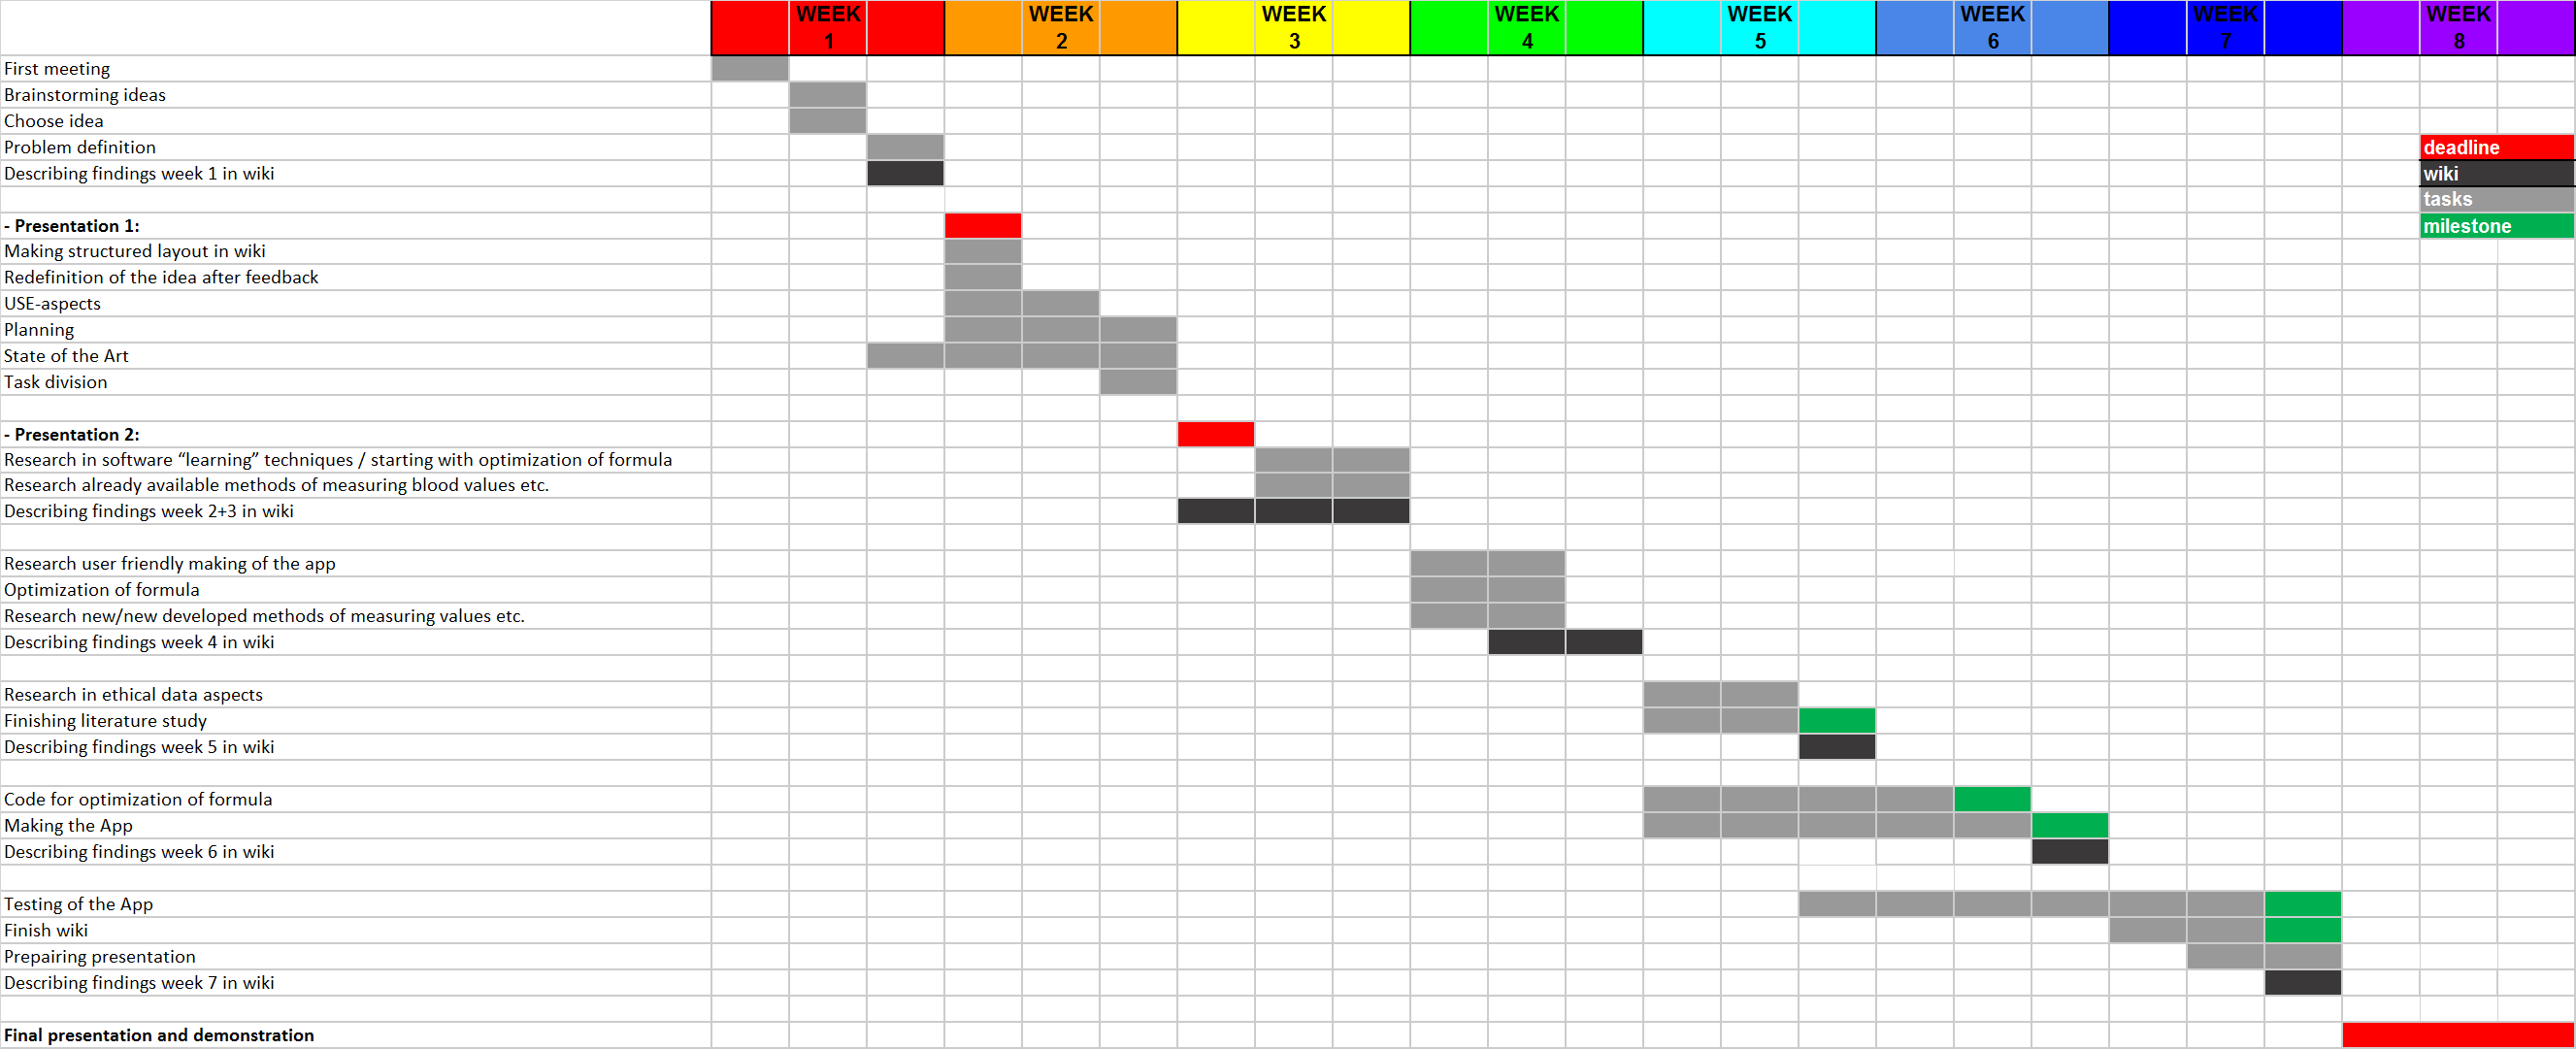
In the Gant Chart different colors can be seen: Deadlines are marked red, wiki related tasks are marked black, milestones are marked green and all the remaining tasks are marked grey.
The deadlines are in week 2, 3 and 8, these are the presentations. Almost every week a black box can be seen, the findings done in that week will there be placed on the wiki to make sure the wiki-page stays up-to-date. Important milestones are finishing the literature study in week 5, finishing the code for the optimization of the formula in week 6, finishing the app in week 6 and finishing the wiki and testing the app in week 7. A clearer week distribution is shown below.
Week 1:
- First meeting
- Brainstorming ideas
- Choose idea
- Problem definition
- Describing findings week 1 in wiki
Week 2:
- Presentation 1 [deadline]
- Making structured layout in wiki
- Redefinition of the idea after feedback
- USE-aspects
- Planning
- State of the Art
- Task division
Week 3:
- Presentation 2 [deadline]
- Research in software “learning” techniques / starting with optimization of formula
- Research already available methods of measuring blood values etc.
- Describing findings week 2+3 in wiki
Week 4:
- Research user friendly making of the app
- Optimization of formula
- Research new/new developed methods of measuring values etc.
- Describing findings week 4 in wiki
Week 5:
- Research in ethical data aspects
- Finishing literature study [milestone]
- Describing findings week 5 in wiki
Week 6:
- Code for optimization of formula [milestone]
- Making the App [milestone]
- Describing findings week 6 in wiki
Week 7:
- Testing of the App [milestone]
- Finish wiki [milestone]
- Preparing presentation
- Describing findings week 7 in wiki
Week 8:
- Final presentation and demonstration [deadline]
Sources
[1] https://www.diabetesfonds.nl/home
[2] http://www.avdweb.nl/arduino/hardware-interfacing/scale-interface.html
[4] http://appcrawlr.com/ios-apps/best-apps-insulin-calculator
[5] http://appcrawlr.com/ios/glucose-companion#authors-description
[8] http://www.ecai2016.org/content/uploads/2016/08/W7-AID-2016.pdf
[9] ‘Medische apps, is certificeren nodig?’, Nictiz, 7-06-2013, Anton Ekker and Barbara van Rest.https://www.nictiz.nl/SiteCollectionDocuments/Whitepapers/13005%20Whitepaper%20medische%20apps.pdf
[10]‘Civiele aansprakelijkheid voor het gebruik van medische applicaties’, Tijdschrift voor Gezondheidsrecht, 27-10-2016, Mr. A.J. Zijlstra. http://www.sectionz.nl/cms/LAUXTERMANNADVOCATEN/media/pdf/TvGR_2016_40_07_schoon-zijlstra.pdf
[11] https://www.ncbi.nlm.nih.gov/pubmed/19964403
[12] https://www.ncbi.nlm.nih.gov/pmc/articles/PMC2769885/
[13] https://www.ripublication.com/ijaer16/ijaerv11n1_109.pdf
[14] http://www.diabetes.co.uk/blood-glucose-meters/accu-chek-aviva-expert.html
[15] http://www.diabetes.co.uk/blood-glucose-meters/iso-accuracy-standards.html
[16] https://www.dvn.nl/files/site/DVN%20Acceptatie%20jan%202015.pdf
[17] https://www.dvn.nl/files/site/DVN%20Zorgwijzer%20Jongeren.pdf
[18] https://www.dvn.nl/files/site/DVN%20Kinderen%20feb%202014.pdf
[19] https://www.bbcgoodfood.com/howto/guide/how-eat-diabetes-top-10-tips
[20] https://www.sugarkids.nl/diabetes/eten-en-bewegen
[21] https://www.diabetesfonds.nl/over-diabetes/dagelijks-leven
