PRE2015 4 Groep2: Difference between revisions
| Line 235: | Line 235: | ||
In a convolutional neural network in the connectivity pattern between the neurons is inspired by the animal visual cortex. In the visual cortex the neurons are arranged such that they respond to overlapping regions in the visual field, called receptive fields. CNNs are widely used in image recognition, since they can exploit the 2-D data structure of the images. | In a convolutional neural network in the connectivity pattern between the neurons is inspired by the animal visual cortex. In the visual cortex the neurons are arranged such that they respond to overlapping regions in the visual field, called receptive fields. CNNs are widely used in image recognition, since they can exploit the 2-D data structure of the images. | ||
When used for image recognition CNNs are made up of several layers of neurons, each of these layers processes a receptive field. The outputs of the neurons in each layer are then combined such that their receptive fields overlap, giving a better representation of the original image. This allows the CNN to be invariant to (small) translations in the input. Neurons in adjacent layers are connected using a local connectivity pattern, which allows the network to take spatial correlations and patterns (like edges) in the image into account. The network looks for patterns at different | When used for image recognition CNNs are made up of several layers of neurons, each of these layers processes a receptive field. The outputs of the neurons in each layer are then combined such that their receptive fields overlap, giving a better representation of the original image. This allows the CNN to be invariant to (small) translations in the input. Neurons in adjacent layers are connected using a local connectivity pattern, which allows the network to take spatial correlations and patterns (like edges) in the image into account. The network then looks for patterns at different depths in the set of shapes and patterns, then combines this knowledge, in a few fully connected layers, to classify the image. | ||
=====Benefits===== | =====Benefits===== | ||
Revision as of 19:18, 18 June 2016
Group members
- Birgit van der Stigchel (0855323)
- Cameron Weibel (0883114)
- Maarten Visscher (0888263)
- Mark de Jong (0896731)
- Raomi van Rozendaal (0842742)
- Yannick Augustijn (0856560)
Introduction
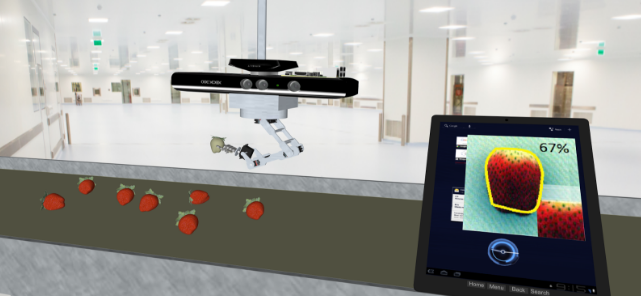
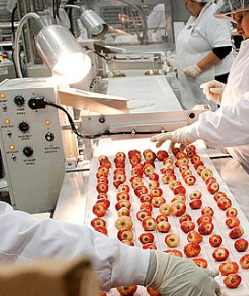
We are developing a fruit visual inspection system that uses a neural network to determine fruit ripeness. The system is being initially developed for analyzing the quality of strawberries; however the neural network, database back-end, and mobile application have all been designed to scale to different kinds of produce. In this project we detail that creation of our system and implement the technology in a demo to display how the system can be used in a quality assurance setting. Our demo was one example application of the system, but the solution can be applied to harvesting robots, fruit-counting robots, and many other technologies.
Abstract
At the start of this project the goal we had in mind was to build a robot that can harvest fruit (strawberries in our case) autonomously. The idea was that the robot would drive along a row of plants, detect which of the fruits are ripe and harvest the fruits that are ripe enough for consumption. Our plan was to use a cheap camera, like a Kinect, to take low resolution pictures of the fruit. These pictures would then be fed through a neural network (a Convolutional Neural Net) and classified into several categories with different degrees of ripeness. This classification can then be used to determine if the fruit should be harvested or not.
The robot would then use shears, mounted on a robotic arm to cut the fruit and put it into baskets. The complete robot would be mounted on rails, such that it can move along the row of plants. It became clear very quickly that this project would be way to ambitious, and that we had not properly looked into the User, Society and Enterprise aspects. Rather, we had focused completely on the technical aspects and neglected the USE approach.
We therefore decided to take a step back and evaluate the USE aspects relevant for our project. The first aspect that has a significant impact on the project is the farmers ability to influence the system. We decided not to build the complete robot, but rather focus on the vision system and build a companion app. This app would give the farmer information about the robot and the farm, and would allow him/her to influence the classification done by the vision system as well. If every user of the system is able to give feedback, for instance by telling the system whether or not certain classifications that it made are correct, then the accuracy of the system can be improved.
The next step we took was to conduct an interview with a cucumber farmer, to determine if a system like this would be beneficial to him. He said that the minimum accuracy level of the system should be 80% at the moment of implementation. Once the system has been installed, this accuracy should be improved further. It was also important that the system was at least as fast as a human worker, to prevent economic losses.
We also visited a workshop by PicknPack, a European project by the University of Wageningen. The focus of this project was on developing a machine that can package fruits. The main part of this project that is relevant for our project is the quality control module, where the ripeness of the fruit is determined by looking at the colour of the fruit, confirming the plausibility of our project. Another important aspect that we gained from the PicknPack project is their focus on transparency and traceability. Every fruit is labeled, which allows the machine to track each of the fruits individually and connect a page with information about this specific fruit to it.
We wanted to implement something similar into our project. It was decided that the best way to do this is to keep track of exactly how much fruit the robot is harvesting in several zones on the farm. We can then display maps inside the app, that allow the farmer to see exactly where the fruit is coming from on his farm. We could also display a map that shows exactly what the average ripeness level is in each of these zones. This will give the farmer the ability to determine which areas of his/her farm are performing badly.
To check the relevance of this idea we decided to visit another farmer who cultivates apples and pears. It turns out that this would be very relevant for his farm, since this information is currently not available. This is because the fruit is harvested by workers which cannot keep track of how much fruit each tree is producing. A system that would allow a farmer to do this would be tremendously helpful to a farmer, since it allows him to track down and fix problems very efficiently.
Problem statement
The problem that we are trying to solve by implementing the above mentioned system is twofold, we both try to address societal issues as well as farmer needs. The societal problems that we are addressing are the ageing society, and thus the decrease in available workforce and the food shortage coming due to the population growth, expecting to reach 9 billion by 2050. The farmer needs are the wish for more automation, to allow for cost reduction to make room for expansion and to increase competitiveness through better transparency and traceability.
Requirements
Functional requirements
- The robot should be able to detect fruit using a Kinect camera
- It should be able to classify the ripeness of the fruit based on a convolutional neural network
- The robot will query an online database about the ripeness of a certain fruit and the database will return the percentile of ripeness the fruit is in based on different fruit image sets
- The farmer should be able to rate pictures of fruit so that they can be added to the training set as feedback to improve the robot
- The farmer should be able to interface with the database as well as different harvesting metrics through a mobile device
Non-functional requirements
- It should be relatively simple to add the Kinect and the Raspberry Pi to an existing harvesting system
- The farmer should be able to use the system with minimal prior knowledge
- The robot should perform better than a human quality controller
- This robot should have all the safety features necessary to ensure no critical failures
USE aspects
User Need
Primary users are farmers and their workers, who directly use the robot. The following aspects hold:
- Their work becomes far less intensive and heavy. Instead of directly harvesting, farmers can let the robot do the work. They would now only occasionally need to check the harvest and possibly adjust some parameters. This work is less heavy than harvesting and therefore less health problems due to heavy work can be expected.
- More free time for other things. This is because the new work takes far less time. Also there is no need anymore for training seasonal workers.
Secondary users are distributors that pick up the fruits from the farms. They use the robot occasionally when they need to get the fruits that are picked by the robot. Their work is mostly unaffected, however some parts of their work can be left to the robot, depending on how advanced the robot is. One of these things is selecting fruits based on ripeness and appealing factor. This can be done by the robot. The robot could also directly package and seal the fruits.
A tertiary user is the company that is developing and maintaining this robot. It indirectly uses the robot during development.
(I assume that this is a societal aspect:) Another tertiary user is the harvesting worker. A worker that is harvesting fruit manually does not directly come in contact with the robot. The robot does however influence these workers, as it takes away their jobs. This aspect should be researched more. These harvesting workers are likely people with a low education and students wanting to earn a little more. The people with low education can be expected to have a hard time finding a new job.
User Impact
Primary: Farmer (and permanent employees)
- Transparency
- Traceability
- Less labor intensive work
Secondary: Quality control / Supermarkets
- Transparency
- Traceability
Tertiary: Maintenance / Supplier
- Increase in demand for their services
Society Need
There are several problems to which our solution can relate such as:
- There will not be enough food in the near future for all the people
- There is an increasing shortage of workers due to aging
- Decrease in wage gap due to overabundance of food
- Post scarcity
Facts supporting these statements are:
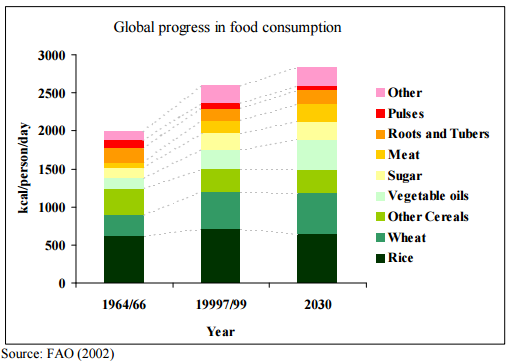
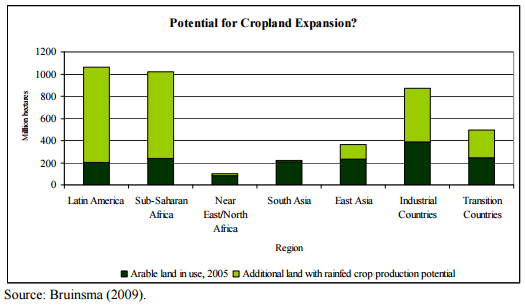
- The world population is predicted to grow from 6.9 billion in 2010 to 8.3 billion in 2030 and to 9.1 billion in 2050. By 2030, food demand is predicted to increase by 50% (70% by 2050). The main challenge facing the agricultural sector is not so much growing 70% more food in 40 years, but making 70% more food available on the plate.
- Roughly 30% of the food produced worldwide – about 1.3 billion tons - is lost or wasted every year, which means that the water used to produce it is also wasted. Agricultural products move along extensive value chains and pass through many hands – farmers, transporters, store keepers, food processors, shopkeepers and consumers – as it travels from field to fork.
- In 2008, the surge of food prices has driven 110 million people into poverty and added 44 million more to the undernourished. 925 million people go hungry because they cannot afford to pay for it. In developing countries, rising food prices form a major threat to food security, particularly because people spend 50-80% of their income on food.
Cited from: http://www.un.org/waterforlifedecade/food_security.shtml
Graphs’ source: http://www.fao.org/fileadmin/templates/wsfs/docs/expert_paper/How_to_Feed_the_World_in_2050.pdf
Going from all the above mentioned we can address several calls listed in the Horizon 2020 Work Programme 2016-2017. Some would require a slight shift of our focus, but could well be addressed after our project is completed too since one can build upon our knowledge, making it easier to solve such issues in a likewise way. These include:
- SFS-05-2017: Robotics Advances for Precision Farming
- SFS-26-2016: Legumes - transition paths to sustainable legume-based farming systems and agri-feed and food chains
- SFS-34-2017: Innovative agri-food chains: unlocking the potential for competitiveness and sustainability
Additional information on these calls: [1]
Our solution helps because by integrating the robots’ operation system into the system of distributors, less food will be wasted, and thus more will be available for others when developing the system in such a way that distribution can reach further for instance. Additionally we can help reduce poverty or limit the number of people that are driven into poverty, robots can reduce prices significantly on the middle to long term (before 2050 is certainly doable). By using the procedure we will use to make sure computer vision combined with machine learning is able to identify strawberries in the field, it will become easier to produce more legumes (semi-)automatically, thus addressing the SFS-26-2016 call. Our solution meets the expected mentioned at SFS-15-2017, namely: ‘increase in the safety, reliability and manageability of agricultural technology, reducing excessive human burden for laborious tasks’. Our robotic solution aims at reducing the number of people needed at a farm site. Also it specifically meets one of the expected impacts from the SFS-34-2017 call which says solutions should ‘enhance transparency, information flow and management capacity’. This is what the system behind the robot is intended to achieve.
Society Impact
Short to middle term
- Decrease of jobs in agriculture
- Increase in robot maintenance jobs
- Increasing food security
- Lower prices
- Less waste
Long term
- More food available
Enterprise Need
Automation can result in more sales
A socioeconomic survey of 87 nurseries and greenhouses located in Mississippi, Louisiana, and Alabama has shown greenhouses or nurseries with higher levels of sales tend to also have a higher level of automation [2]. The level of automation was measured as the percentage of tasks that were automated of mechanised, it was found that,
“significant increases in total revenues were associated with the level of mechanisation, the number of full time equivalent workers, and the number of acres in production. These positive coefficients indicate that an increase in total revenues, on the average, by $4,900/year was associated with a one-unit (1%) increase in the level of mechanisation. “
The same survey also showed that within these 87 nurseries and greenhouses the automation level of ‘harvesting and grading production’ was 0 percent. This could mean that there is incentive to introduce automated harvesting robots in similar greenhouses and nurseries. It also confirms what we were told by the farmer from Kwadendamme, grading production involves the inspection, assessment and sorting of produce and was indeed found to be 0 percent automated. Another study, on the farm development in Dutch agriculture and horticulture [3] shows that “the degree of mechanisation increases the probability of firm growth and firm renewal.”
Farms are getting bigger
The structure of agricultural production is experiencing fundamental changes, this is happening worldwide [4]. Farms are moving away from the traditional family-owned, small scale and independent farming model and moving towards an industry that is structured in line with the production and distribution value chain. The result of these changes is that the average number of farms is decreasing, whereas the average farm size is increasing. Autonomous harvesting robots could help farmers deal with this increased size in a cost efficient way.
These robots would also be beneficial for the second stage in the production chain, the quality control and packing centres. The robots could gather information about the produce as it is growing and share this with the quality control centres.
Farmers show interest in autonomous machines
A recent survey of German farmers [5] has shown that these farmers are interested in adopting (semi-)autonomous machinery. They see several benefits, amongst them are saving labour, saving time, higher precision and increasing efficiency. When asked about fully-autonomous machines, some farmers also saw some additional benefits, lower health risks and an advantage in documentation and evaluation. However, they were sceptical about the reliability and safety of the machines. This shows that there is a potential market for our idea.
Lower costs
The increase in automation will be paired with lower wage costs and less health benefits that have to be paid by the farmers, since the amount of full time, part time and seasonal workers will decrease. This is already a reason for current development of machinery.
“High labour costs in recent years have encouraged larger, wider and faster machinery for cost efficient production.” [6].
Enterprise Impact
- Automation on farms correlates to more sales
- $4000 per 1% automation
- Lower costs
- Investment
- Expansion
- System improvement
- Other technical advances
- Investment
Transparency and traceability
Transparency and traceability are immensely important within the context of our project. Beyond the novelty of being able to see that your fruit comes from Sri Lanka, Guatemala, etc. the ability to track which farms the produce has passed through allows for better food regulation and, even more importantly, the wherewithal to eliminate diseased fruit from contaminating the food supply. Imagine that there was an outbreak of E. coli, and the first recorded instance of the E. coli could be traced back to the farm from which it originated. The farmer would then know which of his crops would need to be uprooted.
Another example is that a food crate might come in weighing ten kilos, and the RFID tag that is attached to the crate states that the food crate should contain fifteen kilos. This kind of produce checksum ensures the food hasn’t been tampered with, as well as providing an added sense of security in the food that is being purchased.
Validation of concept
Conversation with cucumber farmer
On the 12th of May we conducted an interview with a Cucumber farmer, named Wilco Biemans. A friend of Maarten and Cameron works at his farm, through her we were able to get his contact information and schedule an interview. During the interview we asked him several questions about his farm, the current state of the art, developments that were taking place and his opinion on our system. His overall response was very positive, he saw the potential in our system but he did point out several points of improvement. Below the main questions and his answer will be outlined, please note that we are not reporting his exact answers since the interview was conducted in Dutch and we did not record it.
What system is in place for detecting the ripeness of fruit?
The farmer said that currently the fruit is sorted by trained workers and machines. The cucumbers are picked by workers who have received training which allows them to identify which cucumbers are ripe enough for picking. These vegetables are put in crates, which are then transported to a sorting facility. There the cucumbers that are deformed and not fit for consumption are separated from the rest, these will be sold to the cosmetics or fertilizer industry. The remaining cucumbers are separated by a machine into several weight categories (400-500, 500-600 grams) which are then sold for consumption.
What developments are currently being made in the agriculture industry, with respect to automated harvesting?
He said that there are systems available which are able to recognize and harvest fruit autonomously. However, these systems are not yet ready for commercial use. The biggest problems with these machines is the speed at which they operate, it is simply not worth it (financially), to replace a worker with one of these machines. He also pointed out that the entire infrastructure within the green house, or on the farm, will have to be modified, to accommodate these machines. The infrastructure is currently set up for maximum efficiency with respect to human workers, but a robot might allow for a faster system. (For instance with conveyor belts instead of crates)
He then talked about some important design elements of these robots that we had not yet considered. The first being the use of a laser cutter to harvest fruit, instead of shears. This choice was made to prevent the spread of diseases from one plant to the next, which could be catastrophic for a farm. The next design element was the ability of these robots to withstand the relatively harsh conditions within a green house. There can be large fluctuations in temperature and extreme humidity, which the robot has to be able to withstand. To this end the robot should be waterproofed, since any internal condensation can ruin the electronics.
The next development we talked about was a solution for the problem that no two fruits are the same, even within one species. Every cucumber is different and this makes automated harvesting difficult. As a solution the industry was working on combining two developments, new cucumber species and new methods of harvesting and growth. This new method for growth is called 'hoge draad teelt' and is very common for tomatoes. It involves suspending the cucumbers on a high wire and letting them grow in the air, this ensures that most of the cucumbers grow at the same height which makes harvesting very easy. This does requires a special species of cucumber, currently about 10% of all cucumbers are grown this way. This method of growing and harvesting is also ideal for automation, since this makes location the cucumbers very simple. If done properly, the location of the cucumbers can be controlled such that 95% of the fruit grows at the same height. Another reason that this technology is very beneficial is that it standardizes the ways in which different fruits grow, normally every fruit grows in a specific way and thus, requires a special way of harvesting. By utilizing this new method the way in which the fruits grow is very similar, which allows one machine to harvest different types of fruit, expanding the potential customer base.
An other development is a machine which can sort cucumbers based on their length, automatically. Development of this machine has been ongoing for about 10 years. Methods for detecting rot on the inside of fruits are also being developed. Finally, he pointed us to the work that is being done by the University of Wageningen, more on this can be found in the section on PicknPack and in the section on the state of the art.
Would a more accurate system be helpful?
Of course was his answer. But only if it can be faster and more accurate than a human worker and in this way offer a way to save costs. He said that the workers make a lot of mistakes, this is natural of course because there is no 100% accurate way for the workers to identify which fruit is ripe. Currently this is mostly done by comparing the fruit to other fruits which are known to be ripe, but this process is prone to errors. He estimated that a machine that is just as fast as a human worker, but has an accuracy of 80% would be good enough for implementation. It is important though that this accuracy will keep improving over time until it is as close as possible to 100%.
Trip to PicknPack workshop at Wageningen University
Via one of our mentors we were pointed at the PicknPack project. In this project, research is being done on solutions for easy packaging of food products. The goal of the research is to provide knowledge on possible solutions for picking food from (harvest) bins and packing the food, and meanwhile doing quality control and adding traceability information. To that end they created a prototype industrial conveyor system with machines that provide this functionality. The system is designed to be flexible and allow easy changing of the processed food type/category. While checking out the project, we saw a workshop announcement where they planned on showing the prototype and giving information. The time was possible for us and the content was interesting, so we decided to go with a group of 3 (Mark, Cameron, Maarten). We went on May 26 to Wageningen University for the workshop.
The quality assessment module is the most interesting for our project, and we were pleasantly surprised to learn that their approach used components that we were planning to use ourselves. In the quality assessment module, they set up an RGB camera, a hyperspectral camera, a 3D camera and a microwave sensor. The RGB camera is used for detecting ripeness. A simple algorithm was used for this. Weight was also estimated using the 3D camera. Features they measure via the hyperspectral camera are sugar content, raw/cooked state (for meat products), chlorophyll. The microwave sensor is used for freshness and water content (among other things). Cameron asked about the use of machine learning in combination with the RGB camera to a PhD student working on the RGB ripeness detection. The student explained that they weren't opposed using machine learning, in this project however they chose a simpler approach using a statistical model. He mentioned the black box nature and overfitting as potential problems for using machine learning. The statistical model that they used instead could be tuned by operators. A program was created that showed several results of the algorithm with different parameters. The operator could then indicate the best result.
An other big aspect in the project was traceability. A system was designed to closely track each food packet. Techniques used for this are RFID, QR codes and bar codes. There is also a database where the details are stored. Cleanliness was also very important. To deal with this a robot was created that could move using the conveyor system through all machines. For each separate machine a separate cleaning procedure can be defined.
Trends identified by the PicknPack team
- More personalized fresh foods (online)
- World population growth
- Advancing technology
A collection of our own pictures can be found via this link.
Visit to Kwadendamme Farm
Overview
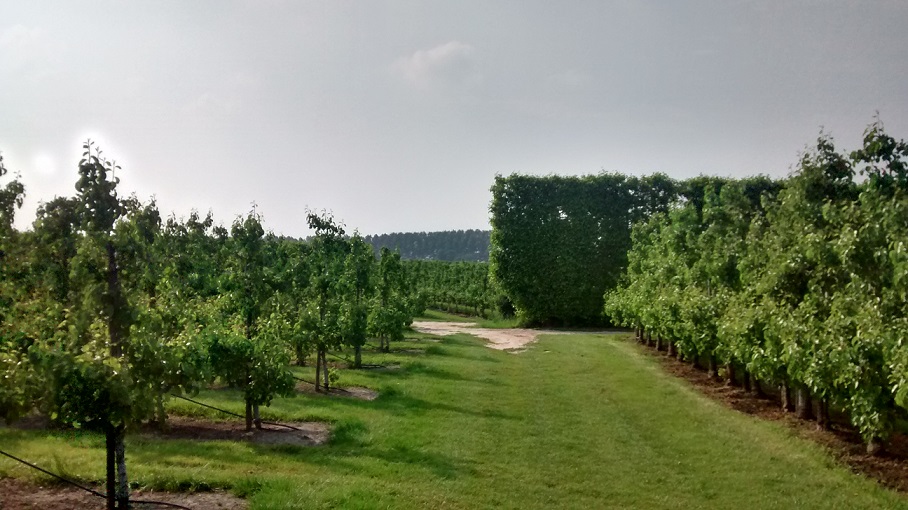
We learned an immense amount of information from the Steijn farmers in Kwadendamme. These farmers plant Conference pears and Elstar apples, and they process over 900,000kg of fruit every year across 15 hectares of land. As seen in the picture above, the tress are kept to a relatively low height (around 2 meters) and the are aligned nicely in even rows.
Farmer Problems
The main priority of the farmer is to maximize his revenue. In our conversations with Farmer Rene, he mentioned that the biggest detractor from their bottom line was labor. The hourly wage for a Romanian/Polish harvester was 16 euros per hour (which includes tax, healthcare and other employee benefits), even though only 7 euros of that ends up going directly to the worker. The farmers only hire farmhands during 3-4 weeks of the year when they are harvesting their apples and pears, and the rest of the year the majority of their work goes into pruning, fertilizing, and maintaining the plants.
Another way for the farmer to increase his bottom line is to drive top line growth. If the farmer can produce plants that yield 20% more fruit, this translates to an almost equally proportional revenue increase. The farmers mentioned that a robotic system that continually keeps track of the number of produce each row of trees (or individual tree if such accuracy is attainable) is bearing. We discussed the concept of a density map for their land, and the idea resonated with them. We decided here that we would develop the planning for a high-tech farm in which our image processing system would play as a proof of concept for one of the many technologies that would be implemented in the overall farm. This allows us to focus on a more broad perspective, while still creating a technically viable solution.
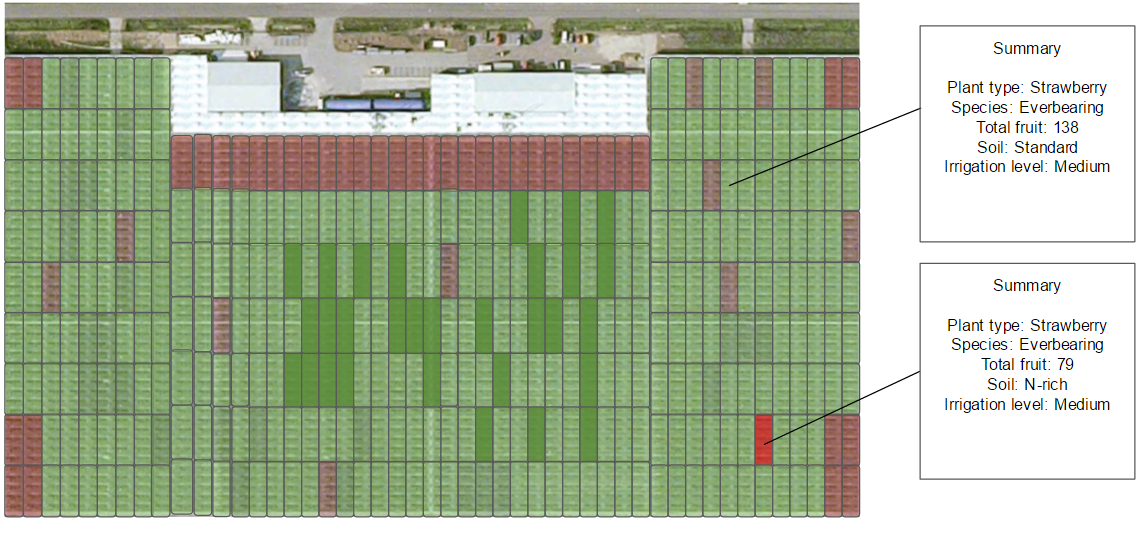
Interestingly enough, on this farm they were testing new kinds of fertilizers and plant species on specific areas of the farm. They buy new products (for example pretreated seed that protects against insects) from Bayer, Monsanto, OCI and other companies, which they subsequently plant in test crops to gauge its efficacy. Using a density map similar to the one above allows the farmer to try more experimental methods to increase yield on their farm.
Usefulness of Our System
The farmers recognized our system as being a necessary innovation within the quality assurance side of the produce supply chain, and they would benefit from a fruit-counting robot utilizing our machine vision software. The proof of concept we will demonstrate at the end of the year is an example implementation of our machine vision system as it applies to quality assurance, but from the farmers' comments it is clear there is plenty of room for innovation in computer vision within the agricultural field.
We also asked the farmers how they felt about certain technologies we saw at Delft, such as the 3D X-ray scanners for detecting internal quality of fruit. Again, they said that such technologies had their place in quality assurance but it was not useful to them as proving an apple that looks good on the outside has internal defects just subtracts from the total number of apples they can sell to the intermediary trader between them an Albert Heijn.
Support vector machine vs convolutional neural network
One of the main design choices we had to make in our project, was which classification algorithm should we use to classify the fruit. We did not want to choose a convolutional neural network just because it sounded exciting if a simple K-means clustering algorithm with color thresholds would have sufficed. We spoke with an expert in machine learning and he told us that the state of the art in classification algorithms were the convolutional neural network and the support vector machine. We decided to investigate which of the two worked better for our project, and it turned out that the CNN was more suited to our needs. Below is a comparison between the two techniques.
SVM (support vector machines)
In a SVM neural network the training data is represented as points in a multi-dimensional feature space, to this end the data has to be presented as a vector. The idea is that the data can be separated into two groups, which (ideally) consist of clusters of points in this feature space. The SVM then construct a hyperplane that best separates the two groups of points, this is achieved by finding the plane with the largest distance to the nearest training data-point in any class. Once the best fitting hyperplane has been found, it can be used to quickly classify new data into one of the two categories. To use a SVM for image classification, the image will have to be represented as a vector.
Benefits
- Once the hyperplane has been found, the classification of new data can be done really quickly.
- Implementation is relatively easy.
Downsides
- Representing an image as a vector is not ideal. Not only is all spatial correlation between parts of the image lost, we would also have to choose one color channel, convert the image to black and white (losing all information about the colour) or train multiple SVMs who each look at one colour channel (which will take a lot of time).
- An SVM can only separate the training data in two classes, further subdivision of the data would require more SVMs. This means SVMs are not well suited for our project, since our aim is to separate the strawberries into different levels of ripeness.
CNN (convolutional neural network)
In a convolutional neural network in the connectivity pattern between the neurons is inspired by the animal visual cortex. In the visual cortex the neurons are arranged such that they respond to overlapping regions in the visual field, called receptive fields. CNNs are widely used in image recognition, since they can exploit the 2-D data structure of the images.
When used for image recognition CNNs are made up of several layers of neurons, each of these layers processes a receptive field. The outputs of the neurons in each layer are then combined such that their receptive fields overlap, giving a better representation of the original image. This allows the CNN to be invariant to (small) translations in the input. Neurons in adjacent layers are connected using a local connectivity pattern, which allows the network to take spatial correlations and patterns (like edges) in the image into account. The network then looks for patterns at different depths in the set of shapes and patterns, then combines this knowledge, in a few fully connected layers, to classify the image.
Benefits
- CNN are widely used for image recognition and have been used to achieve very high levels of correct classification on various data sets. (MNIST: 0.23%, ImageNet: 0.06656%)
- There are many libraries available for the implementation of CNNs, for instance TensorFlow.
- Can be used to classify images into multiple categories.
Downsides
- Training the network is very computationally intensive.
- A large training set of images is needed, ideally with different lighting conditions, orientation of the objects, colors.
Design
Initial design
Our initial idea was to build an autonomous harvesting robot, made to harvest strawberries. It would be able to determine the level of ripeness of the strawberries and harvest the correct ones accordingly.
To determine the ripeness the robot would make use of a camera mounted on a robotic arm. It would position the camera in front of the fruit and take a picture. This picture would then be send to a neural network, which would have been trained using a large image set. This image set would contain many pictures of strawberries, sorted into different categories based on their level of ripeness. This would allow the neural network to determine the ripeness level of the strawberry in the field, by comparing it to the categories in the database.
Once the robot has determined that a strawberry is ripe enough to be harvested, it would use a grabber and shears mounted on a different robotic arm to grab and harvest the strawberry. The strawberry would then be placed in a basket mounted on top of the robot. Special care would have to be taken not to damage the strawberry, since this would mean that it can no longer be sold.
To move the robot to the next strawberry we planned on using rails. These would be suspended between rows of plants, allowing the robot to reach all of the plants. The positioning of the robot would be fairly simple, since the position of each plant is known. The idea was to move the robot to pre-determined positions on the rail and then use the arm to reach the individual fruits.
This system would allow farmers to utilise much larger farms, since the robots can work day and night without rest. Another benefit is the cost of the robots, if we would be able to keep it relatively cheap the farmer would be able to save a lot of money. Finally, a robot can be a lot more accurate than a human worker allowing for a larger harvesting efficiency. We also thought that the system could easily be adapted to harvest different types of fruit, which would give us a large customer base.
There are several problems with the approach we took at the beginning of the project. First of all, we had never spoken to anyone within the agriculture industry and therefore had no idea if our initial design made any sense. Secondly, we had not really considered the problem from the side of the User, the Society and the Enterprise. But rather, we approached the problem from a completely technical perspective.
It was therefore decided that we would conduct an interview with a farmer, to see what the current situation on a farm is. This would allow us to determine exactly where out solution would fit in and what requirements it would have to fulfil. We also decided that we should visit a farm, to see with our own eyes what the state of the art is. Finally, we visited a European project about the automation of the packing process of food. The result of these visits is described in the section above.
We also realised that building the full robot would be way to much work compared to the scope of the project. It was therefore decided that we would focus on the vision system as our proof of concept.
Final design
For our final design we took a fundamentally different approach. The first thing we looked at was how our system would fit in on a farm and how the farmer should interact with the system. There would still be a robot working in the field, the purpose of this robot is to inspect the fruit and harvest those fruits which are ripe enough to be harvested. The second part of the system is an application that allows the farmer to see how his system is performing, what the status of his growing crops is and to give feedback and improve the performance. The third component would be the back-end, which connects the robot and the application.
Robot
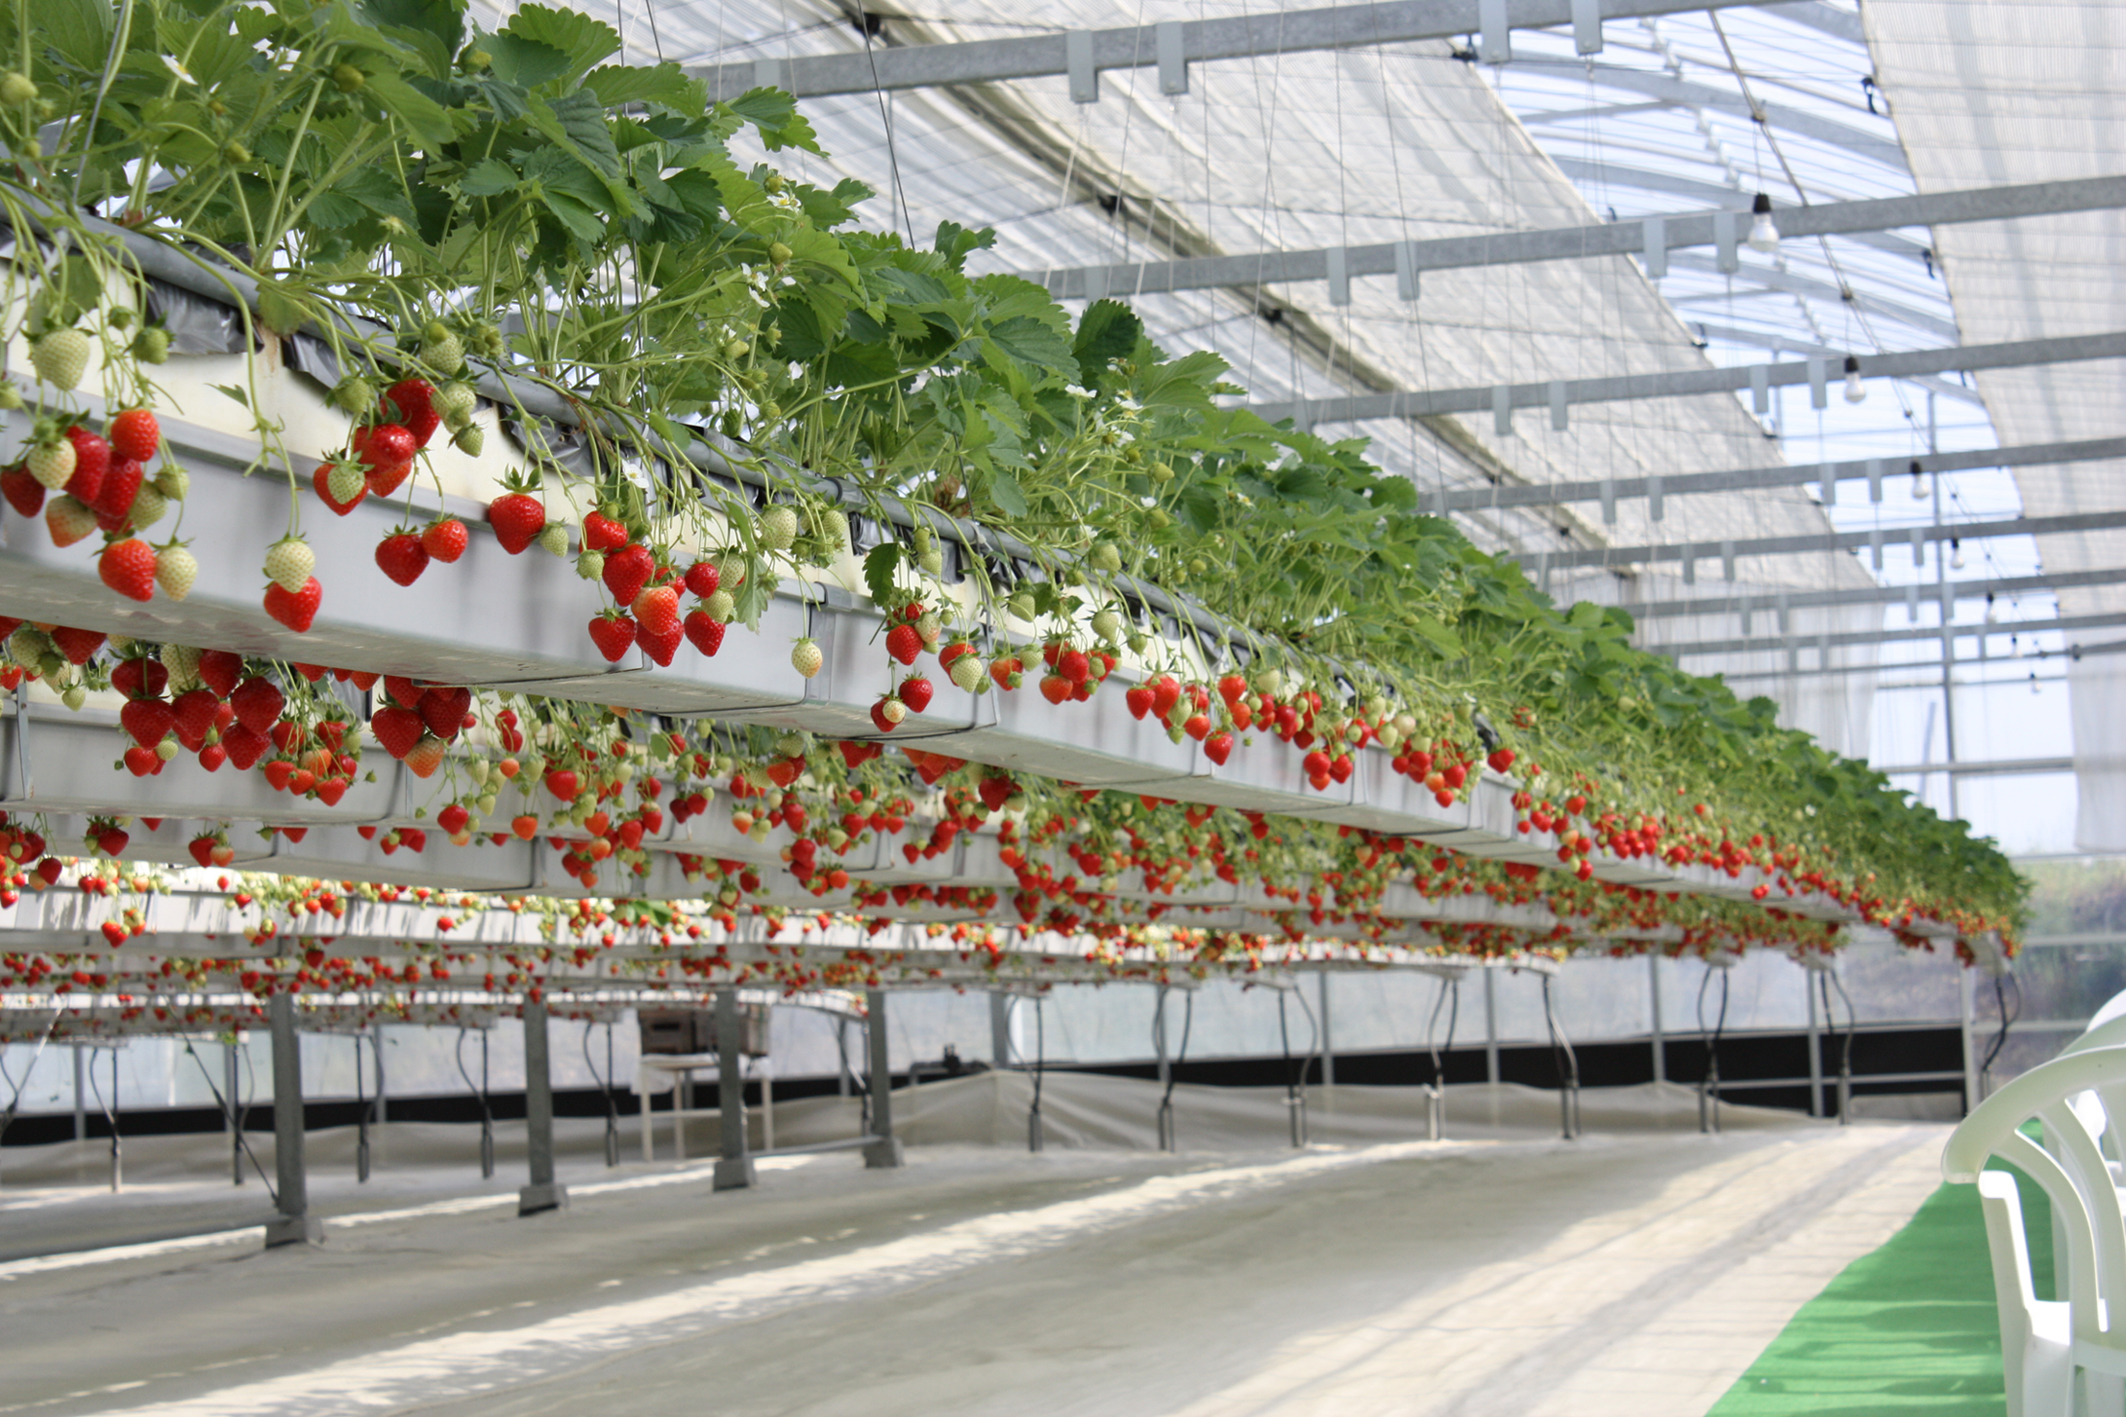
We started by looking at the way that modern strawberry farms are set up, whilst keeping our old design in mind. These modern farms are all build inside greenhouses, which allows for control of the temperature and humidity of the farm. The strawberries plants are grown in rectangular tray, which are suspended from the ceiling at a height of about 1 meter. The plants are placed such, that the grown strawberries dangle from the side of the trays, which allows for easy harvesting. To further optimise the harvesting process, the plants are suspended at a height suited for human pickers. This layout allows for further optimization than we initially anticipated.
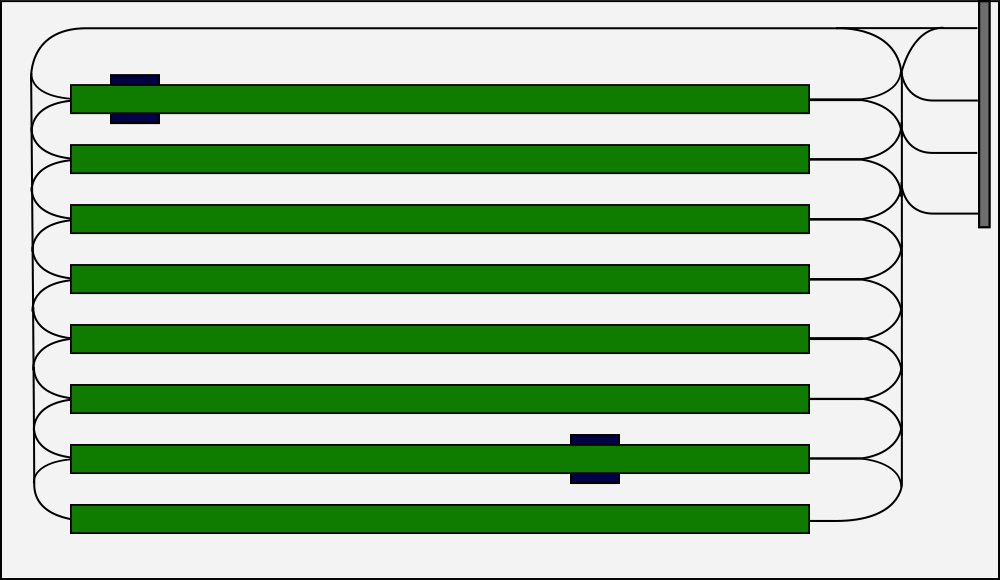

The layout of the plants is fixed, the layout of the greenhouse however, is not. We therefore decided not to build the robot on rails, but rather adopt a system similar to the one used in the warehouses of, for example, Amazon. These warehouses employ robots to transport packets around, black stripes painted on the floor are used as roads by the robots. The stripes indicate where they are allowed to move and since the complete pattern is known by the robots, they can find there way around the warehouse easily. In the greenhouse, these stripes would be placed underneath the trays that hold the plants and would also be connected to a charging station and a place to drop the harvested fruit. A top down view of the envisioned system can be seen in the figure on the right. By guiding the robots around in this way, the system can be easily adapted to work in any shape greenhouse. This easy adaptability is of great interest to farmers, since they do not want to change the layout of their farms.
By allowing the robot to move underneath the trays, it is able to look at the strawberries on both side of the tray at the same time. This greatly increases the efficiency of the robot and allows it to process all of the fruit on the farm much faster. A concept sketch of the robot can be found on the right. The robot would consist of a cubic base, which houses all of the electronics and batteries. This allows us to waterproof the system, such that it can withstand the harsh conditions inside a greenhouse (for a robot, that is).
On top of the base would be a spot to place the basket, where the fruit is collected after harvesting. This allows for easy loading and depositing of the baskets at the base station. The basket would be mounted on a piston, which will allow for vertical movement of the basket. This is done to reduce the distance that the fruit has to fall.
On each side of the robot, a structure would be mounted. Onto this structure we would mount the camera, as can be seen in the sketch the camera system is supported by two metal rods. A third rod, with screw thread, is mounted in the middle, which allows for vertical movement of the camera assembly. Besides the camera for taking images, the camera assembly would also house a mirror galvanometer. This system consists of a mirror that rotates if it receives an electric signal, these mirror are widely used to guide laser beams. In our case we would use the laser to cut the fruit, as suggested by Wilco Biemans. The laser would come from the base and the beam would run in between the metal rods that support the camera assembly.
The robot would have two functions within the system. The first is to inspect the fruit as it grows, as we learned from the apple and pear farmer in Kwadendamme, farmers have no automated way of tracking the development of their crops as they are growing. The vision system on our robot enables it to do this and we can display this information inside the app. This allows the farmer to see the development of his crop, as well as experiment with different soil types and see the results in real time. It would also allow him / her to troubleshoot much more effectively. Since the system would allow the farmer to find areas that are lagging behind the rest of the farm, early intervention might save crops in these areas.
The second function of the robot would be to harvest fruit that is ripe. If the robot detects that a fruit is ripe enough to be harvested, it would stop moving along the tray with strawberries and use the laser to cut the stem of the ripe fruit, just about the crown of the strawberry. The strawberry would then fall down, a short distance, into the basket in the middle of the robot.
Application
It was clear that the farmer should be able to monitor the system without having to go into the field or greenhouse. To this end we decided to build a mobile application, allowing the farmer to monitor his harvesting system from within the comfort of his home. The app would display statistics about the system, such as power usage, potential defects, temperature of the greenhouse, etc..
The app would also allow the farmer to give feedback. If the system is unsure whether a certain fruit is ripe enough to be harvested, it would send the image it took to the farmers application. The farmer could then tell the system whether or not the fruit was ripe enough. This information could then be sent back to system and incorporated into it's grading system.
Since the feedback of one farmer is not going to have a big impact on the systems performance, we decided to combine the feedback from multiple users. This means that all of the systems have to utilise the same database, which has two main benefits:
- When the robot sends out a picture that it could not classify with enough accuracy, multiple users will receive it on their application. Individually, they can decided whether or not the fruit is ripe enough. If enough of these users agree, the image can be added to the database to improve the accuracy. Since the feedback from multiple users is considered, the chance that the image is classified incorrectly is greatly decreased.
- Because the system is receiving feedback from multiple users, the number of new pictures added to the database is a lot larger. This means that the impact of the feedback will be a lot greater and the overall accuracy of the system a lot higher.
The third and final main feature of the app is the display of information about the crops that it receives from the robot. This information consists of the amount of fruit in each tray and the level of ripeness of each of these fruit. The app can use this information to build density maps of the farm. Several maps we had in mind are:
- The average quality level of the fruit in several sections of the farm.
- The expected revenue in these sections.
- The amount of processed fruit per section.
- The amount of fruit that is present in a certain section.
These maps can be used by the farmer to gain insight into the growth of his crops as well as detect problems in certain areas of the farm.
Back-end
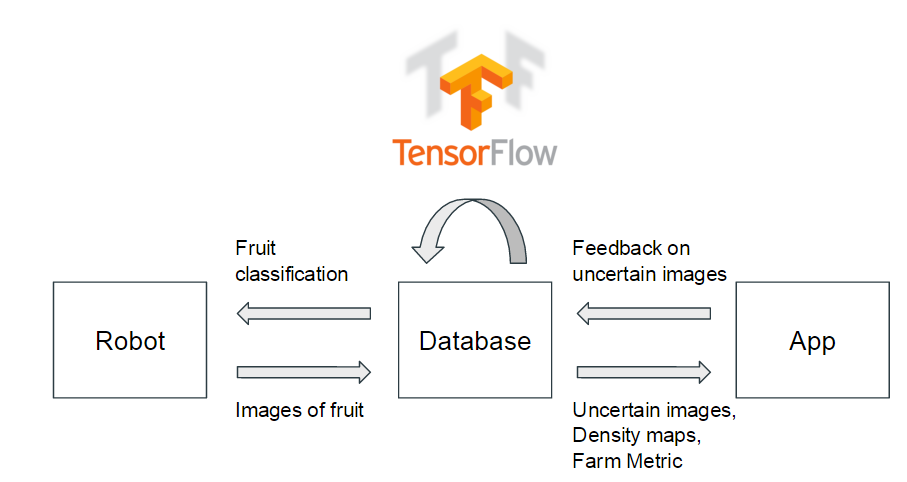
The back-end of the system connects the robot and the application. It consists mainly of a large database with all of the pictures sorted into different categories. The robot would communicate with the back-end in two ways. Firstly, it will send the pictures that it takes to the database for classification. The image will then be classified using the CNN and the result will be communicated back to the robot, which then decides whether or not to pick the fruit.
The app also interacts with the database, images are not classified with enough certainty will be send to users of the app and the app will send their feedback back to the database. The database will also send the information, gathered by the robot, to the app. Where it is used to create the density maps.
The feedback of the users will be implemented into the database at predetermined time intervals, which can be chosen by the farmer. This is done because the neural network has to be retrained every time feedback is implemented. This retraining is a lengthy process (4 hours with ~200 images) and therefore cannot be done every time a user gives feedback.
Image sets
We are creating image sets of ripe and unripe strawberries using the format as presented here:
The images are all 64x64, twice the height and width of the CIFAR-10 set, as we will use less images but better quality pictures. These images will be converted into a binary format and segmented into training sets. These images were taken with a Kinect camera attached to a Raspberry Pi. Uniform lighting conditions were used to match that of a quality control facility.
Vision system
The robot needs a vision system to detect whether a fruit in its sight is ready to be plucked. When a fruit is detected, it should be left hanging when it is not ripe (green in case of strawberries). When the fruit is ripe or overripe it should be plucked. Overripe fruits will be filtered during later quality assessment phases which are already in place. This now often happens during the packaging phase.
For the vision system we chose to use image recognition using machine learning. This has a couple of advantages over simple color detection. It is not really hard to implement using preexistent libraries and will provide good results already with a small dataset. For simple color detection you also need to detect the position of the strawberry to cancel out different background colors. A color detection system also needs to be adjusted for each different food category. For the machine learning system however, it is only needed to provide a new dataset for a new food category and retrain the model. A PhD student at Wageningen UR also was interest in using machine learning for this. They did not use it because they had a slightly different use case for which a statistical model was more appropriate.
A disadvantage of the use of machine learning is the required computing power. Training of the model is not the main computing power problem here, the existing model can be retrained once a week for newly added images. Retraining only takes 20-30 minutes on a single core. Images taken by the robot need to be classified using the model, to determine whether or not the fruit should be plucked. To do this, for each image a considerable amount of computing power is needed. Experimental results have shown that using a small server with only 2 cores it will take around 10-20 seconds to classify an image. A system with 16 cores reduces the classification time to around 1 second. This system is however more expensive, when using a Google virtual machine the hourly cost is $0.779. This is however not a significant cost compared to farm workers. The system can also be easily shared with multiple farms.
TensorFlow library
For our classification of fruit ripeness, we are using TensorFlow, an open-source Python/C++ library for machine learning. We are using a convolutional neural network (CNN) with a custom image set of different fruit with different levels of ripeness. We have followed the tutorials for the basic MNIST dataset as well as the CIFAR-10 CNN. We are using a modified CNN based on the Inception v3 model.
We based our implementation of the CNN on the Inception model as detailed here.
The training of the neural network can take a significant amount of time. It has taken more than four hours on a number of occasions to train the CNN using Docker running Tensorflow on the standard-issue TU/e laptop.
Back-end/database
We have set up a Python web server to act as a back-end for the vision system. It has an API which can be used to classify/label an image. This will be used on the robot to determine whether a fruit should be plucked or not. In the demo it is shown on the Raspberry Pi which uses this API. An other use case for this API is to add images to the database. This is used in the farmer front-end application, so that he/she can improve the dataset with own classified images.
- Python webserver
- POST API: add images to database
- POST API: label/classify image
- POST API to hook up to app
- TODO add code link
Demo setup
We decided to use a standard off-the-shelf Raspberry Pi as the microcontroller for our implementation of the vision system. The idea is that any device can post an image of a ripe/unripe fruit to the database and receive a classification. Using the Raspberry Pi demonstrates that any device with internet connection and sufficient processing power to use our fruit classification system.
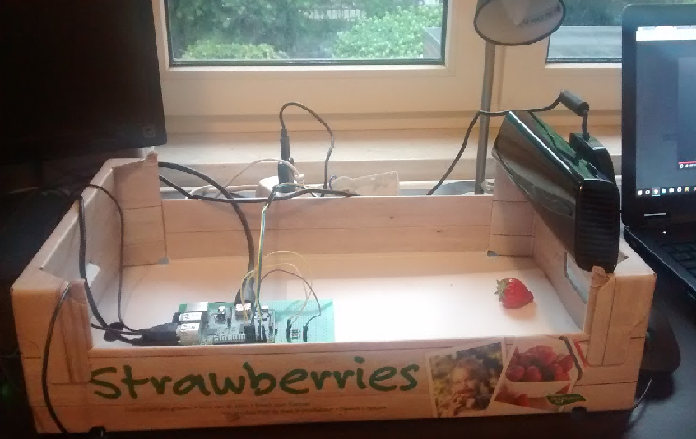
The Raspberry Pi used a single python script to turn on the spotlight, take a picture using the Kinect, and flash a corresponding red or green LED if the fruit was rejected or accepted. The code can be found here. An image of our demo setup is shown above.
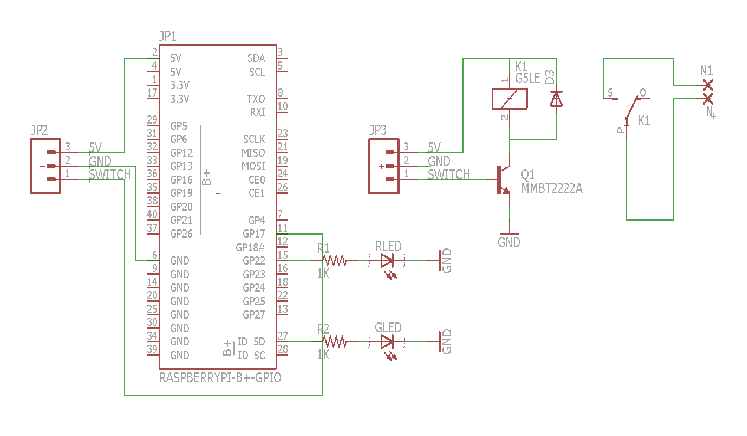
To turn on the spotlight, a GPIO on the Raspberry Pi was connected to a custom relay board that we produced, which was in turn connected to mains electricity. The neutral wire from the mains split into two wires, which could be electrically connected by the relay, turning on the light. Using a MOSFET, we were able to switch on/off the relay using a 3.3V GPIO from the Raspberry Pi. A video of the demo can be found here.
App
Idea behind the app
One of the requirements of the system was for the user/farmer to be able to add pictures of unripe and ripe fruit to the database in order to be improve the system. This was chosen because if it was hypothesized that more pictures under different lighting settings and different circumstances, of different classifications of the fruit would results into a better and faster neural network, that would improve the overall performance of the system. Furthermore we also wanted to give the farmer an extra way of getting more insight about his/her farm and the used system. For example how much fruit was picked, the overall quality of this fruit, the temperature and ways to connect to the CCTV system of the farm en keep an eye on everything.
We decided to use an app for this since we cannot expect the user to have knowledge about programming or any other difficult means to add his own labelled pictures to the database. With this app the farmer would be able to add pictures to the database and label them, get more information about his/her farm and he/she would be able to go into the database to delete or change the labels of pictures.
We decided to first create screenflows and functional powerpoint versions of the app, to be able to get a good look and feel before programming the "real" app. This often resulted in some slight changes because we found that aspects were not working nicely or lacked an intuitive feel.
Screenflows
Version 1
The first version was made during the third week of the course and formed the base for the first version of the app. The initial idea was that a farmer should be able to alter the database. Add new pictures to the database of instances that do not meet expectations when checking the strawberries that the system had picked, such that it could learn by using this pictures for additional training. Finally it should have an option to view what the robot is doing by live streaming the footage from the robots' camera. [7]
Version 2
After feedback we rethought the apps' requirements and concluded that it wouldn't be useful if the farmer makes pictures himself, since adding 10 will not have any impact on a database of 10k pictures. Therefore we assume that the system is operable at multiple farms and that they share a database in the cloud. By adding a Tinder like functionality for reviewing pictures taken by the robot that day we hope to receive more feedback (as multiple farmers will do this regularly) and thus increasing the learning capabilities of the system. Additional benefit is that this costs the farmer less work and is perceived as being more fun. The database aspect was changed in a way that it now displays statistics about the database, under which the last version and when that update took place and how many pictures are in there. The live feed was replaced by an overview of the farm with different 'filters' which show the performance of different sections in terms of among others revenue, average quality and expected harvest in coming days. This can be seen for the farm as a whole, but also per section individually. [8]
Different versions of the app
Version 1
The first version of the app was made during the 4th week of the course. This app had the functionalities that were described in the "idea behind the app" section. The user could log in to his/her personal account, take pictures, label them and add them to the database. Furthermore the farmer could get insight in the performance of his/her farm and could change and delete pictures from the database.
The first version of the app can be found File:Use app.pdf.
Version 2
The second version of the app was made during the 6th week, it differed from the first version because the user was not able anymore to take pictures and upload them themselves. During the meetings it was found that taking a picture and labeling it and then uploading it would simply take too much time for the farmer to make it profitable. Therefore the uploading pictures part was replaced by a rating part. The system, which was either placed on the conveyor belt or on the robot would take pictures of a fruit it was not yet sure whether the quality was high enough. These pictures would then be stored and presented to the farmer who could then rate them as good or bad by swiping them either to the right or the left of the screen. This ensured that the user could quickly rate the pictures and improve the system, by feeding it more and more pictures every time.
The second version of the app can be found here: File:Use app v2.pdf
Version 3
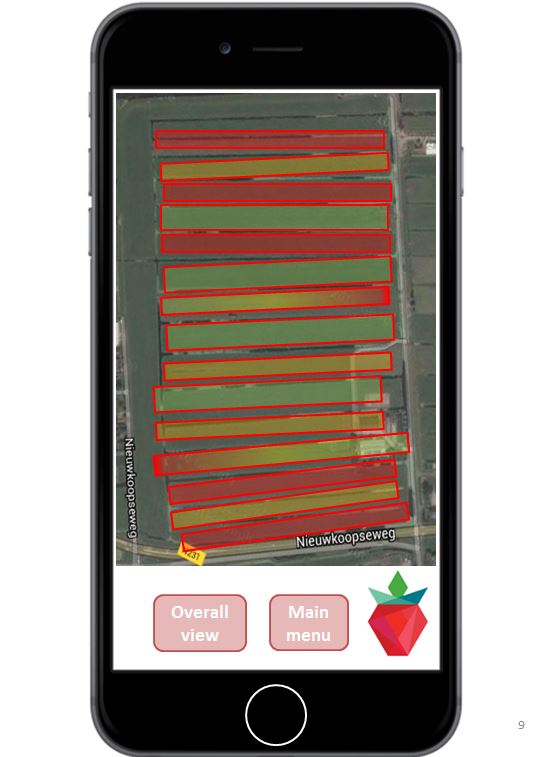
The third version of the app was made during the 7th week of the course, and also had some major differences from its earlier versions. The main difference was that the insights into the farm where now done per regio of the farm. This means that the farmer was now able to see, by using color coding, which sector of its farm was performing best and worst and everything in between, an example of this can be seen in the picture. The farmer could then click on the regio and could see more statistics about this sector and the performance. Furthermore the farmer could also see an overall view of all his produce and the overall performance of the farm.
The third version of the app can be found here: File:Use app v3.pdf
Version 4
The fourth version of the app was also made during the 7th week of the course and included multiple screens that were color coded. The farmer could now also use the earlier mentioned segments for seeing the following stats: Processed today, Average Quality, Revenue, Time to harvest and Kgs left.
Furthermore the database tab was changed to an overall system performance overview, since it was thought that the changing 1 or 2 pictures each time would not make a significant contribution to the performance of the system.
The fourth version of the app can be found here: File:Use app v4.pdf
Version 5 and Version 5.1

The fifth and fifth.one version of the app were also made during the 7th week and included some minor changes with regard to the fourth version. The names of the buttons were changed in the main menu and numbers were added to the different segments in the overview, this would ensure that the farmer would have a better overview and did not have to press any buttons to check on the numbers of each sector. Furthermore the time to harvest indication was changed to an overview of how much a farmer could pick a day. This was also added to the total overview in order to give the farmer an idea of how much produce he can expect for certain days. This can then be used to schedule his/her workforce and create a more efficient farm. The differences between the two versions can be seen in the picture on the right.
The fifth and fifth.one version of the app can be found here: File:Use app v5.pdf & File:Use app v5.1.pdf
Version 6
The sixth and thus final version of the app was made during the final week and included some extra screens. It gave the user the possibility to zoom in on the different levels, making sure that he/she can get even more insight on a more detailed level. This could be done by clicking on one of the sectors/rows, which would give the user a better overview of the results of that specific row/section. It was decided to use rows as a division, and not segments or areas or any other way of grouping, because the farmers that were visited by our team explained that they mostly experiment with different soil contents and irrigation plans per row. Therefore they said that the division per row was detailed enough for a fist level.
The sixth version of the app can be found here: File:Use app v6.pdf
The final app
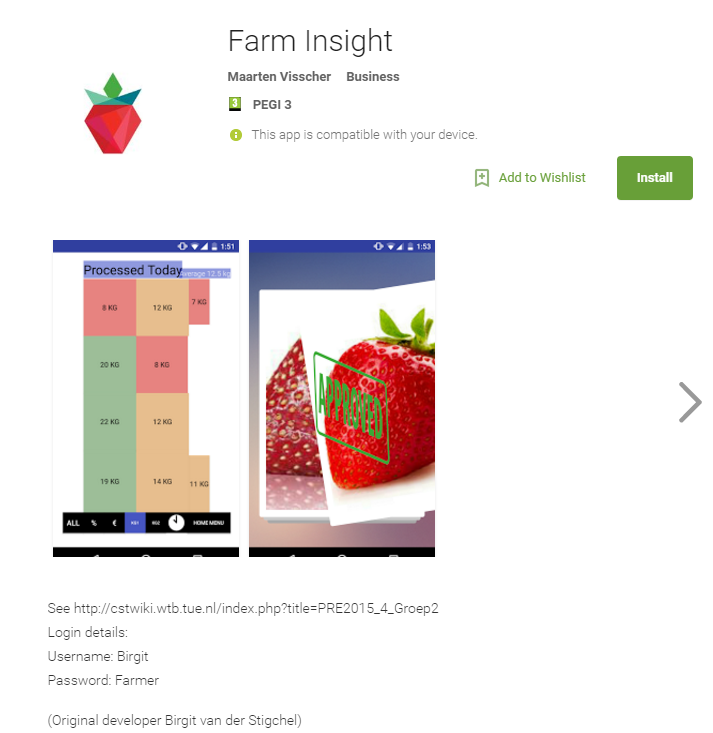
For the final app, we choose to focus on three main features.
From our interviews with farmers and the visit to Wageningen, we found that transparency of the system is very important to the farmers. Also the farmer wants to be able to distinguish between different parts on the farm, for example if he wants to experience with different kinds of fertilizers. These last remarks has led our app to have a "Insights" part, the first main feature. In this part of the app, the farmer can obtain information about different parts of his farm, in terms of how much fruit is left, how much fruit is picked, the revenue, the average quality of the fruit and an estimated average time to harvest the majority. This information can be seen for the overall farm, but can also be derived for a specific part of the farm. Within one area of the farm (the screen obtained when clicking on an area), the system also provides an estimation on when the majority of the farm must be harvested. This estimation is based on the average quality percentage, the quality of all the fruits in the specific area averaged out. With this part of the app, the farmer is able to easily troubleshoot problems that might occur at their farm, or detect which areas need more care.
The second main feature of the app is that it allows the farmer to help improve the learning algorithm, by adding pictures to a database. For this, we made a page in the app where all the pictures taken by the kinect camera that are in a specific range of ripeness (for example between 70% to 90% ripeness) are send to the app, where different farmers can swipe swipe the pictures of the fruit to "approve" or "disapprove" the fruit. This makes it able for the farmer to influence the system, by giving feedback. One of the concerns the Pick and Pack program in Wageningen is that the system will be a black box. It is very unpleasant for the user to have no insides in the system. The opportunity to give feedback contributes to the transparency of the system.
Once the farmer chooses a manual classification for the fruit, the image is sent back to the database with a label for the unique identifier of the image, along with a label. If the image was previously in the accepted category, and the image was rejected by the farmer, then the image is moved to the rejected category (and vice-versa if the image was in the rejected category and the farmer accepts the image). However, if the farmer’s classification is the same as database, then the image remains in that category, and is marked as confirmed. In the case that the system is multi-tenant, an ambiguous image can be sent to a fixed number of farmers, and the majority vote decides in which classification the fruit belongs. Again, this plays into one of the main strengths of our project: it is a scalable system, in which farmers can share images of their fruit with other farmers for mutual benefit.
The last feature of the app is a total overview and some insights in how the database looks like. Here the farmer can see how much pictures are in the database, and how they are classified (ripe enough to pick or not). It also provides year-based information, like the kilos picked this year.
The app was made using Android Studio, we decided to go for this program because it is fairly easy to use and since Android software is supported by many phone/tablets manufacturers.
link to ZIP-file containing the app
Discussion
Suggestions for further research or improvement
Possible improvements with respect to the general system
- An experiment could be done to measure the impact of adding pictures to the database. To determine what the maximum size of the database should be before adding new pictures does not change the result.
- An experiment to determine the accuracy of the system has to be performed. Preferably with a large number of ripe and unripe strawberries.
- We could run test to see how the systems performs if multiple robots are gathering information at the same time.
- The database and the app should be connected to each other, currently the app receives images from the database but the feedback that the user gives is not implemented yet.
- Models need to be made which utilise the data gathered by the robot to make predictions about the farm.
- A prototype of the robot has to be build and tested on an actual farm.
- The neural network can be expanded to work on different types of fruit.
- A system to implement quality control on the farm could be developed.
Possible improvements for the application
- In an improvement for the application, it might be nice to add a setting in which the farmer can specify how detailed he wants his density maps on the app. For example, have it be divided in 10 areas, or have the 10 areas being under-divided in another 10 areas.
- Improvement in the prediction, which could be made more accurate, but one could also think of ways to display the information in a more useful manner.
- Another improvement can be a 3D version, in which the farmer can look at the pictures at the rating system from different angles to better determine the ripeness.
- This system can also be used to determine the aesthetic appeal of the fruits.
- The UI design of the app can be greatly improved, currently we just have the tech demo.
Conclusion
We were successfully able to create a working fruit classification system in the eight weeks that we had. Our initial design developed and evolved over the course of the project as we obtained new insight about what farmers needed, and how the current agriculture industry in the Netherlands conducts its quality assurance, manufacturing, harvesting, etc. The whole system came together into one convincing demo, where a Raspberry Pi was able to take a picture of a strawberry using a Kinect and send it to our own database for classification. The number of images in our database was much smaller than we expected for the results that we obtained. In our tests, our system was over 90% accurate on obviously red or green strawberries, while it maintained a slightly lower accuracy on the strawberries that could be either or (this of course depended on which side of the strawberry the picture had been taken). We also fully established connectivity between our mobile app and the database to provide user feedback. All in all, we were able to provide a number of technical realizations within our project, including the Raspberry Pi system, which demonstrated actuation (via LEDs and electromechanical relays) in conjunction with the fruit classification. This project was fruitful on a number of different fronts (pun intended), and we hope this research will be continued in the future instances of this course.
Research
Manual strawberry harvesting process
Harvesting robots
- Description of an autonomous cucumber harvesting robot, designed and tested in 2001
- Paper from 1993 describing the then state-of-the-art and economic aspects. It has a chapter on economic evaluation.
- Recent TU/e paper discussing the state-of-the-art on tomato harvesting. It focuses on the mechanical part and does not include sensing and detecting.
Sensing technology
Older Research
- Yamamoto, S., et al. "Development of a stationary robotic strawberry harvester with picking mechanism that approaches target fruit from below (Part 1)-Development of the end-effector." Journal of the Japanese Society of Agricultural Machinery 71.6 (2009): 71-78. Link
- Sam Corbett-Davies , Tom Botterill , Richard Green , Valerie Saxton, An expert system for automatically pruning vines, Proceedings of the 27th Conference on Image and Vision Computing New Zealand, November 26-28, 2012, Dunedin, New Zealand Link
- Hayashi, Shigehiko, Katsunobu Ganno, Yukitsugu Ishii, and Itsuo Tanaka. "Robotic Harvesting System for Eggplants." JARQ Japan Agricultural Research Quarterly: JARQ 36.3 (2002): 163-68. Web. Link
- Blasco, J., N. Aleixos, and E. Moltó. "Machine Vision System for Automatic Quality Grading of Fruit." Biosystems Engineering 85.4 (2003): 415-23. Web. Link
- Cubero, Sergio, Nuria Aleixos, Enrique Moltó, Juan Gómez-Sanchis, and Jose Blasco. "Advances in Machine Vision Applications for Automatic Inspection and Quality Evaluation of Fruits and Vegetables." Food Bioprocess Technol Food and Bioprocess Technology 4.4 (2010): 487-504. Web. Link
- Tanigaki, Kanae, et al. "Cherry-harvesting robot." Computers and Electronics in Agriculture 63.1 (2008): 65-72. Direct Dianus
- Evaluation of a cherry-harvesting robot. It picks by grabbing the peduncle and lifting it upwards.
- Hayashi, Shigehiko, et al. "Evaluation of a strawberry-harvesting robot in a field test." Biosystems Engineering 105.2 (2010): 160-171. Direct Dianus
- Evaluation of a strawberry-harvesting robot.
State of the art
A small number of tests have been done with machines for harvesting strawberries. These are large, bulky and expensive machines like Agrobot. Cost prices are in the order of 50,000 dollars. Todo: add citations.
A lot of research is done towards inspection by means of machine vision. Todo: add citations and continue.
Planning
Week 2
Clarifying our project goals
Working on USE aspects
Finalize planning and technical plan
Sketch a prototype
Week 3
Preliminary design for app
First implementation of app
Database/Server setup
CNN, and basics of neural networks
Week 4
App v1.0 with design fully implemented
Kinect interfacing to Raspberry Pi completed
USEing intensifies
Finish back-end design and choose frameworks
Week 5
App v2.0 with design fully implemented and tested
Further training of CNN
Working database classification (basic)
Casing (with studio lighting LED shining on fruit)
Week 6
Improve CNN
Expand training sets (outside of strawberries (if possible))
User testing on app
Reflect on USE aspects and determine if we still preserve our USE values
Week 7
Implement feedback from testing app
Improve aesthetic appeal detection (if time)
Week 8
Finish everything
Buffer period
Final reflection on USE value preservation
Week 9
Improve wiki for evaluation
Peer review
Fallback:
App for user to report feedback in the form of images of high/low quality fruit.
Have Rpi take pictures using Kinect and send to database
Choose a more binary classification (below 50%/above 50% quality)
Flesh out the design more (if implementation fails)
Additonal references/Further reading
- Aeroponics (we most likely won’t use this as an irrigation method)
- Why to avoid monoculture


