PRE2015 3 Groep2 week6: Difference between revisions
| Line 193: | Line 193: | ||
= First version report = | = First version report = | ||
[[Media: | [[Media:First_version_report_group_2_quarter_3_2015-2016.pdf]] | ||
= References = | = References = | ||
<references/> | <references/> | ||
Revision as of 11:51, 18 March 2016
Further testing
NOTE: Experiments in random order.
Due to limited battery time, a small adjustment has been made to the experiment to increase productivity. Instead of testing with only one test subject at the time, two people will be standing next to each other as the drone approaches them. Because of the accuracy of the drone, which is about 0.5 meter, both test subjects should feel as they are being approached by the drone. The test subjects have approved it and indicate that because the full focus is on the drone, it does not influence the results. Afterwards both test subjects are questioned separately so their opinions will not influence each other.
Experiment 2
Results A
| Experiment | Very bad | Bad | Neutral | Good | Very good |
|---|---|---|---|---|---|
| 1A | X | ||||
| 2A | X | ||||
| 3A | X | ||||
| 4A | X | ||||
| 5A | X |
Results B
| Experiment | Very bad | Bad | Neutral | Good | Very good |
|---|---|---|---|---|---|
| 1B | X | ||||
| 2B | X | ||||
| 3B | X | ||||
| 4B | X | ||||
| 5B | X |
Results C
| Experiment | Very bad | Bad | Neutral | Good | Very good |
|---|---|---|---|---|---|
| 1C | X | ||||
| 2C | X | ||||
| 3C | X | ||||
| 4C | X | ||||
| 5C | X |
Analyzing results

T-test
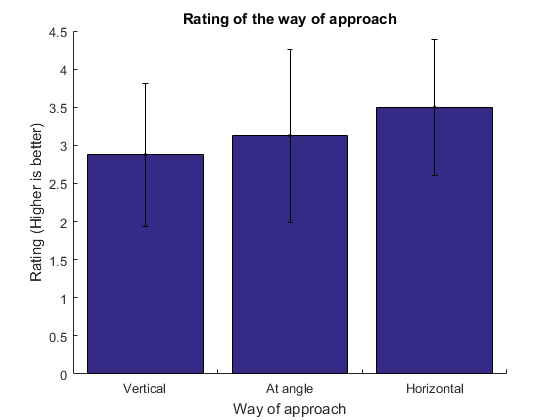
A T-test gives the possibility to decide if an hypotheses needs to be rejected or not [1]. The hypothese in this case are the values: 'Very bad' (1), 'Bad' (2), 'Neutral' (3), 'Good' (4) and 'Very Good' (5). A t-test will be conducted of all the hypotheses value of the different approach routes.
To determine how likely a rating will occur during a specific approach, a p-value will also be computed. This value stand for the probability that an user will rate the experience a certain way.
Shown in the table bellow are the p-values of the different ways of approaching. Values which are rejected by the t-test (one-tailed 95% coincidence interval, α = 0.05) are marked with an 'X'.
| Rating | Vertical | At an angle | Horizontal |
|---|---|---|---|
| Very bad | 0,051606 | X | X |
| Bad | 0,47662 | X | X |
| Neutral | 0,30456 | X | 0,30456 |
| Good | X | 0,3739 | 0,47662 |
| Very good | X | X | 0,051606 |
First version report
Media:First_version_report_group_2_quarter_3_2015-2016.pdf
References
- ↑ Diez, D.M. Barr, C.D. Çetinkaya-Rundel, M. (2012) OpenIntro Statistics. Second Edition