Input: Difference between revisions
Jump to navigation
Jump to search
No edit summary |
No edit summary |
||
| Line 11: | Line 11: | ||
[[File:sleepcycle_irregular_sleep.png]] | [[File:sleepcycle_irregular_sleep.png]] | ||
To model this pattern, we assumed that the peaks and valleys of the graph are sinusoidal with random periods, amplitudes and equilibriums. | |||
globals [y | globals [y | ||
Revision as of 17:22, 28 February 2016
Back to main page: PRE2015_3_Groep4
To the code: Code
To the output: Output
Brightness
Temperature
Sleep model
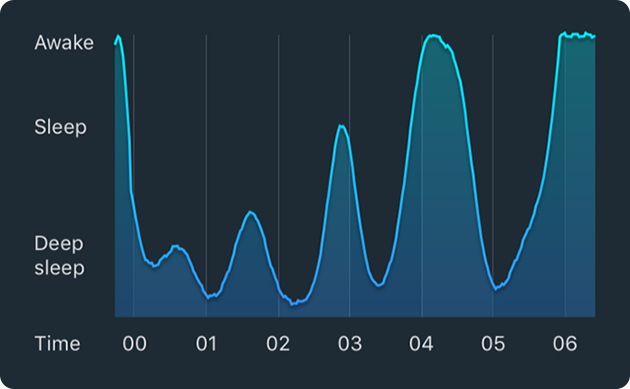
The Sleep Cycle App provides graphs to the user that show his measured sleep behavior during that night. Here's an example:
To model this pattern, we assumed that the peaks and valleys of the graph are sinusoidal with random periods, amplitudes and equilibriums.
globals [y
         Tgem
         start
         T
         p
         rc
         x
         R
         time
         stage
         test]

to Setup
  clear-all
  set y 100
  set Tgem (90 * 60)
  reset-ticks
end

to Go
  foreach [1 2] [
    set start y
    set T -1
    while [T < 0] [set T (random-normal Tgem 1800)]
    set p (random-float 1.0)
    set rc (4 / (1 + exp((ticks - (2.5 * Tgem)) / 20000)) - 2)
    ifelse rc > 0
      [set x (0.5 - (1 / rc) + sqrt((2.0 / rc) * p + (rc ^ -2) - (rc ^ -1) + 0.25))]
      [set x (0.5 - (1 / rc) - sqrt((2.0 / rc) * p + (rc ^ -2) - (rc ^ -1) + 0.25))]
    ifelse ? = 1
      [set R (x * start / 2)]
      [set R ((x - 1) * (100 - start) / 2)]
    set time (n-values (T / 2) [?])
    foreach time [
      set y (R * (cos (360 * ? / T)) + start - R)
      set stage ((y - (y mod 25)) / 25 - 3)
      set test (1 / (1 + exp(ticks)))
      tick
    ]
  ]
end
