PRE2020 1 Group1: Difference between revisions
| Line 651: | Line 651: | ||
|} | |} | ||
==Temperature Screening== | ==Temperature Screening with Omnisense Sentry MK4== | ||
Omnisense Sentry ML4 | |||
The most important specifications of thermal cameras are explained. A comparison of the most popular temperature screening systems and thermal cameras is shown in table XXX. | The most important specifications of thermal cameras are explained. A comparison of the most popular temperature screening systems and thermal cameras is shown in table XXX. | ||
Revision as of 18:25, 14 October 2020
COVID-19 symptom detection system for choke points and crowded places

Group members
| Name | Student ID | Department |
|---|---|---|
| Davide Fabbro | 1255401 | Electrical Engineering |
| Lieke Nijhuis | 0943276 | Innovation Sciences |
| Ikira Wortel | 1334336 | Electrical Engineering |
| Wout Opdam | 1241084 | Mechanical Engineering |
Problem statement and objectives
COVID-19 is a disease that as of 5 september 2020 has 26.171.112 confirmed cases and 865.154 confirmed deaths worldwide[1]. This pandemic has caused many countries to go into lockdown, and strict measurements are being taken to lessen the spread of the disease. The virus easily spreads itself in crowds, and this is where the idea of a COVID-19 symptom detection system in choke points and crowded places was born. In this study we will focus on the Heuvel Galerie Eindhoven in particular.
The objectives of this system are:
- Detection of COVID-19 symptoms in a crowd
- Suggesting detected people with symptoms to take a more accurate symptom test and possibly denying them access
- Applying a form of social control in order to make people follow the rules better
- Creating a general feeling of awareness and safety
The project
This project is part of the course 0LAUK0 Robots Everywhere. The project concerns a COVID-19 symptom detection system for choke points and crowded places.
Approach
A literature study will be performed on the feasibility of a COVID-19 symptom detection system for choke points and crowded places. This literature study will include an investigation of possible privacy issues and legal issues that can arise when such a system is deployed in public places, an identification of the users and their needs (partly through questionnaires) and a study on the state of the art and similar systems.
The requirements, preferences and constraints for the design will be partly based on the results of questionnaires conducted among shopping people and shop owners at the Heuvel Galerie. A design for the hardware of the system will be made by weighing the pro's and con's of different detection options against each other and taking into account the user requirements. Pseudocode will be written for the software behind the system, taking into account possible privacy issues and also the user requirements. The effectiveness of the design will be evaluated through simulations.
Using the results from the simulations, a cost-benefit analysis and a final evaluation questionnaire, a conclusion on the feasibility of the designed system can be drawn.
Deliverables
The deliverables for this project include:
- Literature/feasibility study of a COVID-19 symptom detection system for choke points and crowded places.
- Design of the system, including a hardware design, pseudocode for the software and posters.
- Design for the layout of the system at one of the Heuvel Galerie entrances.
- Simulations of the effect of the system on a flow of people and on the throughput.
- Cost-benefit analysis.
- A wiki page.
- A presentation video.
Planning and milestones
In the figure below, the project planning is given. The left most column contains the milestones for the project. The column to the right of the first column contains all tasks that need to be completed in order to achieve that milestone.
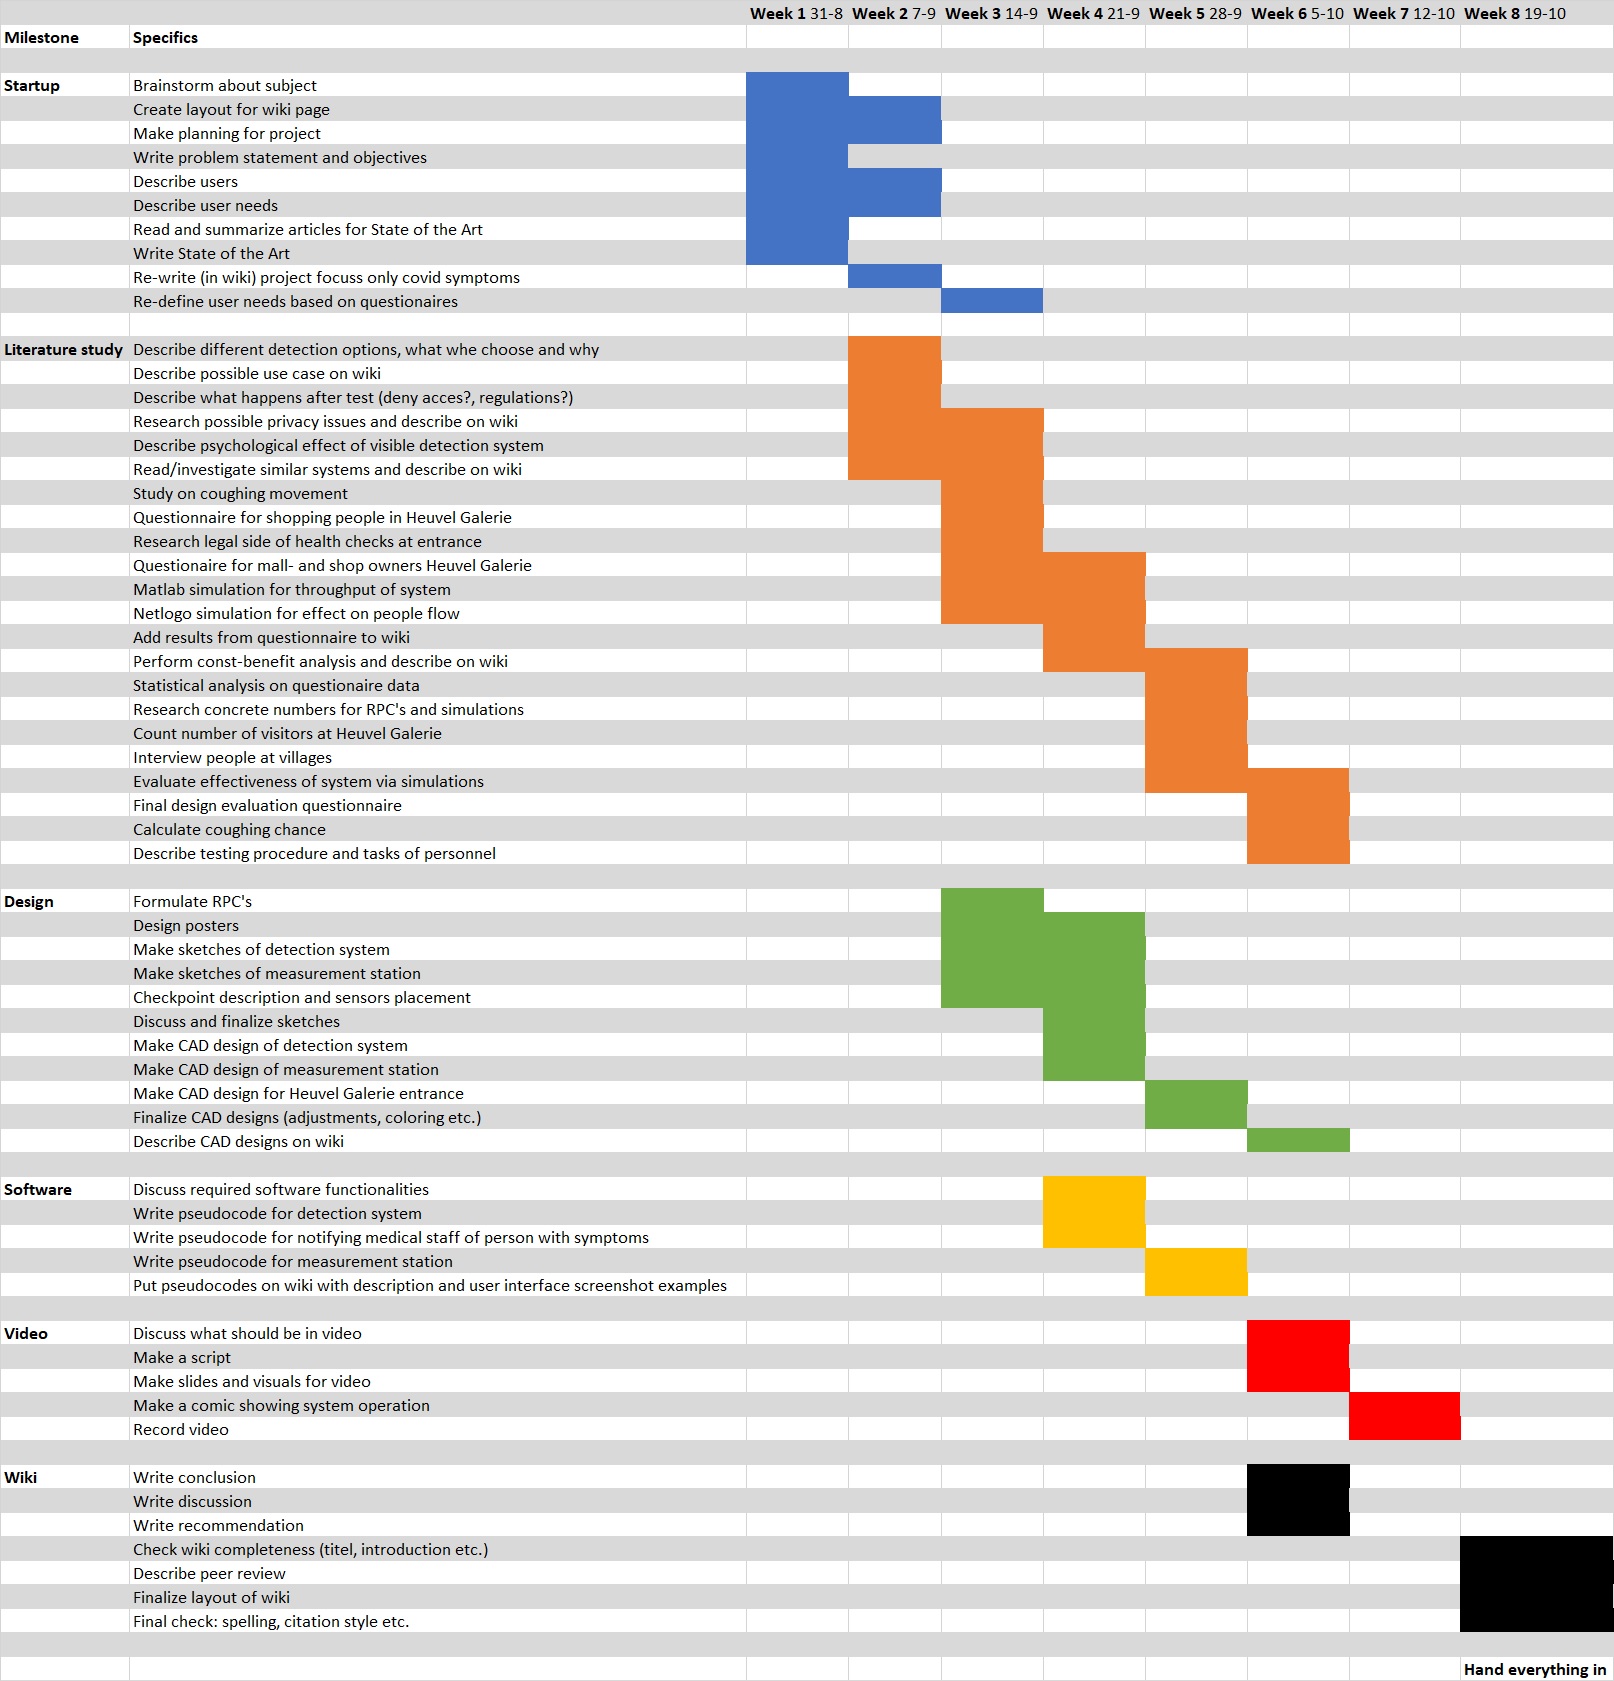
Here, an overview will be given of the tasks that need to be completed per week (corresponding to the figure above), and who is responsible for them:
Week 1
| Task | Person | Completed |
|---|---|---|
| Brainstorm about subject | Everyone | Yes |
| Create layout for wiki page | Wout | Yes |
| Make planning for project | Wout | Yes |
| Write problem statement and objectives | Lieke | Yes |
| Describe users | Ikira | Yes |
| Describe user needs | Wout | Yes |
| Read and summarize articles for State of the Art | Everyone | Yes |
| Write State of the Art | Davide | Yes |
Week 2
| Task | Person | Completed |
|---|---|---|
| Describe psychological effect of visible detection system | Lieke | Yes |
| Create layout for entire wiki page | Wout | Yes |
| Update planning of project | Wout | Yes |
| Redefine USE'ers | Ikira | Yes |
| Redefine USE'ers needs | Wout | Yes |
| Describe possible use case (Heuvel Galerie) | Wout | Yes |
| Research possible privacy issues and describe on wiki | Ikira | Yes |
| Describe what happens after test (deny acces?, regulations?) | Lieke | Yes |
| Describe different detection options, what we chose and why, why no 1.5m detection | Davide, Lieke | |
| Re-write (in wiki) project focuss only covid symptoms | Davide | Yes |
| Read/investigate similar systems and describe on wiki | Davide | Only Thrm. Img |
Week 3
| Task | Person | Completed |
|---|---|---|
| Redefine users needs based on questionnaire and formulate RPC's | Everyone | Yes |
| Make sketches of detection system | Wout | Yes |
| Make sketches of measurement station | Wout | Yes |
| Checkpoint description (research conventional checkpoints) and sensors placement | Davide | Chekpnt |
| Research possible privacy issues and describe on wiki | Ikira | Yes |
| Describe psychological effect of visible detection system | Lieke | |
| Questionnaire for mall- and shop owners of Heuvel Galerie | Lieke | Yes |
| Questionnaire for shopping people in Heuvel Galerie | Ikira, Lieke | Yes |
| Design posters | Lieke | Yes |
| Study on coughing movement | Davide | No |
| Read/investigate similar systems and describe on wiki | Davide | Yes |
| Matlab simulation for throughput of system | Ikira | Yes |
| Netlogo simulation for effect on people flow | Wout | Yes |
| Research legal side of health checks at entrance | Wout | Yes |
Week 4
| Task | Person | Completed |
|---|---|---|
| Checkpoint description and sensors placement and type of microphone | Davide | |
| Perform cost-benefit analysis and describe on wiki | Lieke | |
| Describe psychological effect of visible detection system | Lieke | Yes |
| Write pseudocode for notifying medical staff of person with symptoms | Ikira | Yes |
| Design posters | Lieke | Yes |
| Discuss required software functionalities | Everyone | Yes |
| Write pseudocode for detection system | Ikira | Yes |
| Matlab simulation for throughput of system | Ikira | Yes |
| Netlogo simulation for effect on people flow | Wout | Yes |
| Make sketches of detection system | Wout | Yes |
| Make sketches of measurement station | Wout | Yes |
| Add results from questionnaire to wiki | Ikira | Yes |
| Questionnaire for mall- and shop owners at Heuvel Galerie | Lieke | Yes |
| Discuss and finalize sketches | Everyone, Wout | Yes |
| Make CAD design of detection system | Wout | Yes |
| Make CAD design of measurement station | Wout | Yes |
Week 5
| Task | Person | Completed |
|---|---|---|
| Perform cost-benefit analysis and describe on wiki | Lieke | |
| Write pseudocode for measurement station | Ikira | Yes |
| Evaluate effectiveness of system via simulations | Wout, Ikira | |
| Make CAD design for Heuvel Galerie entrance | Wout | Yes |
| Finalize CAD designs (adjustments, coloring, rendering etc.) | Wout | Yes |
| Statistical analysis on questionnaire data | Lieke | |
| Count number of visitors at Heuvel Galerie | Everyone | Yes |
| Interview people at villages | Lieke | |
| Research concrete numbers for RPC's and simulations | Everyone | Yes |
| Put pseudocodes on wiki with description | Ikira | Yes |
Week 6
| Task | Person | Completed |
|---|---|---|
| Describe CAD designs on wiki | Wout | Yes |
| Discuss what should be in video | Everyone | |
| Make a script for video | Lieke | |
| Make slides and visuals for video | Lieke | |
| Write conclusion | Davide | |
| Write discussion | Ikira | |
| Write recommendation | Wout | Yes |
| Final design evaluation questionnaire | Lieke, Wout | |
| Evaluate effectiveness of system via simulations | Wout, Ikira | |
| Describe testing procedure and tasks of personnel | Ikira | Yes |
| Calculate coughing chance | Wout | Yes |
Week 7
| Task | Person | Completed |
|---|---|---|
| Record video | Lieke | |
| Make a comic showing system operation | Everyone |
Week 8
| Task | Person | Completed |
|---|---|---|
| Describe peer review | Ikira | |
| Finalize layout of wiki (title size etc.) | Everyone | |
| Final check: spelling, citation style etc. | Everyone | |
| Check wiki completeness (titel, introduction etc.) | Everyone | |
| Hand everything in | Everyone |
Users
In this section the use case for the detection system will be given and the users and their needs are identified.
Use case: Heuvel Galerie
In the projected use case for the COVID-19 symptom detection system, the system is deployed at the Heuvel Galerie (official new name: Heuvel Eindhoven). The Heuvel Galerie is a big indoor shoppingcenter located in the center of Eindhoven.
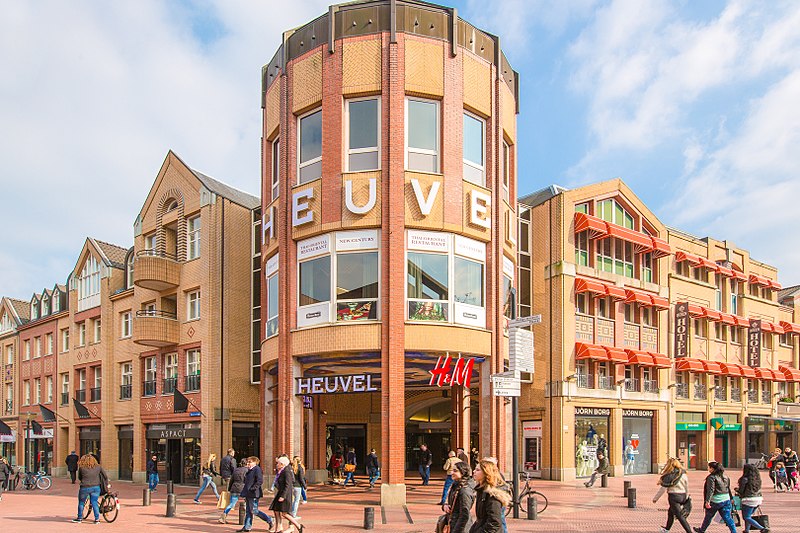
The Heuvel Galerie has three floors, four entrances and it's own underground parking facility. The Heuvel Galerie is a big shoppingcenter: it has over 80 stores and houses the Muziekgebouw Eindhoven and a Holland Casino. Because it houses many stores and facilities, it draws a significant number of visitors. In 2001 the Heuvel Galerie got an average of 200.000 weekly visitors [3]. Because of the corona situation, the shoppingcenter has taken measurements like putting up hand-disinfection stations and creating walking routes. This enables the shoppingcenter to remain open and draw visitors. The following table (in Dutch) shows a recent (as of 7-9-2020) timetable with the relative amount of visitors. It can be seen that despite the COVID-19 situation, there are still time-slots in the weekend which can be defined as 'busy'.

Due to the high amount of visitors, and the fact that the Heuvel Galerie is a closed, indoor facility with clearly defined entrances it could be a potential safety hazard. On busy days these entrances can become choke points and the hallways can become crowded.
The Heuvel Galerie could benefit from a system of the type which is developed in this project. Due to the five entrances (four street-level entrances and the parking lot entrance), the flow of people entering and leaving can be precisely monitored. The COVID-19 symptom detection system will be placed at all entrances. This way, the entire flow of people entering the Heuvel Galerie will be checked for COVID-19 symptoms. If a person is identified with possible COVID-19 symptoms, they can for example be asked to not acces the Heuvel Galerie and do a real test at a GGD testing location or be denied acces completely. The exact steps taken will be discussed further on in this wiki. This will create a more safe and pleasant shopping experience for the shoppers and a more safe working environment for the owners and personnel of the shops and restaurants.
Who are the users
User
The users of the system are the people going in to the Heuvel Galerie, the medical staff that check for COVID-19 symptoms, the shop employees and the law enforcement.
The people going in to the Heuvel Galerie will be checked to see if they are coughing, if they are not, then there is no problem. However if they are coughing they could then be picked out by the medical staff and get a closer checkup. When the people are checked and it is seen that they do not have COVID-19 they would be allowed to enter. If they however do test positive, the law enforcement could keep these people out and with this prevent them from spreading the virus inside. For the shop-employees this is also very important since they come into contact with a lot of people. So having people screened at the entrance will lower the chance of them becoming sick and then also spreading it further.
Society
The main stakeholders for the society would be the government, the uninfected and infected people going into the Heuvel Galerie and the shop employees.
The local government is a stakeholder since they could spend money to place the device and are responsible for the local regulations around COVID-19.
The infected people are a stakeholder since they can be informed about having COVID-19, which could change their behavior and limit the spread of COVID-19.
The uninfected people are a stakeholder since when there is a detection device for COVID-19, it is expected that less people inside will be walking around infected with COVID-19, which results in a lower spread. For this reason the shop employees are also a stakeholder here, their working environment becomes a lot safer.
Enterprise
Since the system should be developed, another stakeholder would be the companies developing the product. The shops are also effected by placing the device at the entrance of the Heuvel Galerie, since this might prevent potential customers from being able to enter. On the other hand, this policy could also create potential customers for the shop since people might feel more safe shopping there compared to other places. The owner of the Heuvel Galerie is also a stakeholder since for them it is important to keep the shops happy so they will continue to pay their fees to the owner of the Heuvel Galerie.
Questionnaire
An initial questionnaire was conducted among shoppers and shop owners at the Heuvel Galerie to identify the requirements of these two user groups. Here the results of the questionnaire will be discussed. Some results of this questionnaire will be incorporated in the design of the system. Both the shopper and shop owners got a different list of questions.
Questionnaire among shop owners
The questions for the shops in the Heuvelgalerie were asked in Dutch, and sent in a mail to seventeen shops in the Heuvelgalerie, and the company that owns the Heuvelgalerie. After a short general explanation of the system the following questions were asked:
1. In het geval van een detector die symptomen in een groep detecteert, waardoor mensen door kunnen lopen zonder fysieke hinder van het systeem te ondervinden, hoeveel impact verwacht u dat dit systeem heeft op het aantal shoppers in de Heuvelgalerie?
2. In het geval van een detector die personen individueel controleert, hoeveel impact verwacht u dat dit systeem heeft op het aantal shoppers in de Heuvelgalerie?
3. Zouden u en/of uw personeel zich veiliger voelen in het geval van de aanwezigheid van een dergelijk systeem? (Ja/ nee)
4. Hoeveel inbreuk zou dit systeem volgens u inbreuk maken op uw privacy?
5. Stel dat een dergelijk systeem geïnstalleerd zou worden, wat zouden vereisten zijn die u graag zou willen zien?
Within a week of sending the e-mails not a single response was returned. Because of this the questions were asked in person at the Heuvelgalerie a week later. Five people who work in different shops in the Heuvelgalerie were interviewed.
Interview 1:
No impact on the number of shoppers in the Heuvelgalerie is expected if the system is a mass detection system, if people are checked individually probably less people will come because they see it as too much of a hassle. They would feel safer if a detection system would be in place, because especially if it is busy people don't really keep their distance, and they are not really careful, especially because their target group is relatively young. If the system does not ask for personal information they would not feel like it invades their privacy a lot. They don't have other specific requirements for the system.
Interview 2:
If the system is a mass detection system the number of shoppers will probably increase, because older people would feel safer going shopping. If people are being checked individually though the threshold for going shopping will be higher because people might have to wait, and when adding that to the probable increase of older people, the overall number of shoppers will probably stay approximately the same. They would feel a bit safer if such a system were in place, and they would feel that their privacy was invaded. The most important requirements for such a system are reliablity and safety.
Interview 3:
If the system is a mass detection system the number of shoppers will probably increase, but if it is an individual detection system it is a bit debatable. According to them, statistics of their shop show that people are more likely to shop in shops in small villages compared to cities right now and in their experience this happens because at-risk people don't go to the city anymore because of a higher risk of infection. A detection system being in place might decrease the perceived risk of going to the city. On the other hand, people also don't want to wait in a queue before entering a shopping mall. They would feel safer with such a detection system being in place, and would not feel like their privacy is invaded. An important requirement for them is discretion of the system, if a person is called out by the system, things should happen quitely, don't let sirens go of or something like that.
Interview 4:
If the system is a mass detection system the number of people will probably decrease, and if it is an individual detection system it will probably decrease even more. They would not particularly feel safer with a detection system in place, and would not feel like their privacy is invaded. Requirements for them would be that the system stays humane, people have to be really well informed, people do not read or listen well, which makes it even more important that they know of the presence and consequences of the detection system. If this is not done well it might even result in safety issues for the medical personnel if people react aggressively when they are picked out by the detection system.
Interview 5:
If the system is a mass detection system the number of shoppers would probably stay approximately the same, because some people who think it is too busy right now might come because they feel it is safer, although some people might stay away because they do not like it. If the system is an individual detection system, people would probably feel more secure in the Heuvelgalerie, but more people would stay away because they feel the testing is too much of a hassle. They would feel more secure with a system in place, and would not feel like it invades their privacy. No specific requirements were given.
It seems that shopkeepers generally are quite positive about the COVID-detection system. According to them the system can have both a negative and a positive impact on the number of shoppers, depending very highly on target audience and awareness. To the shopkeepers it is important that the system is reliable, discrete, safe, humane, and that people are very aware of its presence.
Questionnaire among shopping people
The interviews with people shopping in the Heuvelgalerie were done in a different manner, 30 people in total were interviewed. Fifteen people were interviewed for the detection option with individual screening, and the other 15 people were interviewed for the detection option with mass screening. Both interviews were available in Dutch and English, and the questions were asked vocally and the answers were written down by the interviewers because of safety concerns regarding COVID-19. It was deemed unsafe to hand out a questionnaire on paper or phone in person. A possible result of this might have been that questions have been phrased a bit differently, especially with people asking additional questions, even though special mind was payed to prevent this as much as posible by reading out the questions from paper.
The first type of interview has the following intro:
Het apparaat detecteert of iemand symptomen van COVID-19 vertoont, dit wordt gedaan door individueel naar het apparaat te gaan. Dit kan er voor zorgen dat er rijen ontstaan om naar binnen te kunnen tijdens drukke periodes, het hoeft echter minder gegevens te verzamelen dan een massa detectie systeem. Als de persoon symptomen vertoont worden ze gevraagd om naar een apart meetstation te gaan voor verdere metingen. Als de resultaten positief blijven kan hij/zij worden verzocht om de Heuvel Galerie niet te betreden om de verspreiding van corona te voorkomen.
(The device detects if someone has any symptoms of COVID-19, this is done by individually going to the device. This could cause rows to be formed to enter during bussy times, however needs less data collection to work than a mass detection system. If the person displays any symptoms they will be requested to go to a measurement room for further measurements. If the measurement remains positive, he/she can be requested to not enter the Heuvel Galerie to prevent the spread of corona.)
And the second type of interview has the following intro:
Het apparaat detecteert of iemand symptomen van COVID-19 vertoont, dit wordt gedaan door een massa detectie systeem. Dit zorgt er voor dat er geen rijen ontstaan om de Heuvel Galerie in te komen, er is wel meer detectie apperatuur nodig om dit werkende te krijgen. Als de persoon symptomen vertoont worden ze gevraagd om naar een apart meetstation te gaan voor verdere metingen dan als de metingen individueel gedaan zouden worden. Als de resultaten positief blijven kan hij/zij worden verzocht om de Heuvel Galerie niet the betreden om de verspreiding van corona te voorkomen.
(The device detects if someone has any symptoms of COVID-19, this is by a mass detection system. This ensures that there are no queues to enter the Heuvel Galerie, However compared to individual checks more detection tools are necessary. If the person displays any symptoms they will be requested to go to a measurement room for further measurements. If the measurement remains positive, he/she can be requested to not enter the Heuvel Galerie to prevent the spread of corona.)
The questions were similar for both groups:
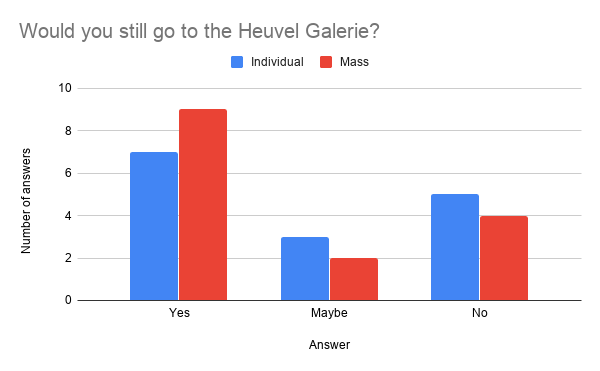
1. Zou u in de Heuvel Galerie gaan winkelen als het detectie apparaat er staat? (Would you go shopping in the Heuvel Galerie if the detection device is there?) (yes/maybe/no)
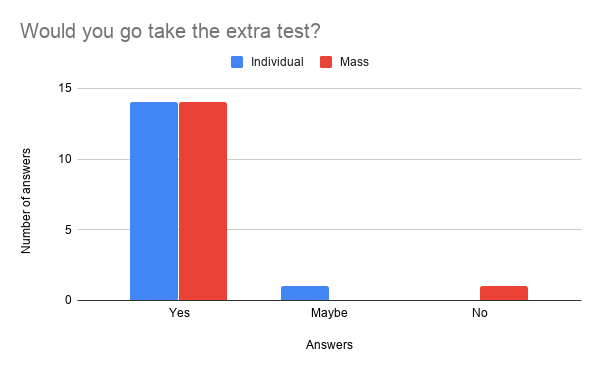
2. Nadat het detectie apparaat u heeft uitgekozen, zou u accepteren om naar het meetstation te gaan voor een hoest en temperatuur test? (After being picked out by the detection device, would you accept being taken to the measurement station for a temperature and cough test?) (yes/maybe/no)
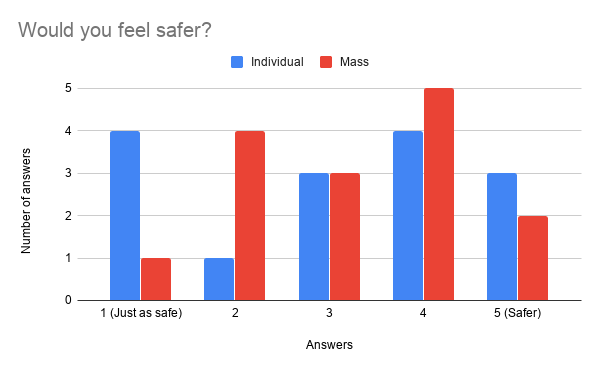
3. Zou u zich veiliger voelen als dit detectie apparaat er zou staan? (Would you feel safer shopping in the Heuvel Galerie with this detection system in place?) (on a scale of 1 to 5, where 1 means no, and 5 means much safer)
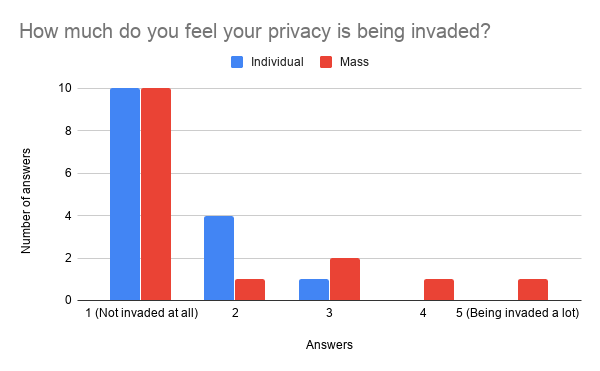
4. Hoe erg vind u dat dit systeem inbreuk op uw privacy maakt? (How much do you feel this system invades your privacy?) (on a scale of 1 to 5 where 1 means not at all, and 5 means very much)
An overview of the answers can be seen in the following figures:
From the answers of question 1 it can be seen that people would like to enter smoothly.
From the answers of question 2 it can be seen that most people do want to be certain about having COVID-19 if they were to be picked out by the system.
From the answers of question 3 it can be seen that people might feel safer with the mass detection system compared to the individual system, this is however not conclusive due to the low amount of answers.
From the answers of question 4 it can be seen that most people do not care much about the privacy issues around the device.
After the first questionnaire two additional questionnaires were planned, however, due to circumstances around COVID-19 being stricter in October 2020 again, it was deemed unsafe to do this on the street, and a decision has to be made on a further course of action. The proces and results of the final questionnaire are described in Evaluation questionnaire.
Performing a Chi-squared test on the effect of an individual or mass detection system on the other variables yielded no significant results for any of the variables. This could be because of several reasons. The first option is that there is no significant effect. Another option is that there is a false negative, and yet another option is that the testing was not accurate. This could be due to the amount of participants in the questionnaire, people not fully understanding the situation and the questions, wrong questions being asked and a non-representative target group. In order to make the outcome of a follow-up questionnaire more accurate the following actions should be taken:
- A bigger sample size is needed in order to be more accurate in analyzing the data.
- The questionnaire should clearly explain the system and how it works in full, before asking questions.
- Questions should be repeated in a different fashion in order to make sure the participants understand the question.
- A very thorough analysis should be done on the way questions are asked and what order they are in.
- The sample group of participants should be representative by including people who do not visit the Heuvelgalerie anymore because of safety concerns.
In practice, taking this complete list in regard proves to be quite tough, because it is very hard to incentivize people to be a participant in a study by students, especially when they do not gain anything from it and the questionnaire is long. This means that a consideration should be made in order to decide what points are more important, having a bigger sample size, a more representative sample size, or clearer questions and answers. It is only possible to optimize all of them if there are sufficient resources like time and money.
What are the users needs
Here the needs of the above identified users regarding the COVID-19 symptom detection system will be given. These requirements are partly based on the above mentioned questionnaire conducted among shoppers and shop owners at the Heuvel Galerie.
User
People entering Heuvel Galerie
The requirements for uninfected shoppers are:
- Hindrance: Shoppers come to the Heuvel Galerie to have a fun day. The system should not cause excessive hindrance.
- Proper detection: Proper detection ensures possible COVID-19 carriers are identified so that others may shop in safety.
- Privacy: The system must comply with all privacy regulations. From the questionnaire it followed that people prefer a crowd scanning system over a system in which they have to stand in a queue.
The requirements for infected shoppers are:
- Proper detection: The system should minimize the number of false positives and false negatives. People with good intentions that are unaware they carry the virus should be notified.
- Privacy: The system must be discrete since it can be embarrassing for people to be picked out for a COVID-19 test and it can cause unnecessary panic at the location. The privacy of the people being tested should be guaranteed such that for example bystanders cannot obtain the identity of the person being tested. Therefore, people have indicated to prefer a crowd scanning system over a queueing system.
Shop owners and employees
The requirements for the shop owners and employees are:
- Proper detection: Shop personnel will come into contact with a lot of different people while doing their work. Proper detection will benefit the safety of the personnel, for which the shop owner is responsible.
- Discretion: The system should be not too obvious when picking people out to ensure people do not become embarrassed.
- Information: The presence of the system should be clearly communicated to everyone in and surrounding the Heuvelgalerie.
Medical staff
The requirements for the medical staff are:
- Ease of use: The system must be easy to use for the medical personnel. No special extra training should be required, a user manual should provide enough information to operate the system.
- Safe to use: While operating the system and working with people that possibly carry the virus, the medical personnel should not be exposed to too much risk of catching the virus themselves.
- Autonomous: The system should be able to detect coughing people autonomously, because the medical staff can then fully focus on their own tasks.
Law enforcement
The requirements for the law enforcement are:
- Proper detection: A proper detection ensures a safer work environment for the security guards of the Heuvel Galerie.
- Hindrance: The system should not be cause of any dangerous- or other unwanted situations requiring the security guard’s attention and thus creating more work for them.
Society
Local government
The requirements for the local government are:
- Increasing attractiveness: The system should create a safe shopping environment, making it more attractive for people from outside Eindhoven to go to Eindhoven and shop at the Heuvel Galerie, and possibly other stores/restaurants in the city.
People entering Heuvel Galerie
The requirements for the people entering the Heuvel Galerie as seen from a society standpoint are the same as seen from a user standpoint, except that when seen from the society standpoint, the requirement of proper detection becomes extra important because this will create safer shopping environments in general and could help reduce the overall number of infected people.
Shop owners and employees
The requirements for shop owners and employees as seen from a society standpoint are the same as seen from a user standpoint, except now again the proper detection requirement is extra important because this can lead to a healthier population in general resulting in more potential customers.
Enterprise
Shop owners
The requirement for shop owners from an enterprise standpoint are:
- Hindrance: The system should not cause excessive hindrance, resulting in less potential customers visiting the Heuvel Galerie. From the questionnaire it followed that shop owners prefer a discrete system, since a system with for example a siren or alarm might scare customers away.
- Increasing attractiveness: The system should make it more attractive to visit the location compared to the situation in which the system was not in place or compared to other shopping locations in Eindhoven were no such system is installed. From the questionnaire it followed that shop owners think a mass detection system (no queue) is the most attractive for the customers.
- Visibility: From the questionnaire, it followed that shop owners would like that shoppers are explicitly made aware of the presence of such a system, since not many people listen or read well. This is to prevent unwanted situations in which people might for example become aggressive when they are approached by medical personnel.
Company developing the product
The requirements for the company developing the product are:
- Attractive product: The product has to be attractively priced in order to sell more units and make a profit. Therefore, it should not be too expensive to manufacture. It also needs to have decent looks to make it marketable.
- Comply with regulations: The manufacturer does not want to get into trouble for selling this product. It must comply with all regulations.
Owners of Heuvel Galerie
The requirements for the owners of the Heuvel Galerie are:
- Cost: The system should not be too costly to purchase and to operate.
- Comply with regulations: The owners of the Heuvel Galerie will be the party operating the system via their employees. Therefore it is important that the system complies with all regulations such that the owners do not get into legal trouble.
As can be seen, for multiple stakeholders it is important that the product complies with regulations (health, privacy etc.) and that the system properly detects people with COVID-19 symptoms. This is one of the most important requirements.
The above-mentioned user requirements will be converted to more concrete requirements for the design of the system in the RPC's.
State of the art
Here, the State of the Art is given: State of the Art.[5][6][7][8][9][10][11][12][13][14][15][16][17][18][19][20][21][22][23][24][25][26][27][28] [29][30][31][32] It is divided into several topics. Each topic starts with a small summary of the State of the Art and after that the summarized articles concerning that topic are given.
Similar systems
Here, an overview of similar COVID-19 (or other disease) symptom detection systems are given.
Cough detection Camera
The Center for Noise Control at Korea Advanced Institute of Science and Technology (KAIST) developed a cough detection camera.[46] The cough detection camera can detect a cough and visualize its location on video. This system uses a deep-learning recognition model combined with an acoustic camera. The system operation can be understood by the flowchart shown in Figure XXX. The microphones record a sound sample of some length. The location and direction of the sound sample is computed, and it is then mapped on the image of the camera feed. Concurrently, the sound sample is classified as a cough or something else. If the sample is classified as cough the cough location is displayed. If not, the next sample is analysed. Also, when a cough is detected, the location of the cough is visualized on a display, the source is tracked, and a counter records the number of coughs.
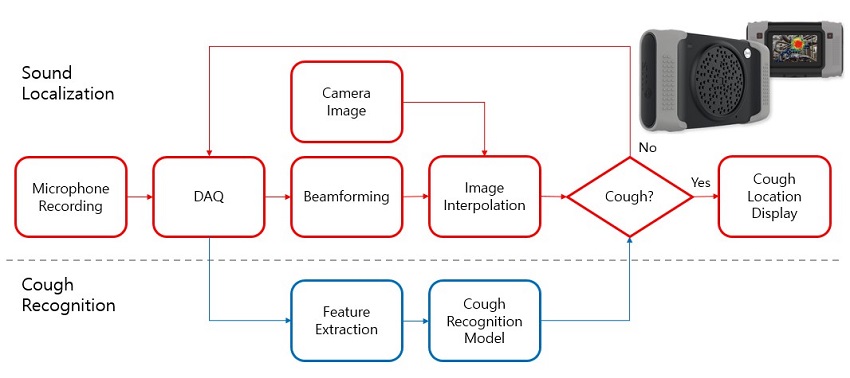
The system is composed of two parts the cough recognition model and the acoustic camera. The deep learning recognition model is a convolutional neural network. The model uses binary classification. The output is the event of a cough or not. To train the model four datasets were used. The Audioset dataset used for extracting the cough sounds. While DEMAND, ETSI, and TIMIT were used as background noise. The tested feature recognition algorithms used to train the model were spectrogram, Mel-scaled spectrogram, Contrast-Q Transform, Chromagram and Mel-frequency cepstrum coefficients with seven optimizers. The resulting best feature recognition algorithm was the Mel-scaled spectrogram which achieved an accuracy of 87.4%.
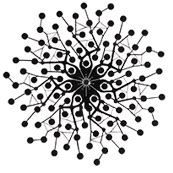
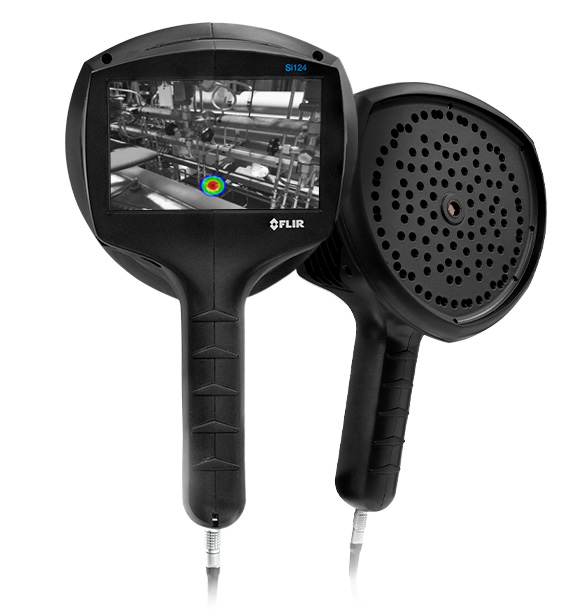
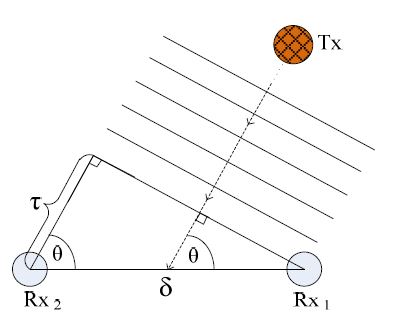
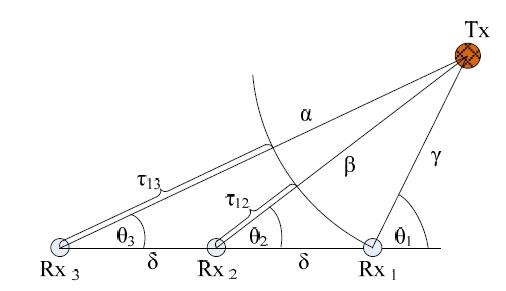
The acoustic camera is the Batcam 2.0 from SM Instruments. The Batcam 2.0 is an industrial tool often used to detect leaks and vibrations. The acoustic camera is made from a microphone array, a visual camera, and a processing hardware which maps the incoming sound on the camera image feed. A microphone array is a set of multiple microphones operated in sync. There are various design options for microphones arrays. The microphones can be placed on a straight line, on a plane or in three dimensional shapes such as a tetrahedron or a cylinder. Also, different types of microphones can be used: omnidirectional, directional or both. Usually in acoustic cameras with beamforming omnidirectional microphones are used. To determine the Direction of Arrival (DoA) and location of a sound source the Time Difference of Arrival (TDOA) of the sound signal is calculated. In Figure XXX the direction of the source is computed only with two microphones. While in Figure XXX at least three microphones are required to calculate the location.[33]
 |
 |
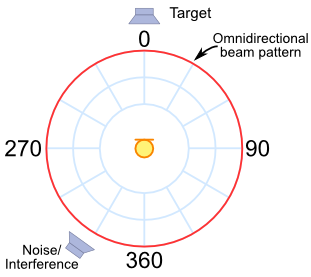
Beamforming is a multichannel signal processing technique. The result of the beamforming technique is spatial filter. Beamforming focuses the detection beam of the array towards a specific direction. Therefore, the radiation pattern of the array is changed. An omnidirectional radiation pattern and a focused beam radiation pattern are shown in Figure XXX and Figure XXX, respectively. A simple beamforming algorithm is the Delay and Sum Beamforming. Delay and Sum Beamforming delays some of the incoming signal, to sync all the signals, and sums them to create a constructive interference. A hardware implementation of the Delay and Sum Beamforming algorithm is shown in Figure XXX. The Yellow dots represent the microphones, the purple boxes are the delays and the summer is represented in green. A beamforming locator focuses the beam towards the direction which produces peak output power. After the source is located it can bee tracked by steering the beam following its movement. Beamforming acts a spatial filter which reduces the negative effects of reverberation.[34]
 |
 |
 |
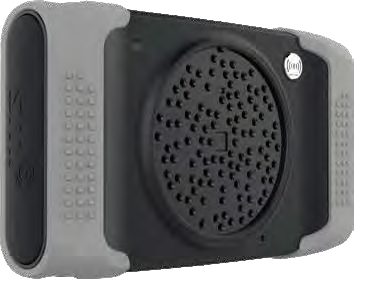
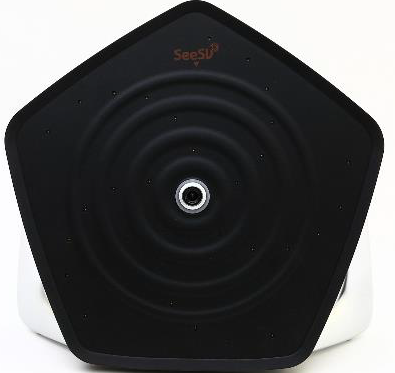
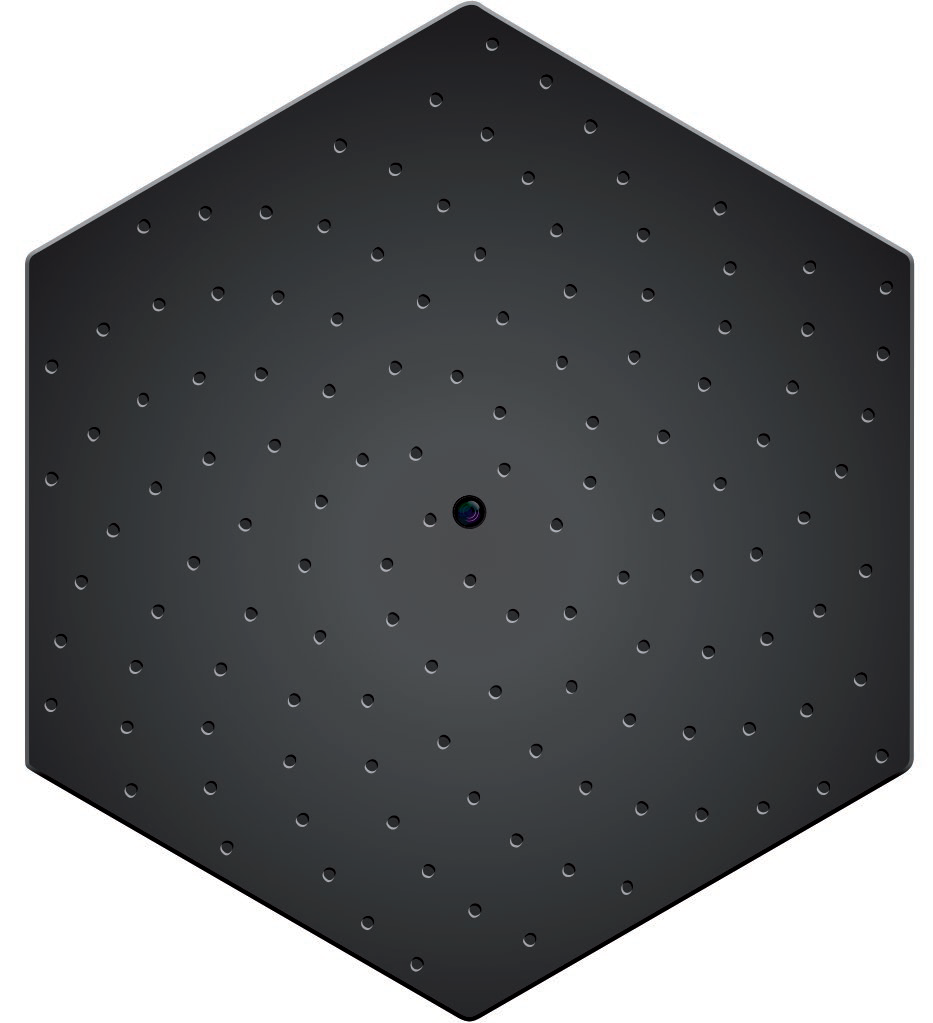
A different acoustic camera could be used instead of the Batcam 2.0 used in the study by KAIST. In Table XXX several alternatives are presented. Most of the presented cameras have a planar microphone array, use omnidirectional and MEMS microphones.
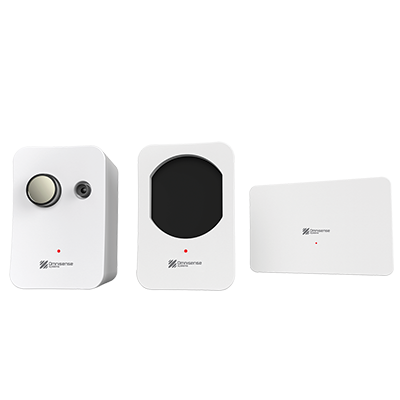
Temperature Screening with Omnisense Sentry MK4
Omnisense Sentry ML4
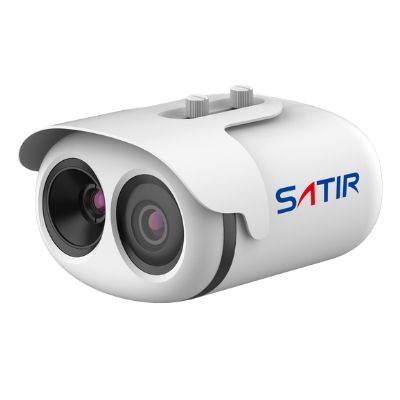
The most important specifications of thermal cameras are explained. A comparison of the most popular temperature screening systems and thermal cameras is shown in table XXX.
- Pixel resolution: Pixel resolution determines the amount of information in the image. Pixel resolution in thermal cameras is very small compared to optical cameras. Since infrared radiation has longer wave lengths, than visible light, the sensor must be larger. Additionally, to have a larger pixel resolution the sensor should be much larger. Which would dramatically increase the size of the camera. Pixel resolution determines the resolution of the image and the accuracy of the temperature measurement. To have a proper measurement the correct pixel resolution must chosen depending on the distance and the dimensions of the measured object. A camera with a higher resolution can be placed at a larger distance.
- Thermal accuracy: Thermal accuracy is the margin of error of each measurement. In average the accuracy of thermal camera is ±2 °C on the whole measurable range. With external calibration tools like a reference heat source (i.e. black body) higher accuracy can be achieved. For high quality measurements the black body should be placed on the same plane as the measured object.
- Thermal sensitivity NETD: Noise Equivalent Temperature Difference (NETD) is the ability of the camera to distinguish differences in thermal radiation. NETD is also called thermal contrast. A camera with smaller NETD has a higher thermal contrast than a camera with a higher NETD.
- Field of view: Field of view is the angle to which the camera is sensible. By fixing the required resolution the distance from the measuring object depends on the field of view. With a larger field of view the object must be placed closer. While with a smaller, more focused, field of view the object can be placed further, without losing any measurement accuracy. The field of view depends on the lens of the camera. Some cameras have interchangeable lenses.
- Scan time: The scan time is the amount of time taken by the system to screen a person. Not all systems have specified their scan time. Scan time is dependent on several factors, the sensor’s time constant to react to temperature change, the system’s processing time and the correct and the system’s screening software. In non-ideal conditions scan time may take more time especially with human errors.
Privacy issues and regulations
Here, a study will be done on the possible privacy issues and legal issues arising from a system as proposed in this project.
Privacy issues
What is privacy?
Before the issues of privacy can be discussed, it is important to know what exactly privacy is.
There are a lot of different definitions for privacy, according to Warren and Brandeis it is “The right to be left alone” [47]. Others define it as a way of information control.[48]. Another description of privacy is “The condition of not having undocumented personal knowledge possessed by others”[49] William Prosser Separates privacy in 4 different categories:
1. Intrusion upon the plaintiff’s seclusion or solitude, or into his private affairs
2. Public disclosure of embarrassing private facts about the plaintiff
3. Publicity which places the plaintiff in a false light in the public eye
4. Appropriation, for the defendant’s advantage, of the plaintiff’s name or likeness [50]
For the case of privacy for the device we are making the first point here is what we take into account when we are talking about privacy.
Constitution
The constitution also states rules about privacy and they way they are processed. These rules are in article 10, 11, 12 and 13 of the constitution[51].
Article 10 states[52]:
- Everyone has the right to privacy for their private life, the government is not allowed to use personal information for no reason and everyone is allowed to view their personal information and is allowed to change them if they are incorrect.
Article 11 states[53]:
- Everybody has the right to decide for themselves what happens to their body. Nobody is allowed to forcefully do medical test to their body. There are exceptions if this is regulated by the law.
Article 12 states[54]:
- Without permission of the resident entering the residence is only allowed with a statutory exception. This law also applies for workspace or public space.
Article 13 states[55]:
- The government is not allowed to read or listen to correspondence between citizens except in cases where the law allows it and by order of the judge.
For the device we are making and the procedure with using it these laws influence it by,
Article 10:
- None of the data that was collected will be saved and after it is used to detect the person the medical staff needs to pick out it will be deleted. Also no personal information is asked during the process. The device is not allowed to be used to collect any personal information.
Article 11:
- The extra tests can not be forced to be done to people if they are initially detected as having a symptom of COVID-19.
Article 12:
- It is allowed to refuse entry if someone is tested positive for COVID-19 or refuses to have further tests for COVID-19.
Article 13:
- This article does not have any effect on the device or procedure being done.
Case corona-app
One of the more known subjects in the news is the privacy issues regarding the corona-app. The app would track if you came into contact with someone who has corona and if you were close enough for a long enough time it would send you a message indicating this.[56] On 19-4-2020 a privacy analysis was done for 7 corona-apps. [57] In this analysis the principles that should be met were:
- The data that is used should not be able to be led back to anyone (anonymity)
- As little as possible false positives(correctness)
- Data can exclusively be shared if either there is contact- or source research or if the user gave his/her consent.
- The use should be aimed at simplifying contact research. (purpose limitation)
- There is an information portal where users can report mistakes and vulnerabilities. (transparency)
- Conventional security standards
- If the app is not effective or necessary any more data must be able to be deleted.(removal)
- Comply with the Algemene verordening gegevensbescherming(AVG)
This analysis however showed that none of these apps meet the requirements stated by the AVG.
A group of privacy advocates wants to have a few firm commitments [58] namely :
- The app is only allowed to have 1 goal
- It must be based on scientific insight and proven effective
- Proven reliable and based on expertise.
- The application of the application is by definition temporary.
- Not traceable to individuals.
- Use as little data as possible.
- Do not store personal data centrally.
- Safe and resistant to abuse.
- User-friendly and accessible.
- Never under pressure from the government and third parties.
Users
A detection system that checks if people potentially have COVID-19 can have a lot of privacy issues. After all, to detect this a lot of sensors are needed. The issue due to privacy violation is the fact that the habit of people can be deduced from the information seen or saved by the detection system. To prevent this steps should be taken in the design to prevent this issue.
According to T. Winkler, et al.[18] a few desirable properties of a secure privacy-preserving camera system would be: Detection of sensitive regions, Blanking, Obfuscation, Encryption, Multiple privacy levels, User consent, User feedback.
These are also points we try to implement in our design as well.
- Detection of sensitive regions: the detection system will only be installed at the entrance of the Heuvel Galerie and aimed at people entering.
- Blanking: When there are visual images involved, the background will be cut out so only the people/person involved will be visible.
- Obfuscation: First an infrared camera will be used. With this it is impossible to identify a person. Only when someone is detected to cough will the other camera be turned on.
- Multiple privacy levels: The system has multiple privacy levels by first only using sound and infrared measurements to detect if some is coughing. Only when it is necessary will the level go up to show who the person was that coughed. Here only the person himself is shown and not his surroundings to prevent any additional information from being seen.
- User consent: A board that shows what the detection system does will be made so that people know that the detection is there and what it is for. If the people do not consent to this type of detection system, they could also go somewhere else.
Questionnaire
From the questionnaire it can be seen that most people do not think this device intrudes their privacy. During the questioning of the people it became clear that most people do not really care about the information that could be collected by it and possibly sent to other parties.
Privacy general
https://www.aeaweb.org/articles?id=10.1257/jel.54.2.442
https://www.researchgate.net/publication/228322650_Privacy_Its_Meaning_and_Value
https://link.springer.com/content/pdf/10.1007/s10676-012-9291-0.pdf
Legality of doing health checks
A question that arises when a COVID-19 symptom check, followed by a possible temperature measurement and cough-test is performed in a public place, is the legality of such a procedure.
In the proposed design, a system will first detect in a crowd of passing people if someone displays symptoms that correspond to COVID-19. If a person displays symptoms, they will be asked by a medical person if they are willing to come to a measurement station where more symptoms can be checked. An example of a symptom that could be checked is fever, indicated by an elevated temperature.
At home, anyone can buy for example an infrared thermometer and measure their temperature. But is this also allowed at the entrance of a privately owned shopping centre? In the Netherlands, the government body responsible for the privacy of people is the Autorieit Persoonsgegevens (AP). One of the laws enforced by the AP is the Algemene Verordering Gegevensbescherming (AVG). This is a law coming from the European Union which safeguards people’s privacy. [35] According to the AP, it is not allowed to measure someone’s temperature if the measurement data is automatically stored or processed in any way, since this is in violation of the AVG. [36] The AVG states that it is not allowed that the measurement results in some sort of automated action, like for example a gate that opens or a light that turns green. The measurement data and the persons identity can not be stored, passed along or processed in any way. If this is followed and the person is asked permission (and is able to decline) then the AVG is not violated and measurements at the entrance of a privately owned shopping centre, like the Heuvel Galerie, are allowed. A similar procedure is already in place nearby at ASML in Veldhoven. At ASML, a temperature measurement is performed on every person who wants to enter a building. If they have a raised temperature, access is denied. [37]
Design
In this section, first, all things taken into account during the design process and the choices made to come to a final design are elaborated. After that the final hardware- and software design are given.
RPC's
Here, the RPC's for the COVID-19 symptom detection system are given. These RPC's are based on the previously mentioned users needs.
Requirements
- Detect coughing people and notify medical staff.
- Perform IR temperature measurement on measurement station.
- Less than 10% false positives. A test with a sensitivity and specificity of 90% is generally considered to be a good test.[38].
- Less than 10% false negatives
Preferences
- Respect privacy as much as possible.
- Easy to use for medical staff.
- Safe to use for medical staff.
- Increase the attractiveness of visiting the Heuvel Galerie.
- The system should be attractive (in terms of looks and pricing).
- No excessive hindrance for shoppers. --> Add number from questionnaire then add to requirements
- Easy to install at location of use.
- Minimize amount of false positives and false negatives.
- System should be as visible as possible to alert people of the presence and consequences of the system.
Constraints
- Comply with health and privacy regulations and laws.
Numbers
Privacy design choices
The detection system proposed in this study requires people to be taken to a measurement station when they have showed symptoms corresponding to COVID-19. The AP (Autoriteit Persoonsgegevens) warns that, when a measurement is used to for example deny someone access, and a line of waiting individuals is able to observe this happening, then this could impact the persons privacy. [36] Measurements need to incorporated into the design to prevent this violation of privacy. The measure we chose was to also let some random people be taken to the measurement station while having a sign state that not only people with symptoms will be picked out, but also random people. This way people will not think strange about a person being taken to the measurement station.
What happens after testing?
After the testing is done, the people who are tested negative can continue in the Heuvel Galerie. For people who are tested positive it gets a bit more complicated.
The Heuvel Galerie is real estate that is a part of the private company CBRE Global Investors, and any measures being taken have to go by them. It is assumed from here on forward that they agree with the measures being suggested.
When people are tested positive, it is recommended that the Heuvel Galerie denies them access. Such a temporary prohibition is legal even if it is only verbally commanded by the owner, on the grounds of the law of "huis- of lokaalvredebreuk". In article 5:1 of the "Burgerlijk Wetboek" it can be found that ownership is the most inclusive right a person can have on a company, which means that the owner decides who can go in and under which conditions. If CBRE Global Investors would write a statement that people who have been tested positive in the testconditions specified in this study are to be denied access, they have no legal right to enter the building.
By denying positively tested people acces, the Heuvel Galerie can create a safer shopping environment.
Disinfection
Every time a person has done a personal test for COVID-19, the system has to be thoroughly disinfected before further use. Luckily, it appears that COVID-19 is highly sensitive towards ultraviolet radiation[39]. In this type of environment it is possible to use a pulsed-xenon ultraviolet room disinfection device[40].
A robot has been developed to clean hospital rooms this way autonomously, and it needs about 1 or 2 minutes per position to completely disinfect the room[21]. If a UV light is used to disinfect the room the cough-test was taken in, it will probably take no more than the 2 minutes, because the area is much smaller than the average hospital room.
Psychological effects
In order to decrease COVID-19 spread it is very important that people are careful themselves. At the time of writing the article in September 2020, the COVID-19 pandemic has been in the Netherlands for about half a year. In the period of June 17th to June 30th, Eindhoven had 9 infected people according to the RIVM[41], and since then the number started exponentialy increasing to 117 infections in the period form August 26th to September 8th. Because the number of infections in Eindhoven and its regions has been relatively low for some time, the perceived risk of COVID-19 has gone down a lot. This results in people being less careful. In order to make people more aware and careful, visibility is very important. Visibility can be manifested in different ways. People you know being infected is an example of visibility. Other, more preferable examples are medi and visible coronameasures. A visible system of coronadetection of course falls under the last category. Several steps can be taken to manipulate people in being more careful by improving the design of the system and the surroundings.
People are different, and this has to be taken into account in the persuasion process. There are, on one hand, high-self-monitoring individuals, who mostly serve a social-adjustive function, and on the other hand low-self-monitoring individuals, who serve a value-expressive function. The high-self-monitoring group is more easily persuaded by messages that focus on facilitating social interaction and enhancing cohesion, and the low-self-monitoring group is more easily persuaded by messages that focus on core values or beliefs.[42] This can be implemented in the design process by making posters for example, where one type of poster is designed to target the high-self-monitoring group, and another type of poster is designed to target the low-self-monitoring group. For the high-self-monitoring group this poster should focus on the social groups the people could be in, and imply that not adhering to the rules lowers your cohesion with the group. For the low-self-monitoring group the focus should lie on complying to the rules because of valueing for example life, health, decency and common sense.
People behave differently when they are self-aware and non-self-aware.[43] If people are self-aware they are more likely to act according to the way they perceive themselves or how they think they should behave, which is mostly better behaviour. The presence of a mirror or an audience can greatly improve self-awareness. [44] In case of the system for symptom detection, self-awareness of surrounding people can be increased by the presence of reflective surfaces such as mirrors and the presence of for example law enforcing people looking around.
If the presence of the detection system is wildly known, this could make people who are ill very self-aware, and they will be discouraged to go to the Heuvelgalerie. This would make the Heuvelgalerie a much safer place to shop. This effect is also confirmed by the questionnaire done at the end of the study.
Detection system options
The different types of detection systems that will be used in the system for COVID-19 symptom detection are thermometers for testing temperature and a camera with microphone for cough detection. The camera will not be used for detecting whether people are within a 1.5 meter range of each other, because it is hard to distinguish between families this way. Another option that will not be implemented is fever screening through thermal imagery, because mass screening for fever requires a resolution that is so high that it does not exist yet. Screening for fever using an IR handheld thermometer could be possible, but only in a controlled environment, and it is not sensitive enough.
Cough Detection
Termography
Cough Recognition
Checkpoint description
Design Layout
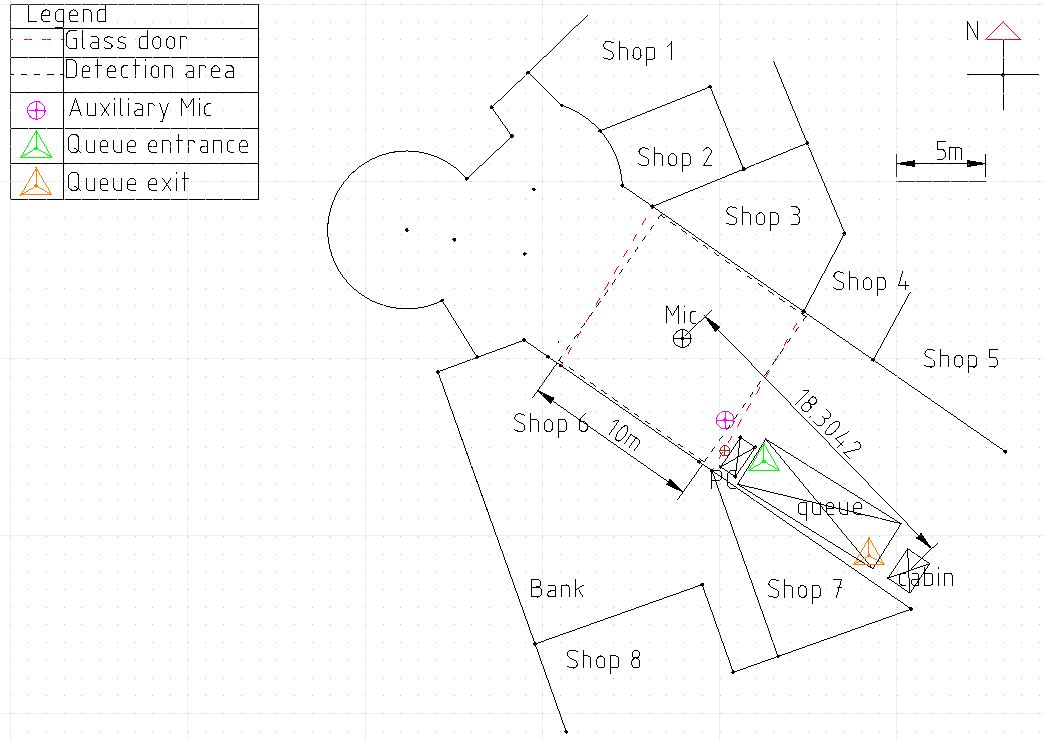
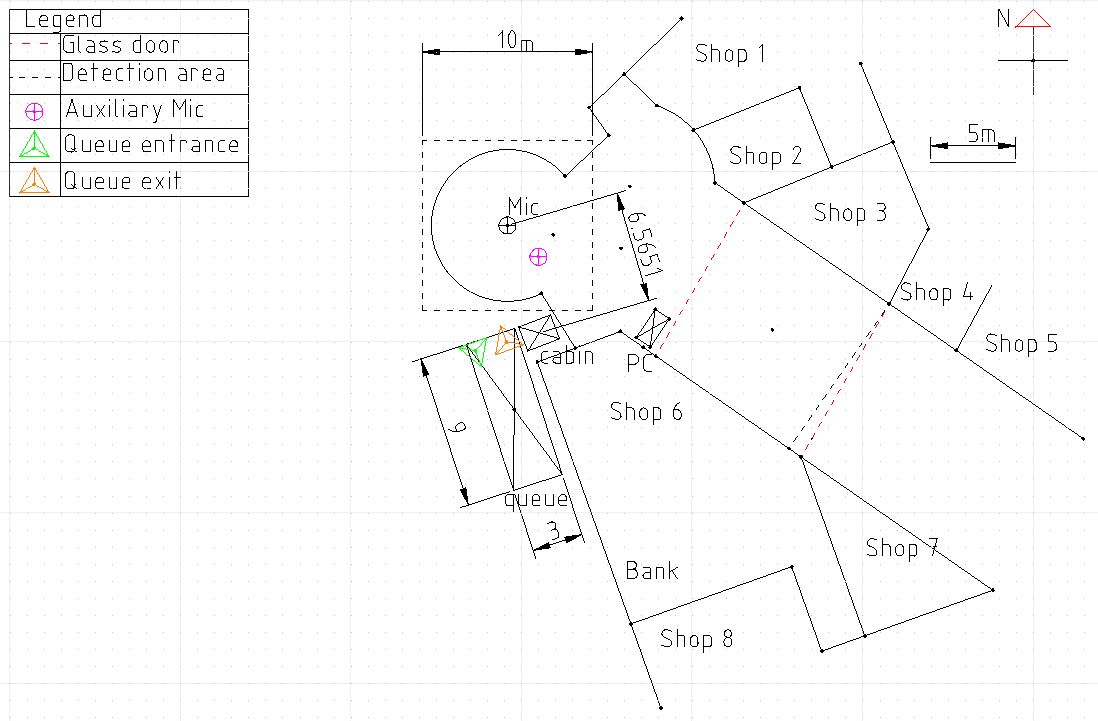
Two design layouts for the main entrance of the Heuvel Galerie were made. The Design 1 places all infrastructure in the interior of the Heuvel Galerie. While the Design 2 places all the infrastructure outside the main entrance.
The main entrance of the Heuvel Galerie can be divided in two parts: the outdoor circular hall and the indoor entrance hall. The outdoor hall is a circular structure with a ceiling supported by columns around its perimeter. From this hall it is possible to access two shops (shop 1 and 2) and the Heuvel Galerie. The indoor hall is a squared area delimited by two glass sliding doors (marked in red) and two shops (Shops 3 and 6). After the second glass door the rest of the Heuvel Galerie is accessible.
Design 1: Inside
The first design is shown in Fig. XXX. All three elements are placed indoors.
Acoustic Camera pole
The acoustic camera pole is placed at the centre of the indoors squared hall. Placing the pole at the centre of the room does hinder the flow of people. The central pole location was chosen since the microphone’s position was fixed facing straight downwards. If the microphone is mounted at an angle the pole could be moved from the centre. The auxiliary preferred location is the southern corner. Placing the pole in a corner has some advantages. The pole would be closer to the people entering the shopping centre. It might facilitate measurement since it would be directly pointed facing people entering. Also, it is the most visible position for people who are entering.
Measurement cabin and queue
The measurement cabin is placed further inside the Heuvel Galerie, after the second glass door. The distance between the pole and the cabin is roughly 17 metres. The start of the queuing lane is just behind the second glass door. The exit of the queue is in front of the cabin. The queue circuit is a squared serpentine. The queuing lane is 3 metres wide and 9 metres long. Around 1 metre is left between the end of the queue and the entrance of the cabin. This is done to let people enter and exit the cabin easily. Both the queue and the cabin are placed on the lane of people entering the shopping centre. The lane was selected to not mix people entering with people exiting. Mixing entering and exiting people would create too much traffic and confusion, both for the shoppers and the staff operating the system.
Placing the queue and the cabin on the entering lane (right side) does hinder movement for people entering. Unfortunately, this layout also hinders the nearby shops. In this case shop 7 is completely obstructed by the queue and the cabin.
Placing the queue inside the shopping centre might create security issues. Placing a queue will eventually create a crowd. And a crowd in a confined indoor space is a security issue, especially in modern times. First, the queue is very close to an exit and in case of an emergency the exit might be temporarily bottlenecked. Secondly social distancing must be applied within the queue. Stickers should be placed on the floor to help distancing.
To solve some of the stated issues both the queue and the cabin could be placed outside while keeping the detection system inside. But this solution is not viable since too much traffic would be created inside the measurement area. Since detected people would be stopped at the second door and invited to walk back towards the second station, forcing them to walk two times in the measurement area.
Design 2: Outside
The second design can be seen in Fig. XXX. All three elements are placed before the first glass door entrance. Both the acoustic camera pole and the measurement cabin are placed in the outdoors, but both are protected by a roof. While the queue is placed outside along the external walls of the Heuvel Galerie.
Acoustic Camera Pole
The acoustic camera pole is placed in the middle of the outdoor circular hall. Placing the pole at the middle does increase hindrance. But at the centre the pole is very visible for people both entering and exciting the shopping centre. Except when looking from outside at certain angles where the supporting columns hide the centre of the hall. Again, the pole is placed in the middle of the hall because of the mounting angle of the microphone.
By mounting the microphone array at an angle, the pole can be placed away from the centre. The auxiliary preferred location is shown in magenta circle. The pole would be placed in front of the south-eastern supporting column. The eastern columns are those closer to the entrance. And the southern column is the one closer to the lane of people entering. Therefore, a person entering the outdoor hall would easily see the pole in front of the column. In this location the pole is an obstacle easier to avoid since it is placed in front of a column. But visibility is reduced because the pole is covered by one side. Since the pole is covered on one side a person coming from the covered side might bump into it.
Cabin and queue
The measurement cabin is placed on the south eastern corner of the outdoors circular hall, near shop 6. The cabin is in the outdoors, but that position is protected by a glass roof. The cabin does hinder movement, but deliberately. The cabin blocks lateral access from outside the outdoor hall, but only one side. By blocking lateral access to the main entrance people are forced to walk in the outdoor hall and in the detection area. The other lateral access, northern, should also be blocked.
The queue is placed completely outside and parallel to the vitrine of shop 6. The dimensions of the que are the same as in Design 1, 9 by 3 metres. The queue circuit is ‘U’ shaped. Both starting and ending point of the queue are close to the cabin. Again, 1 metre is left between the exit of the queue and the cabin to ease accessibility. The distance between the pole and the cabin is roughly 6.5 metres.
By placing the queue outside of the Heuvel Galerie the security risk is decreased. The crowd formed by the queue can disperse more easily than Design 1. Furthermore, the risk of COVID-19 transmission within the queue is reduced. Still social distancing must be applied. Stickers should be placed of the ground to help distancing.
But some issues arise. The queue is placed in front of the vitrine of Shop 6. The owner of Shop 6 might not agree with the placement of the queue since the vitrine might be hid by people queuing. Since the queue is placed on the pedestrian street a permit from the local government might be required. Also, the measurement cabin might require a permit since it is placed outside. Even though it is not clear if that area belongs to the Heuvel Galerie.
Final hardware design
Here the physical design of the system will be discussed. Design choices will be explained and renders of the design are shown. Also, the components chosen for the system will be explained.
Components
Detection System
Microphone array: The microphone array chosen for the final design was the Listener64 from Sorama. The decision was made based on the specifications of various similar systems reported on Table XXX. The Bionic M-112 Array with the Acoustic Camera from Norsonic were discarded because of there size, with a diameter of 1 metre and 48 centimetres, respectively. The SeeSV-S205 was discarded because of a lack in number of microphones in the array, which causes decrease in spatial filtering performance. The remaining cameras have all acceptable dimensions and weights. The number of microphones in are decent, with both the Cam64 and Listener64 from Sorama having 64 microphones. The safe option would be to choose the same camera from cough detection camera REFXXX the Batcam 2.0. But because of the high price of both the Batcam 2.0 and the Flir 124 (above €15k) the Sorama cameras were preferred. Then between the last two cameras the Listener64 was chosen. Because of its lower price and outdoors proof design. A visual camera is bought separately. But ideally the Listener64 could be paired with already existing security cameras.
Visual Camera:
The main requirement needed to select the camera is the Field of View. The camera must be able to film the entire detection area measured by the Listener64. By knowing the dimensions of the detection area, the necessary Field of View can be calculated. The camera will be positioned on the top of the pole at 3.2 metres from the ground, facing downwards. The furthest peripherical point is at five meters. With simple trigonometry both the vertical and the horizontal field of view are of 114°. The only type of camera with such a wide wield of view are cameras with fisheye lens. Fisheye lenses have a field of view of 180° degrees. The best camera found with a fisheye was the 5MP DS-2CD2955FWD from HikVision [59]. The camera has a 2560x1920 (5MP) pixel resolution. Such a high resolution permits recognition of people coughing. The minimum required pixel density for recognising the face of a person is 1.25 pixel/cm [60]. With a vertical resolution of 1920 pixels, a maximum semi circumference of 15.3 metres can be filmed. Given the height of the microphone pole of 3.2metres and its detection radius of 5 metres the maximum semi circumference of detection is 14 metres long. Therefore, a resolution of 5 MP is enough to recognise people coughing.
Measurement Station
Thermal Camera / blackbody: DS-2TD2617B black body
- cheapest combination
- Minimum focusing distance 0.6m OK
- Enough Pixel resolution for accurate reading
Microphone :
- Omnidirectional MEMS or Electret Microphones
Monitors (quantity 2):
- Common desktop monitors
- Size of display?
- Minimum pixel resolution 1024 × 768 (XGA)
UV Light:
PC System requirements
From the free software from HikVision: Operating System:
- Microsoft® Windows Server 2008 R2 and above (32-bit or 64-bit)
- Microsoft® Windows Server 2008 R2 and above (32-bit or 64-bit)
CPU:
- Intel® Core™ i3 Processor and above
Memory:
- 2 GB and above
Network switch with Power Over Ethernet (POE)
Detection system
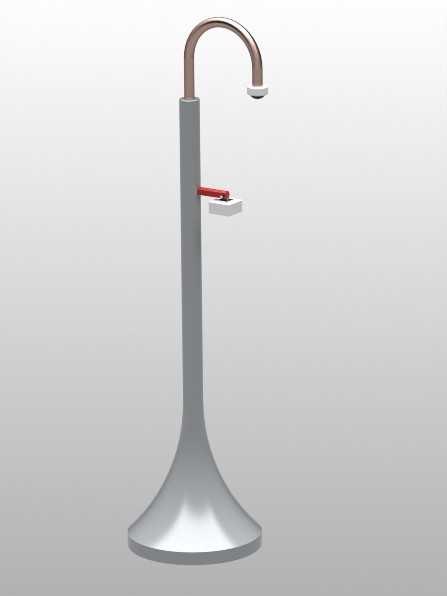
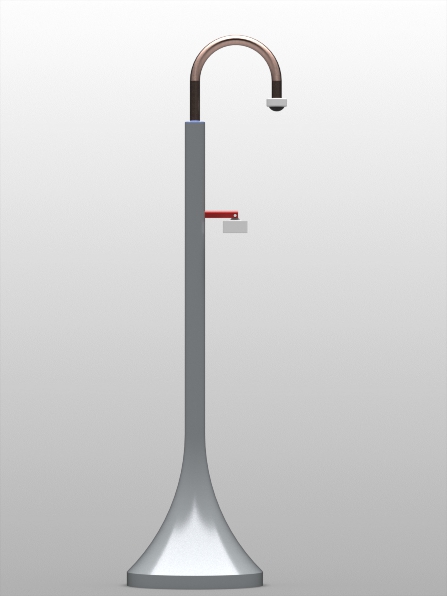
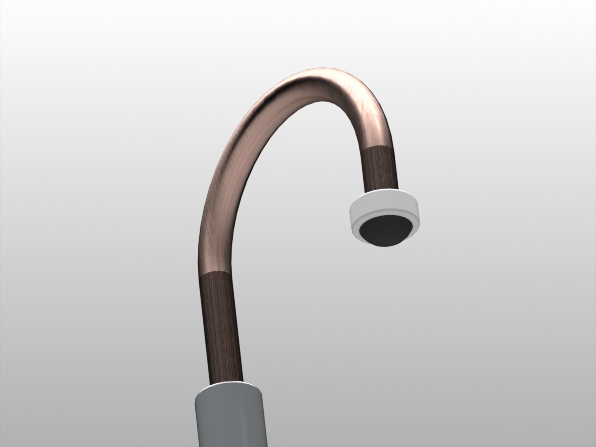
The design of the detection system can be seen in the following figures:
 |
 |
 |
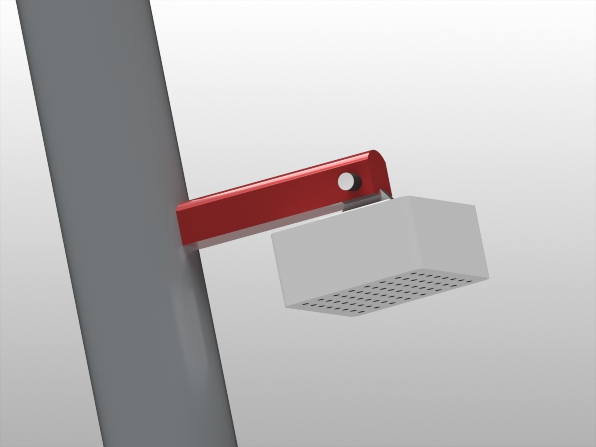 |
The components are mounted to a pole. This pole has a sleek shape, somewhat resembling a street lantern. The diameter of the base of the pole is one meter. This value is chosen to ensure stability and at the same make sure the system has a small footprint and does not take up too much space, as to avoid hindrance for the flow of people walking past the system.
The microphone-array box is placed at a height of 2.5 meters as specified by the manufacturer. The box is mounted via a hinge with a tightening-screw such that the angle of the box can be adapted to focus a specific area. The camera is placed at a height of 3.2 meters such that it has a clear overview of the surrounding area and its view is not obstructed by the microphone box.
Measurement station
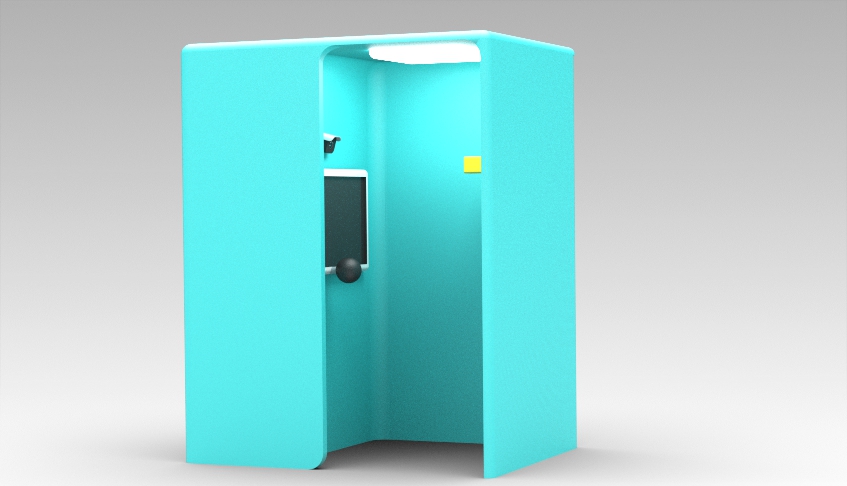
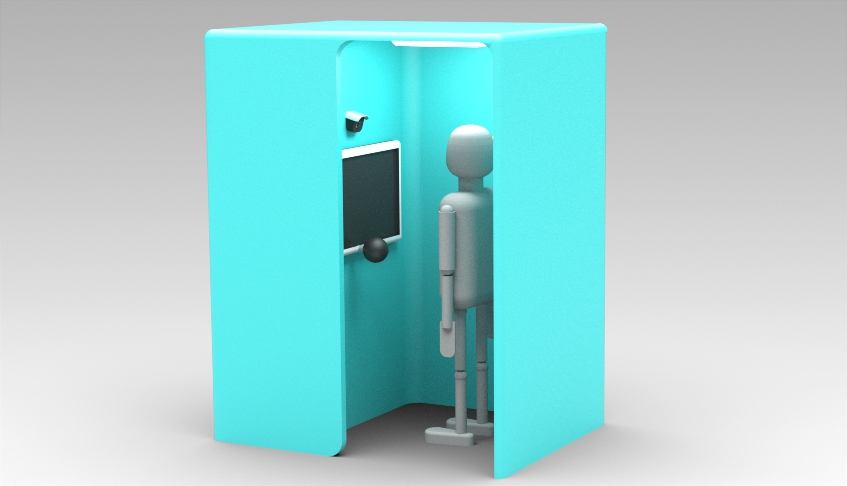
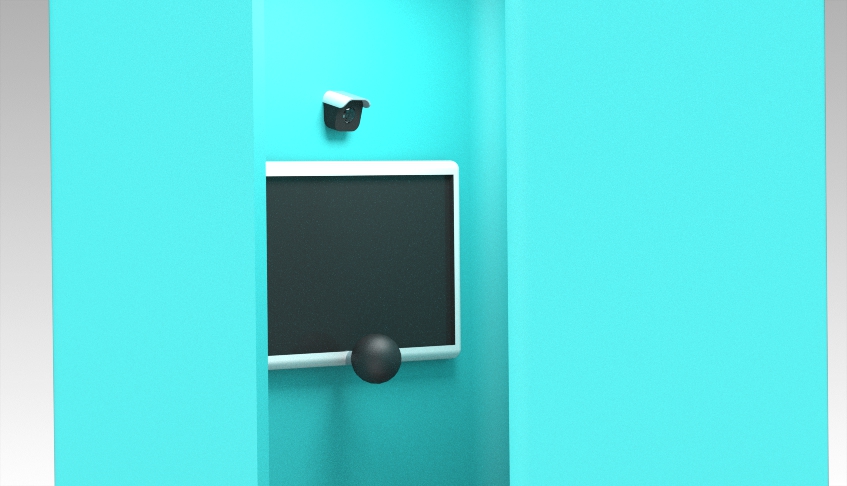
The design of the measurement station can be seen in the following figures:
 |
 |
 |
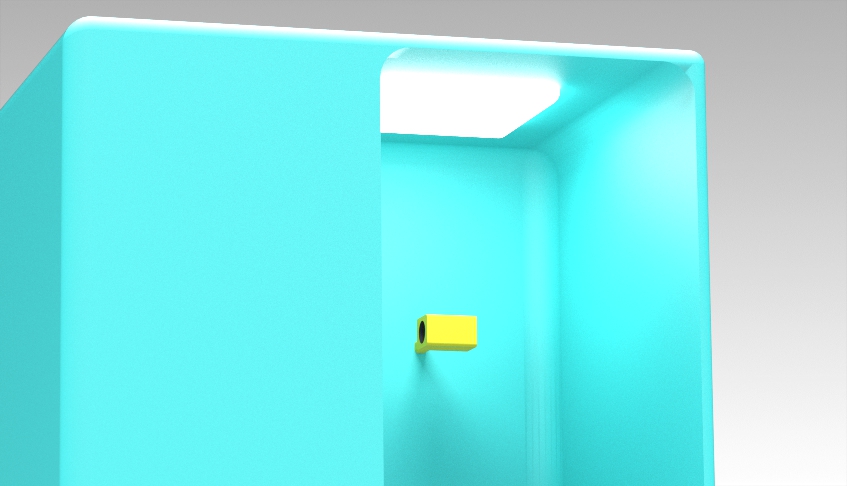 |
The design of the measurement station is inspired by the design of a photo booth. The system is fully enclosed, expect for the entrance, to ensure the privacy of the person being tested. The cabin itself is 2.5 meters high and 1.5 meters wide. These values are chosen to ensure a small footprint but still enable the user to comfortably use it without feeling cramped. The cabin has a light blue colour to make it clearly visible. This is to increase awareness among visitors of the Heuvel Galerie and passers-by that this system is in place. The paint has a matte finish since reflections inside the cabin could decrease the accuracy of the thermal camera.
The user will be facing the screen. The screen will show the instructions for the user concerning what to do and where to stand. On the bottom edge of the screen the microphone for the cough determination is placed. Above the screen the thermal camera is positioned. On the roof of the cabin there is a lamp. This lamp contains a normal light bulb to illuminate the cabin and an UV-light to disinfect the cabin after use. On the wall of the cabin a black body calibrator is present. This device is used to calibrate the thermal camera. It is placed at around head height and at somewhat equal distance from the thermal camera as where the person will stand. This is to ensure the calibration of the camera happens at somewhat the same distance as where a person’s head will be, which results in the most accurate calibration and following tests. The outside of the black body calibrator is painted matte yellow for high visibility so people will not bump their head.
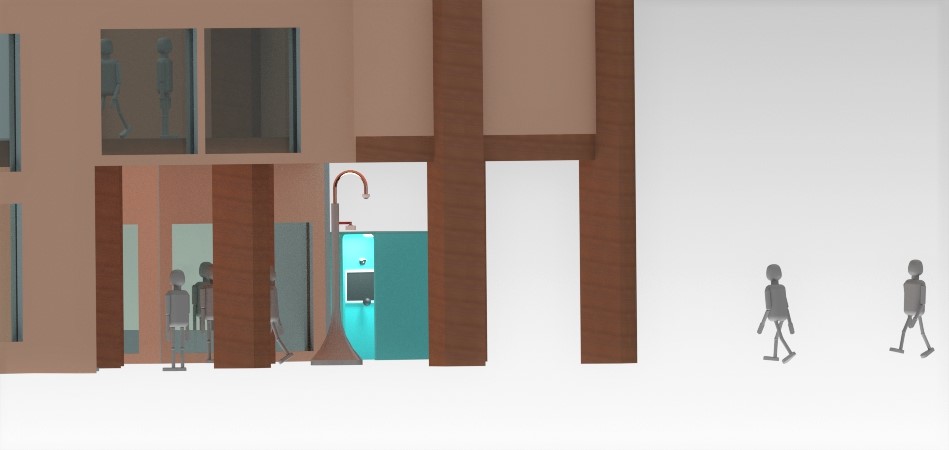
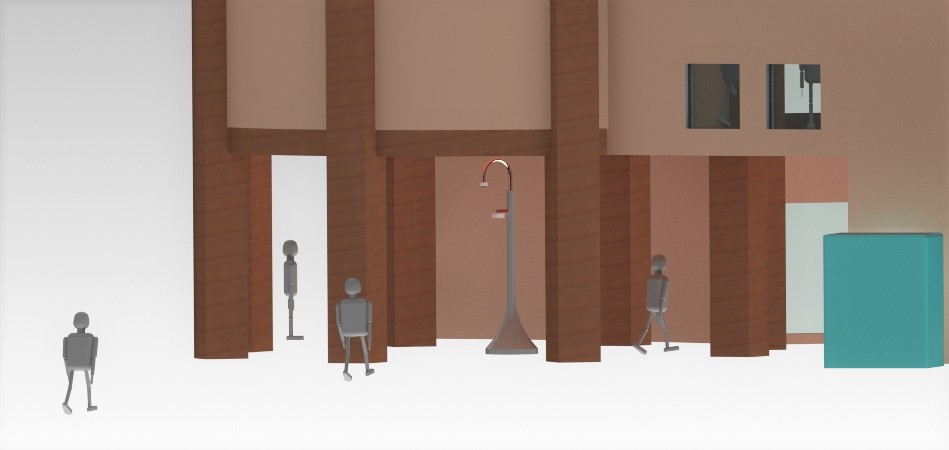
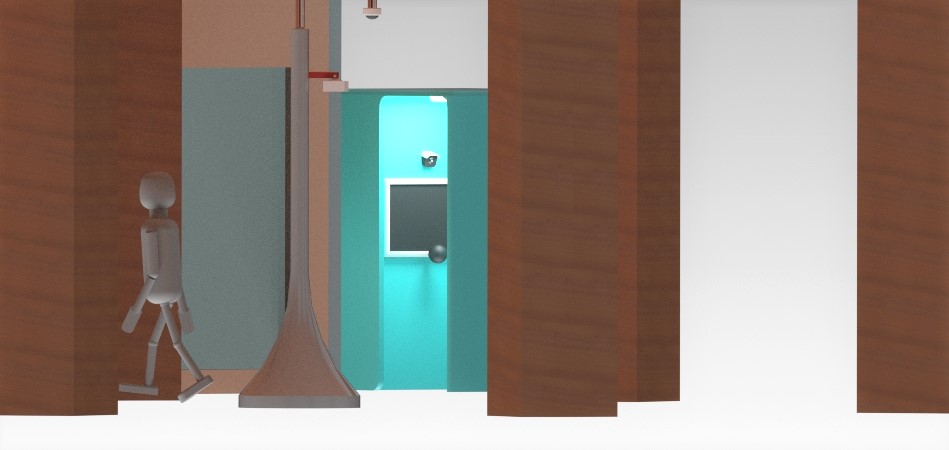
System placed at Heuvel Galerie
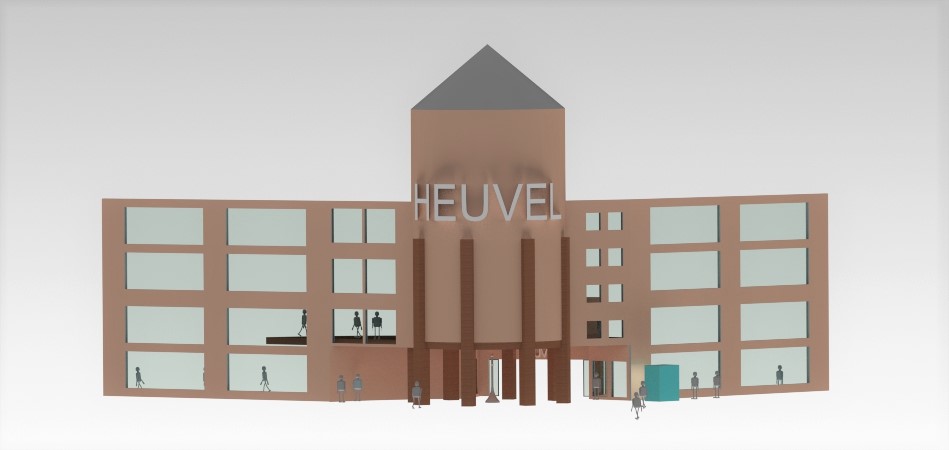
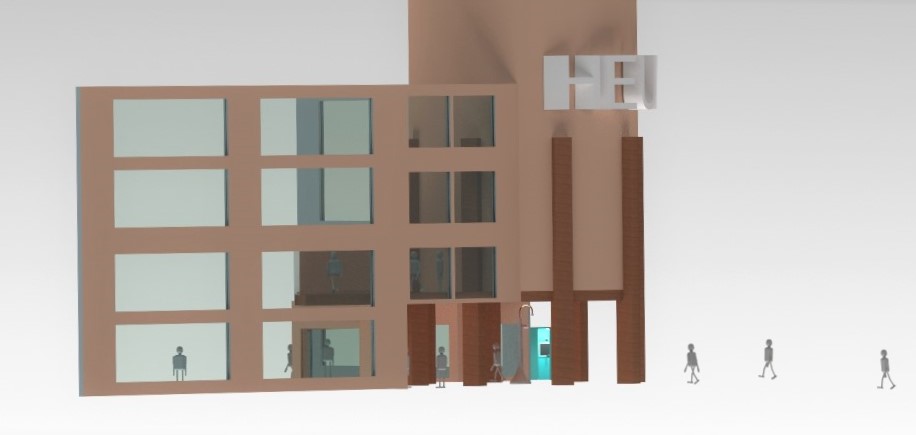
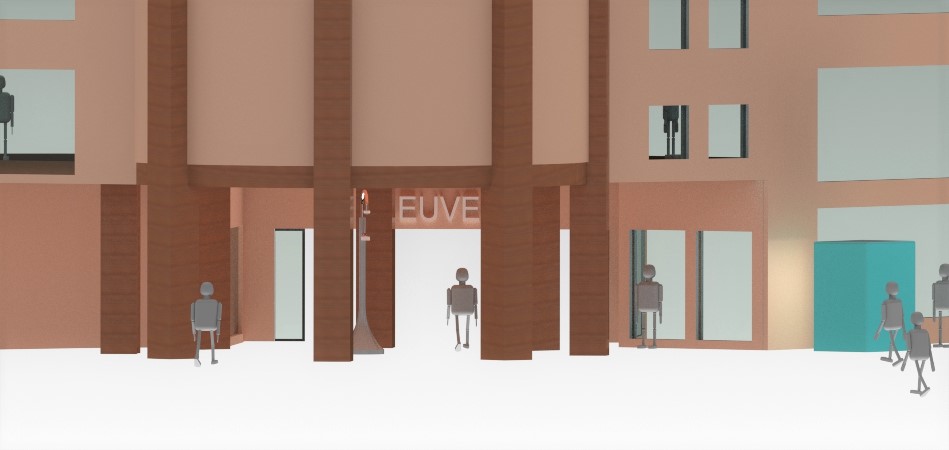
An impression of the system placed at the western entrance of the Heuvel Galerie (Markt/Nieuwstraat) can be seen in the following figures:
 |
 |
 |
 |
 |
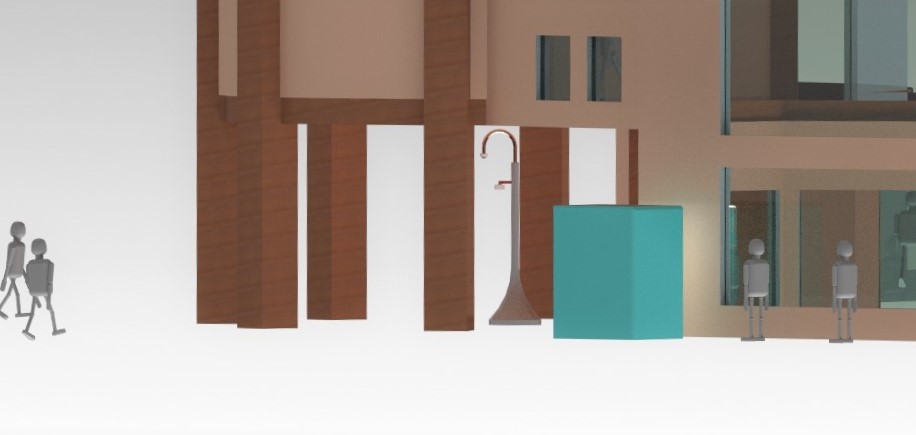 |
The detection system is placed in the middle of the little round square in front of the entrance as described in the section Checkpoint description. The measurement station is placed with its entrance facing a wall, such that it is more difficult for passers-by to peek inside the cabin.
The procedure
In this section, the testing procedure and operation of the system is explained. After that, the pseudocode for the software is given.
Procedure
The entire procedure goes as follows. Next to the entrance there is someone from the Heuvel Galerie security team. This person has a screen in front of him where it shows a picture of the person that he needs to pick out (the person that he needs to pick out is red outlined in the picture). The people that are picked by the system are people that were coughing. The system can also pick out random people, this happens for every 2 people detected coughing by the system and only if there is no queue for the medical station.
If the person chosen by the system goes towards the entrance the guard asks the person to either stand in the queue for the measurement station or to go home. If the person goes home, the guard checks the box “Person went home”, otherwise he checks the box ”Person went to medical station”. If the system could not detect which person in a group of people was coughing the system will circle the entire group and it is left to the guards discretion to choose who to pick out and send to the measurement station.
At the measurement station there is a medical staff member present. If nobody is inside the measurement station, the medical staff member then takes the first person in the queue to the measurement station. Here the medical staff asks first if the person was coughing due to a chronic illness.
After this he lets the person enter the measurement station. Inside the measurement station there is a screen with instructions the person picked out by the detection system should follow. The first instruction is to cough into the microphone. The medical personnel also watches if this is done correctly. After this the person is asked to stand still for a temperature measurement. The result of both tests is shown inside the measurement station. The person is tested positive for corona if one or both of the tests are positive, so if the person has a fever or if the person has the characteristic cough of corona or both. If the person was however coughing due to a chronic illness the person needs to have both a fever and a cough characteristic to corona to be tested positive.
When the person comes out of the measurement station the medical staff signs to the guard if the person was tested positive or negative to ensure a person tested positive does not still enter the Heuvel Galerie. The sign is putting up 1 finger for allowed to enter and 2 fingers for not allowed to enter.
Pseudocode
Detection device:
T1 = Time necessary to detect who coughed from video (10 sec);
T2 = Time of the sound of a cough (10 sec);
T3 = Time until message should be deleted (1 minute);
T4 = Time to wait for the next person until it is determined there is no queue in other words the time to enter the measurement station (30 sec);
Always{
- Record camera on;
- Record microphone on;
- Delete video data older than T1;
- Delete microphone data older than T2;
}
If (Sound recorded from microphone = sound of a cough){
- Load the current video recorded by the camera;
- Determine from microphones the direction of the cough;
- Look at the movements of the people in that direction;
- Determine which persons movements correspond to a person coughing;
- If(unclear which person coughed due to person being in a group){
- red outline the group where the sound was made and save as image;
- }
- Else if(nobody is in the area the sound came from or person is walking away from the entrance){
- break out of If(Sound recorded from microphone = sound of a cough);
- }
- Else{
- Red outline the person in single frame and save as image;
- }
- Send image to medical personnel;
}
If(nobody at measurement station and no person was sent to the measurement station for T4 ){
- Pick random person for every 2 people detected by the device;
- Red outline the person in single frame and save as image;
- Send image to medical personnel;
}
Measurement station:
Loop{
- Show on screen (“Please cough in the microphone”);
- If (nobody inside for T4 or longer){
- Send to detection device that nobody is at detection station;
- }
- If (cough is detected){
- Send someone is in the measurement station to detection device;
- Loop{
- Show on screen(“Analyzing cough”)
- Analyze cough;
- If (cough was unclear){
- Show on screen (“Please cough in the microphone again the sample was unclear ”);
- Detect cough;
- }
- End loop if cough was clear;
- }
- Show on screen(“Please sit still for a temperature measurement”)
- Measure temperature;
- If(cough is analyzed to be a corona cough or person has fever){
- Put message on screen the person was tested positive for 1 test for 10 sec.
- }
- If(cough is analyzed to be a corona cough and person has fever){
- Put message on screen the person was tested positive for 2 tests for 10 sec.
- }
- If(No test was positive){
- Put message on screen the person was tested positive for 0 tests for 10 sec.
- }
- }
}
Security personnel
If (Person detection system sends image){
- Open image in new window;
- put a checkbox on the picture with text "Person went home";
- put a checkbox on the picture with text "Person went to the measurement station";
- Loop{
- If (checkbox is clicked or T3){
- close window with image that reached T3 or whose checkbox was clicked;
- }
- }
}
Posters
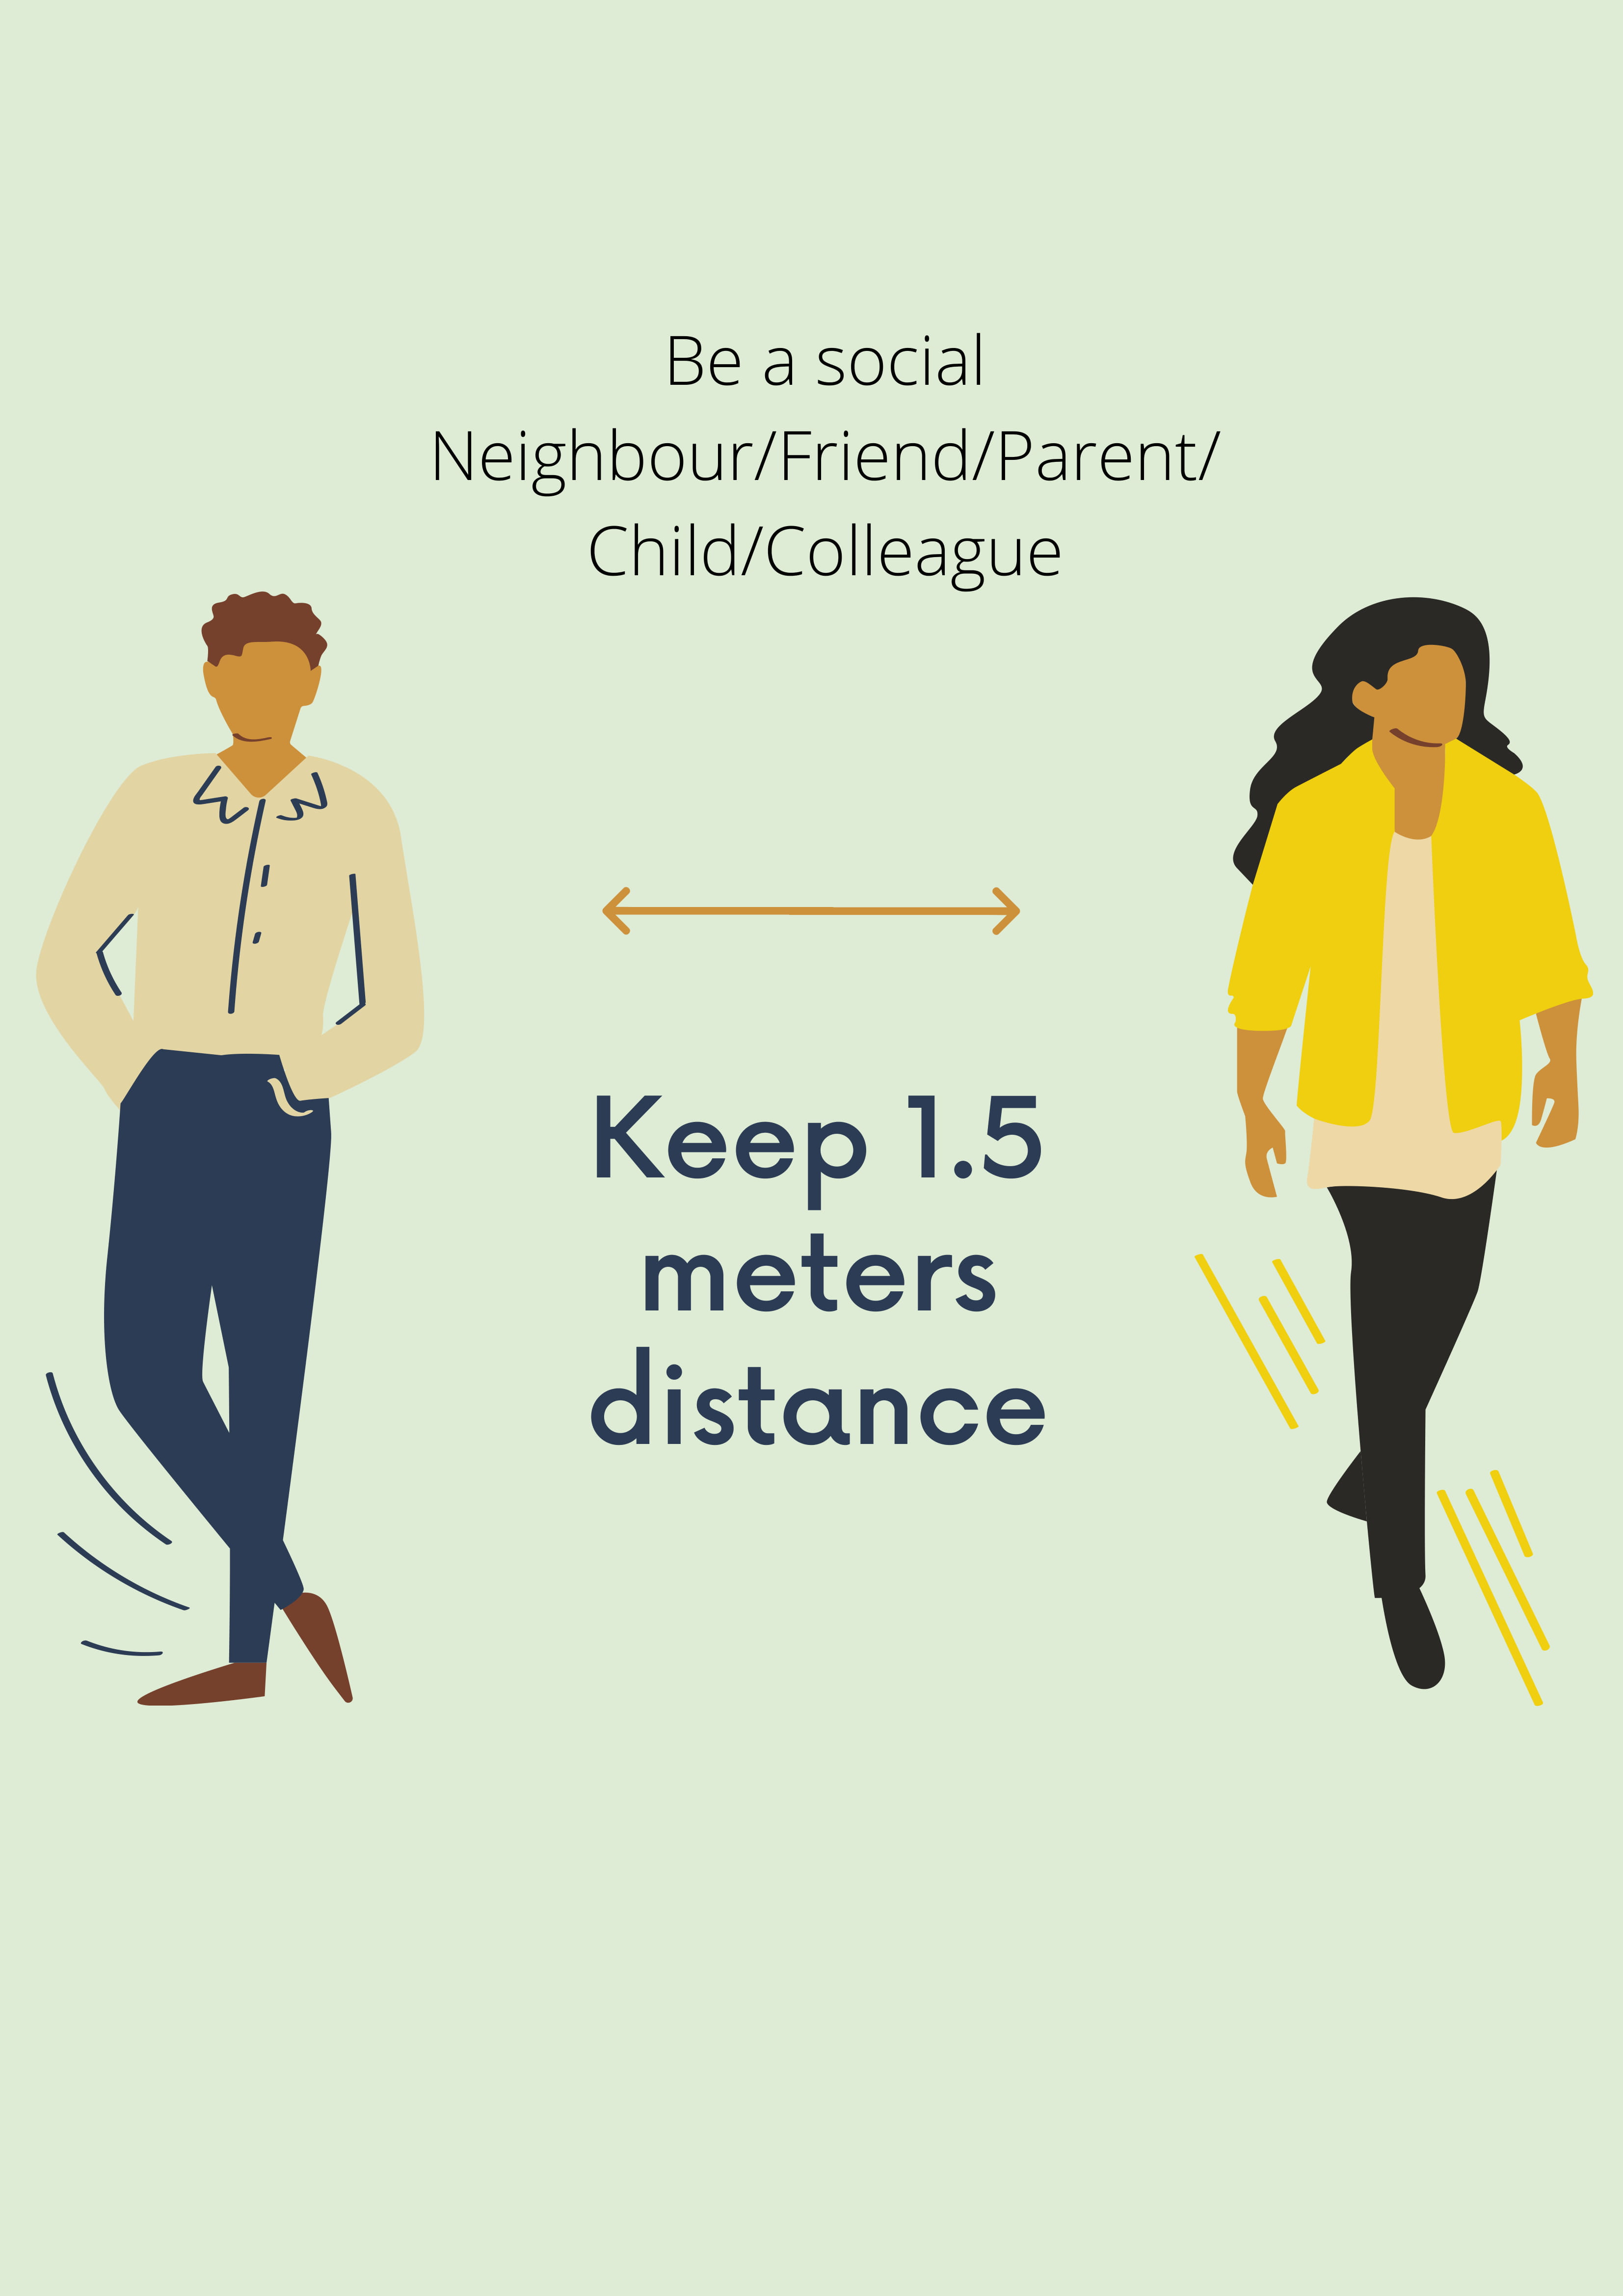
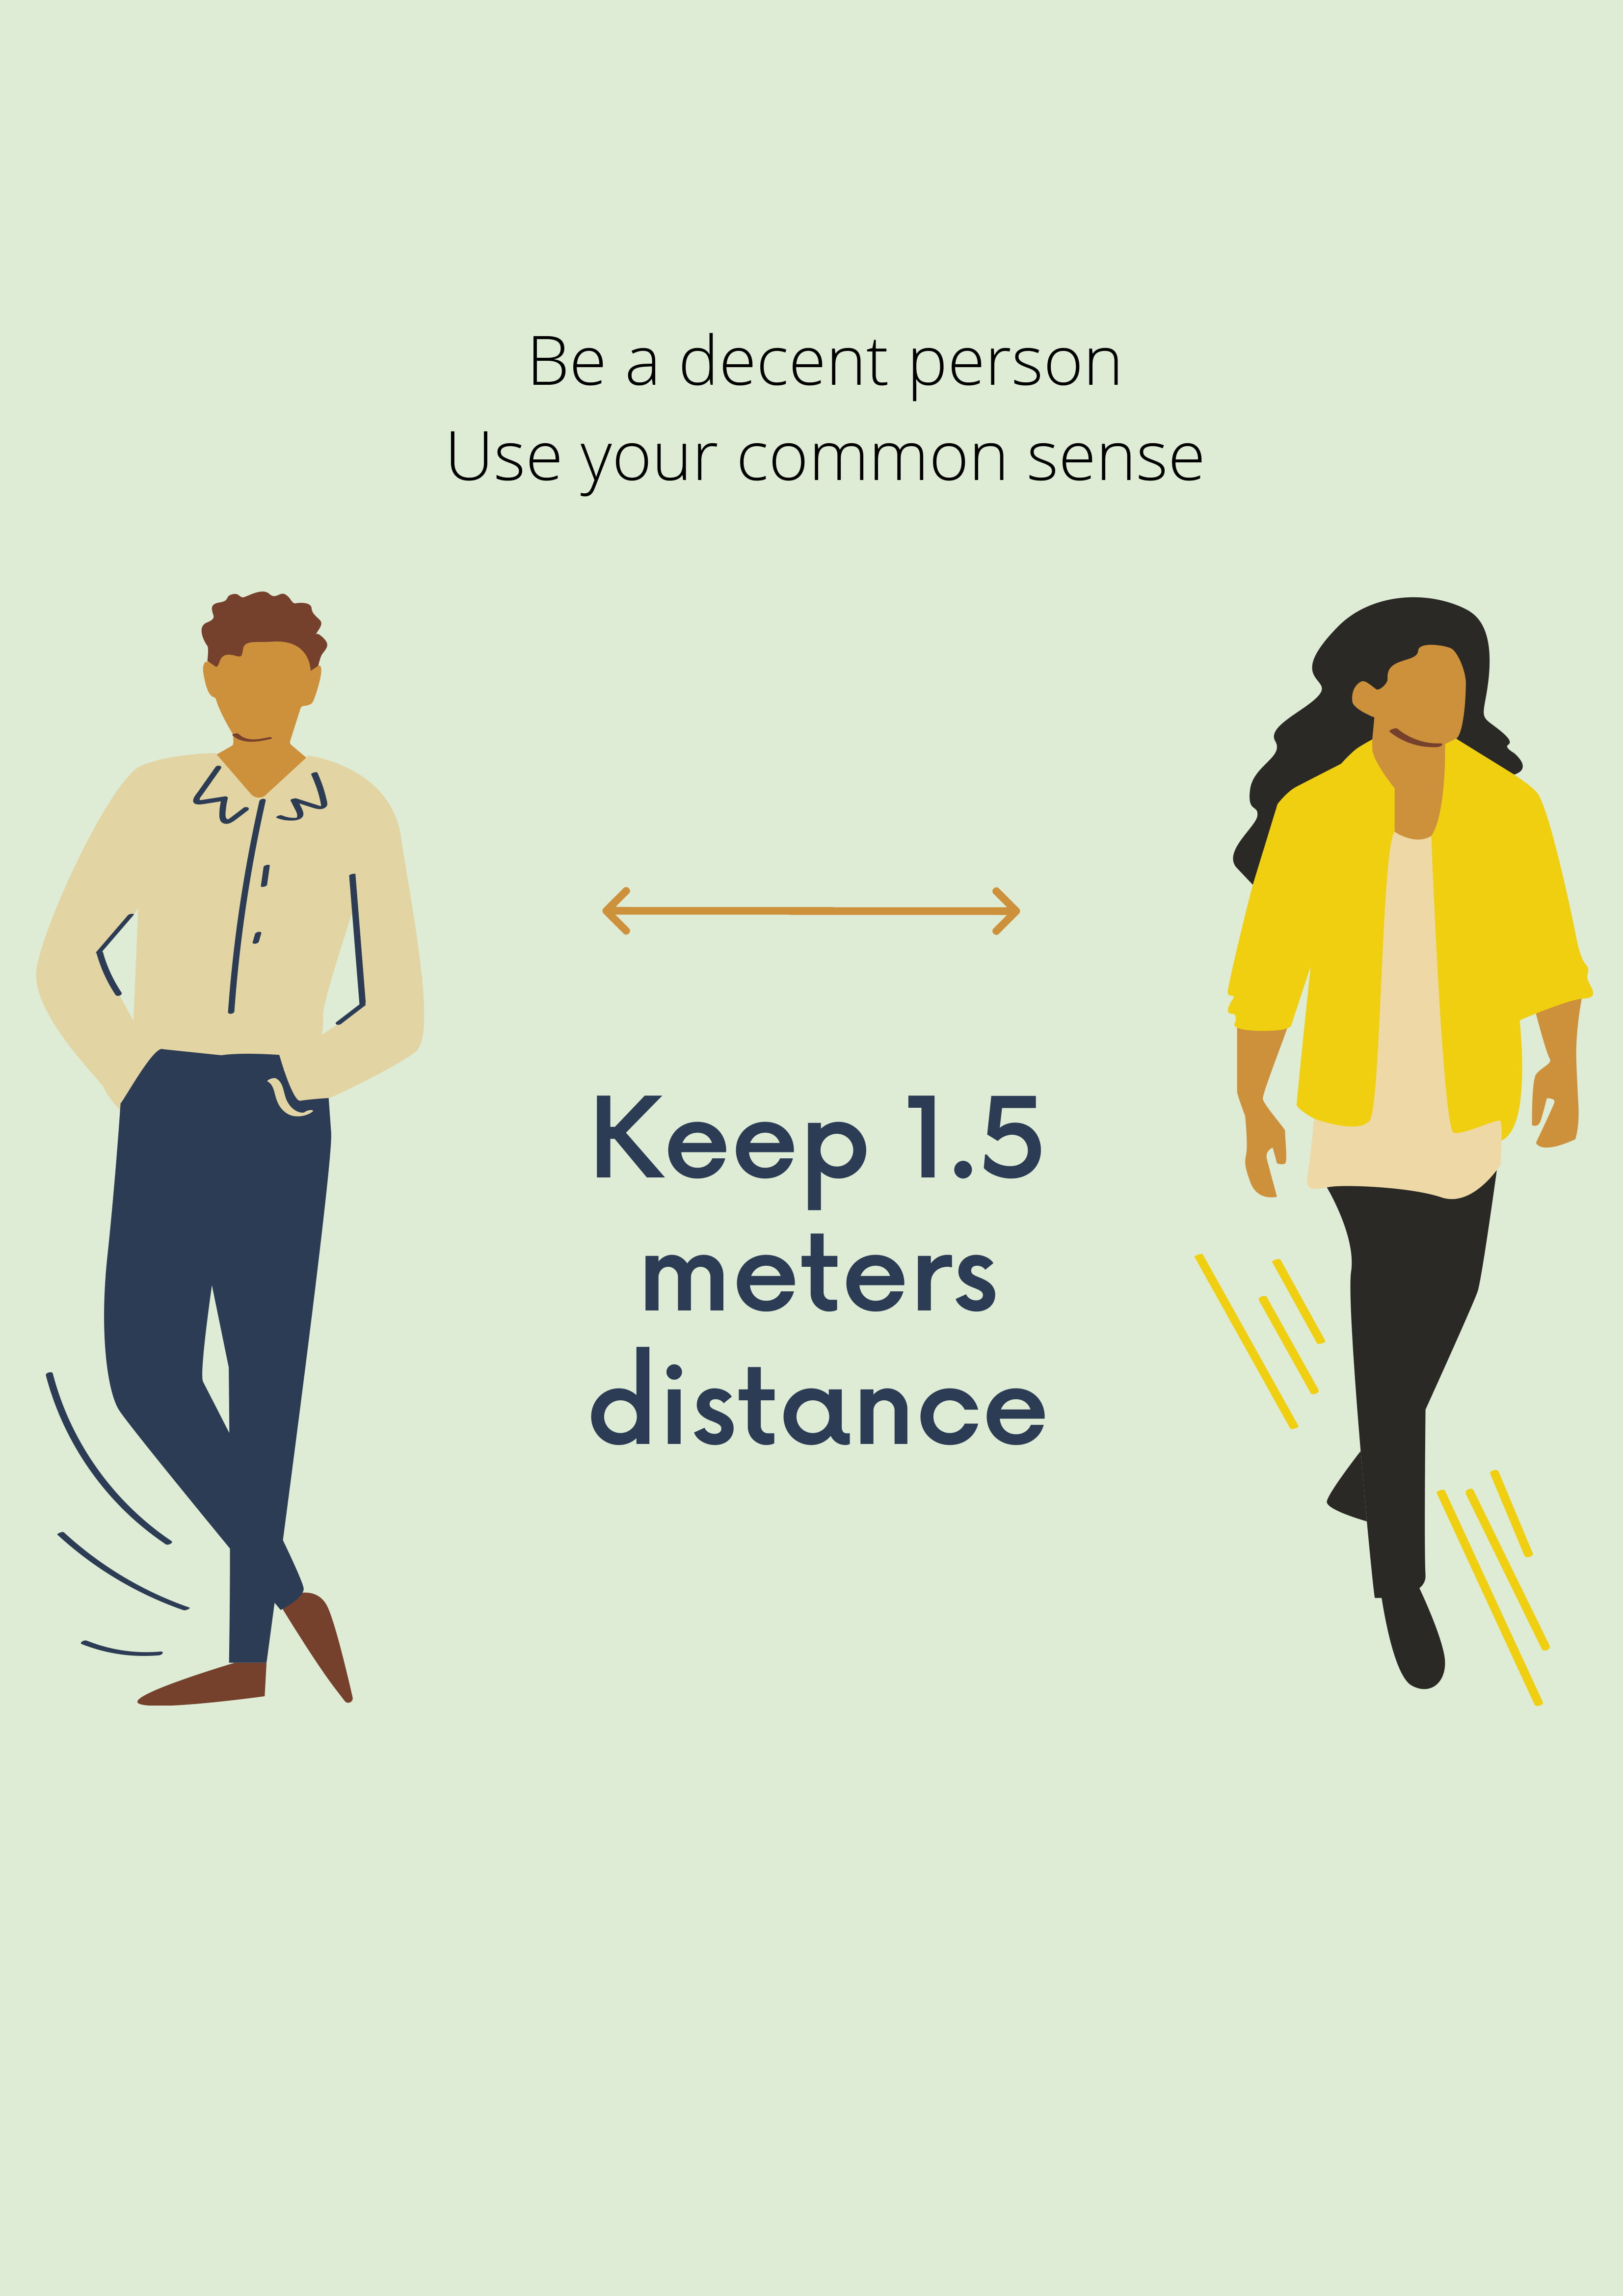
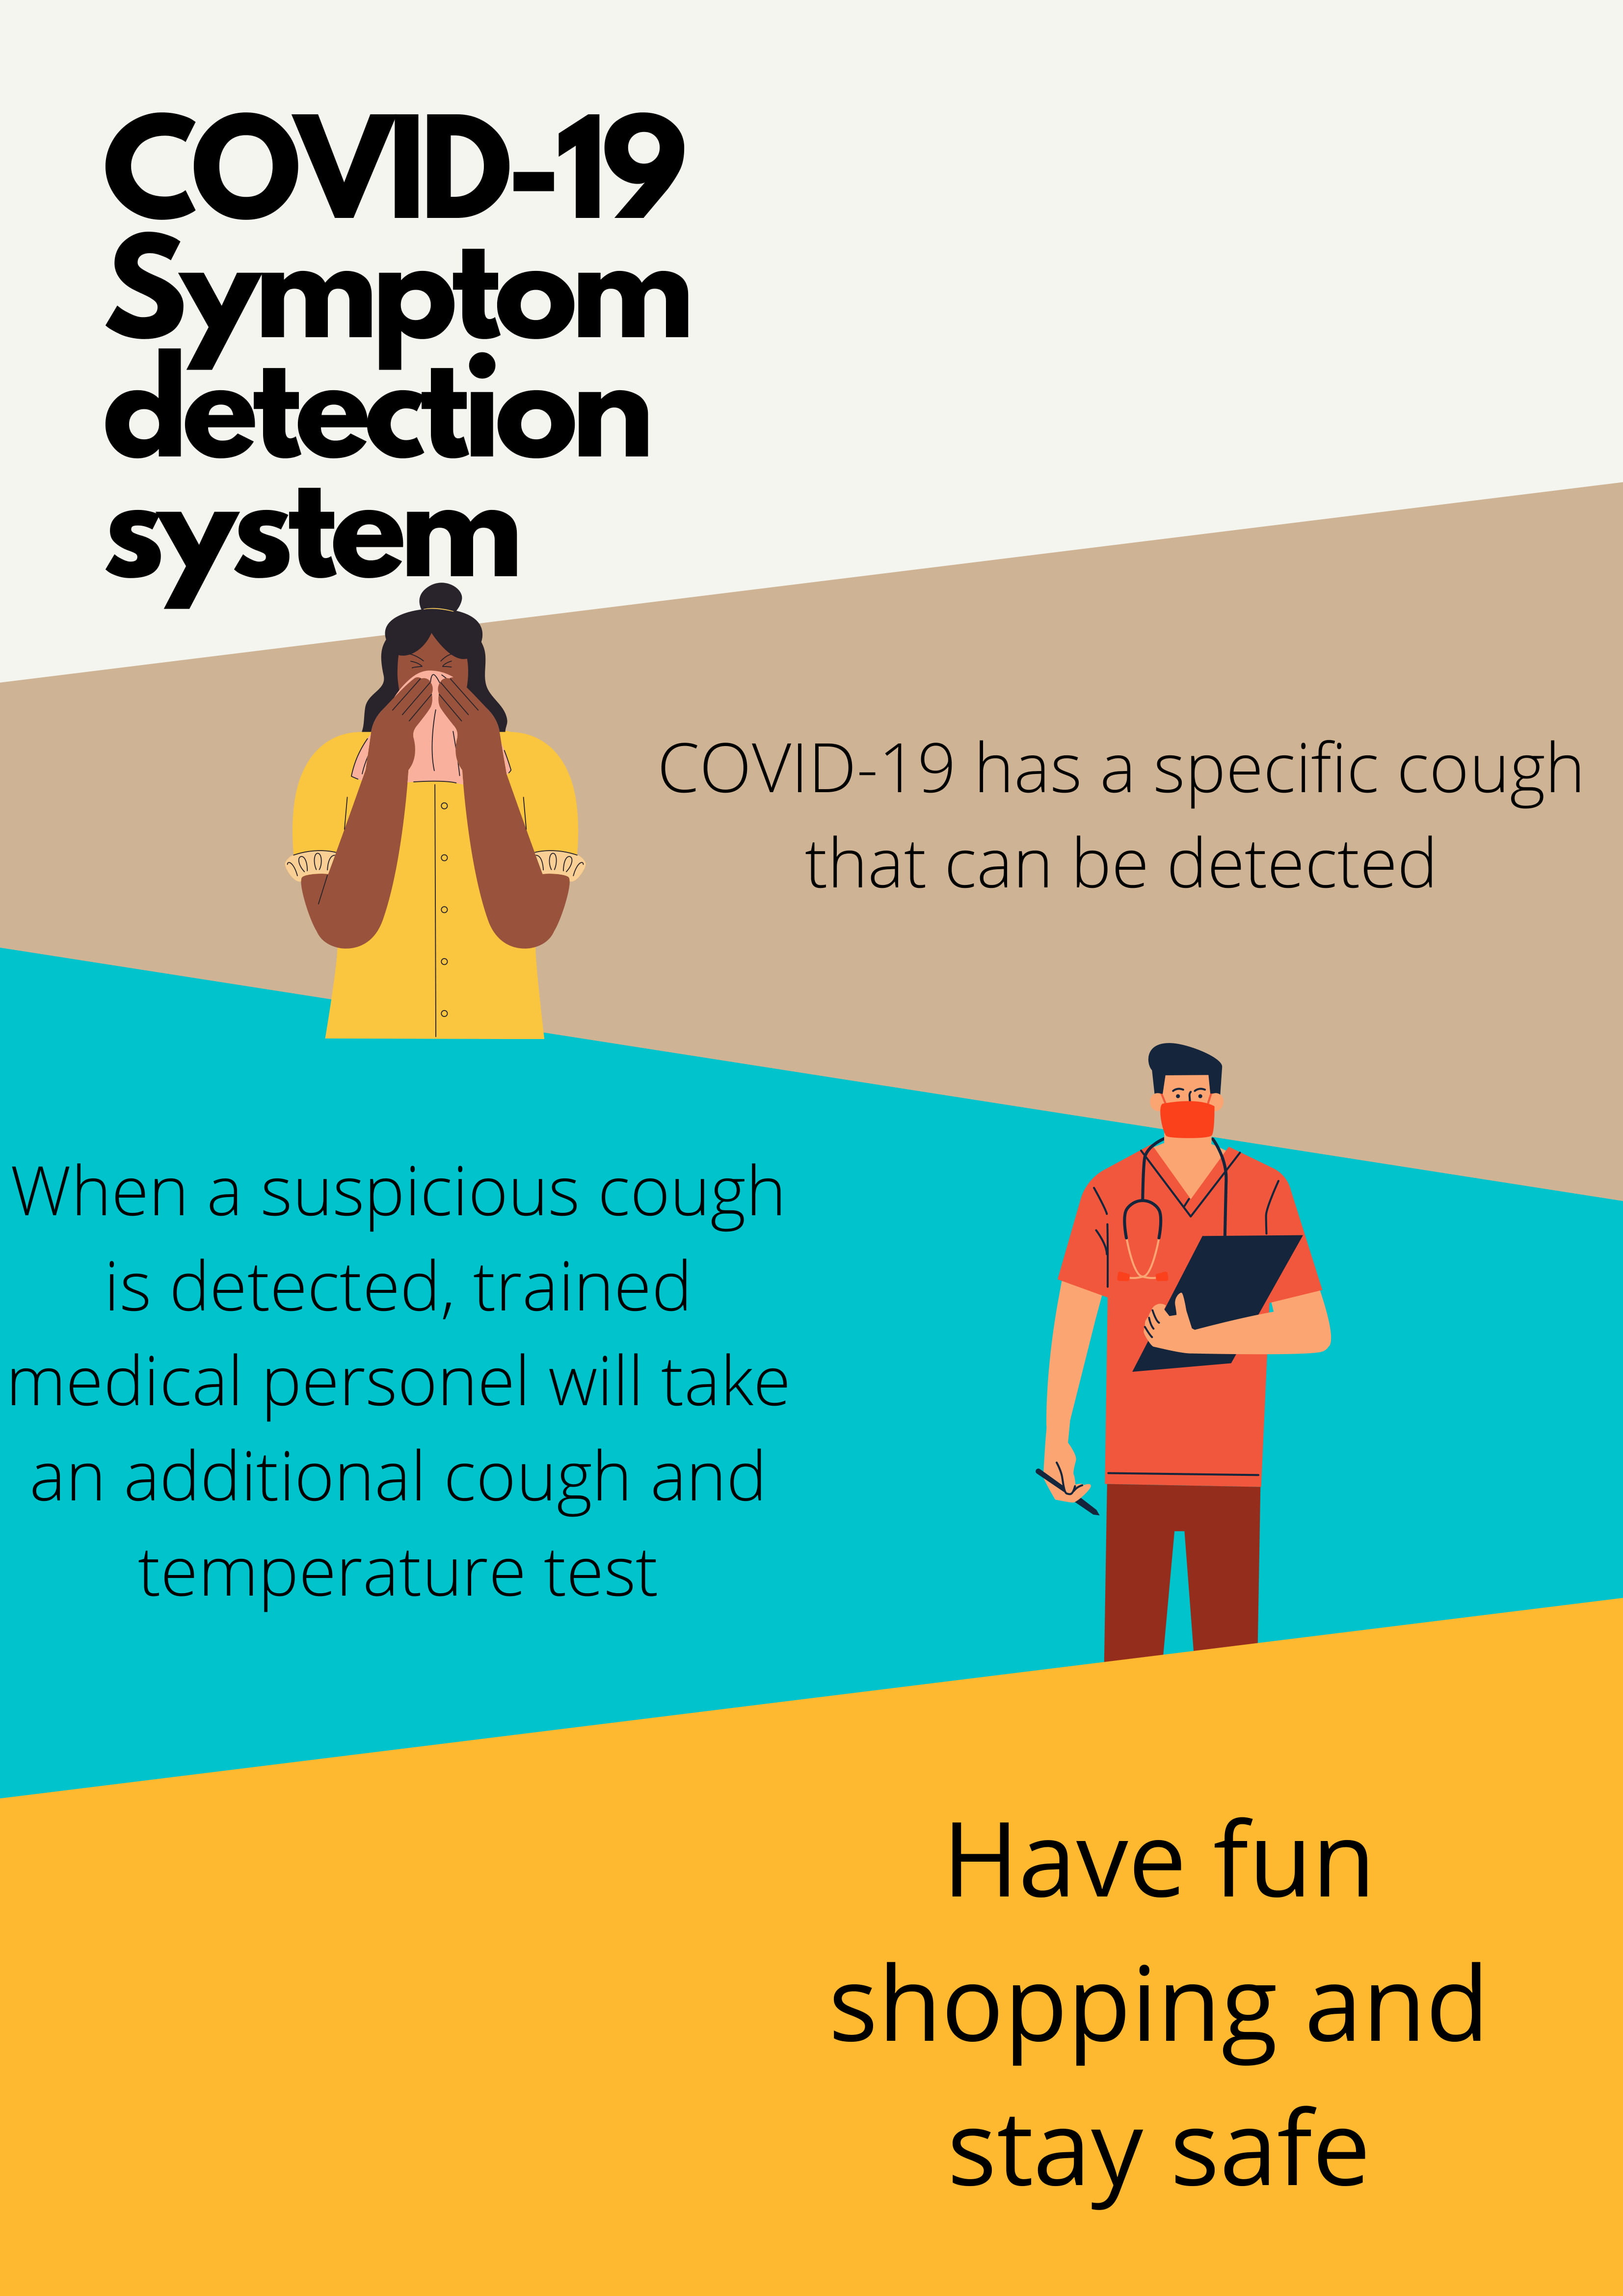
Three posters were made, two to make sure people keep their distance, and one to make people aware of the system. The first two posters were specifically designed for high-self-monitor people and low-self-monitor people, as explained in the section about the psychological effects of the detection system.
 |
 |
 |
Simulations
Here, the Matlab and Netlogo simulations used for the design are explained. The results from the simulation are discussed, evaluating the effectiveness of the system.
Simulation of throughput
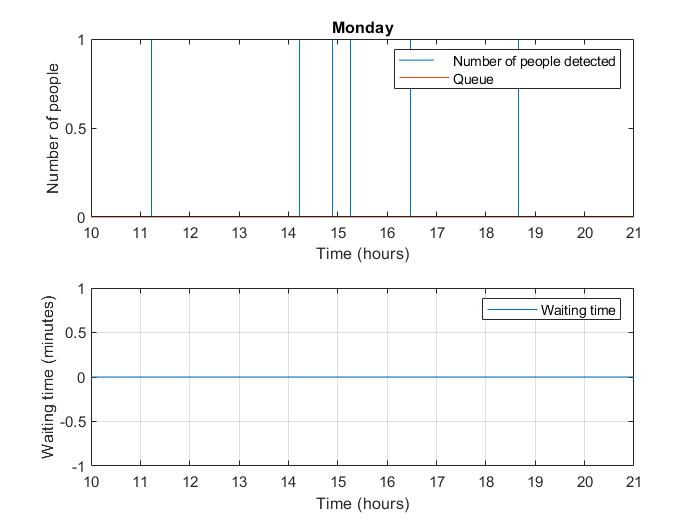
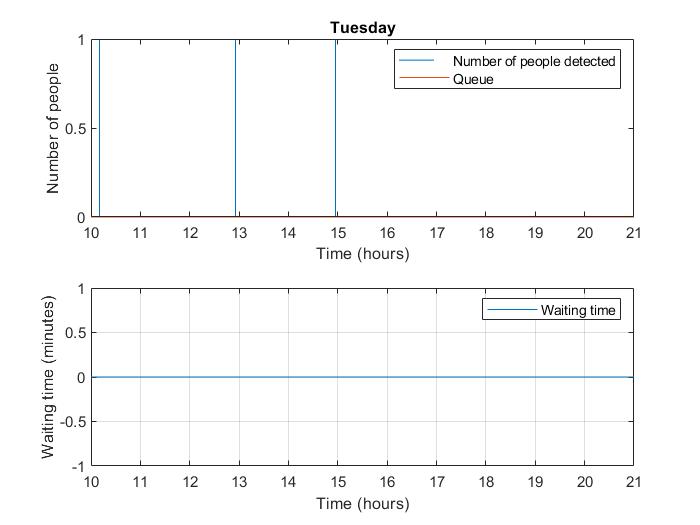
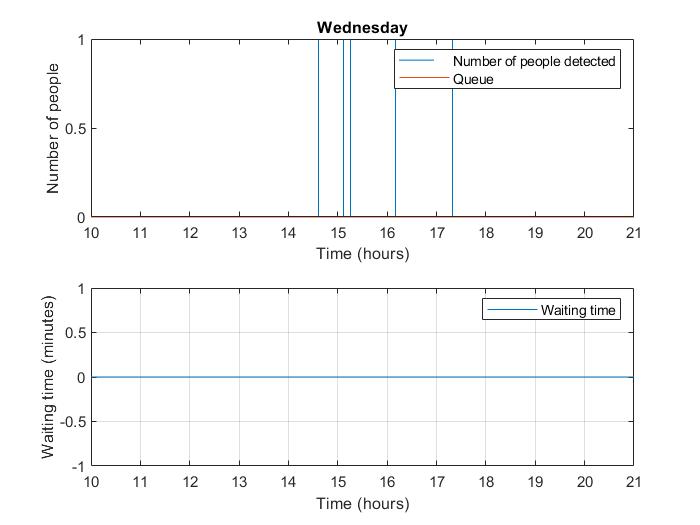
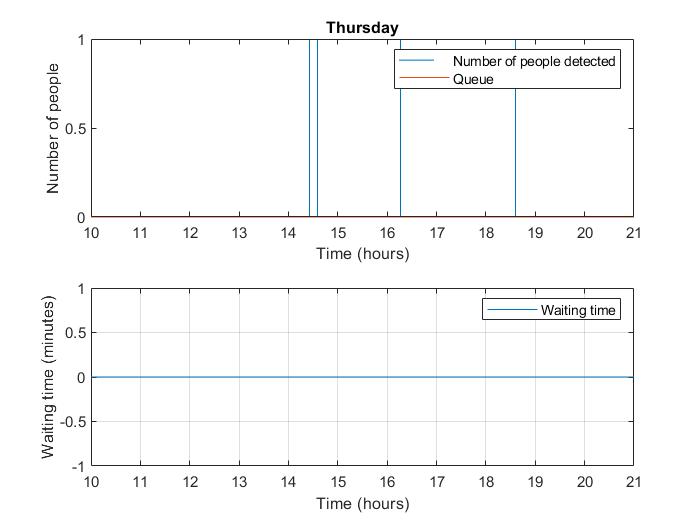
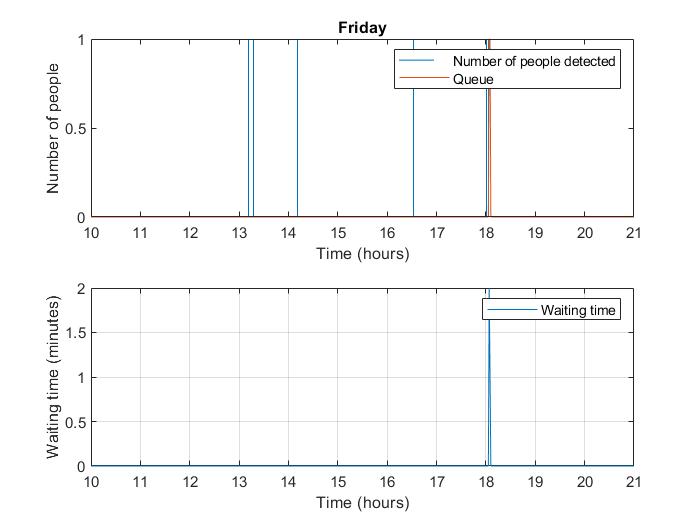
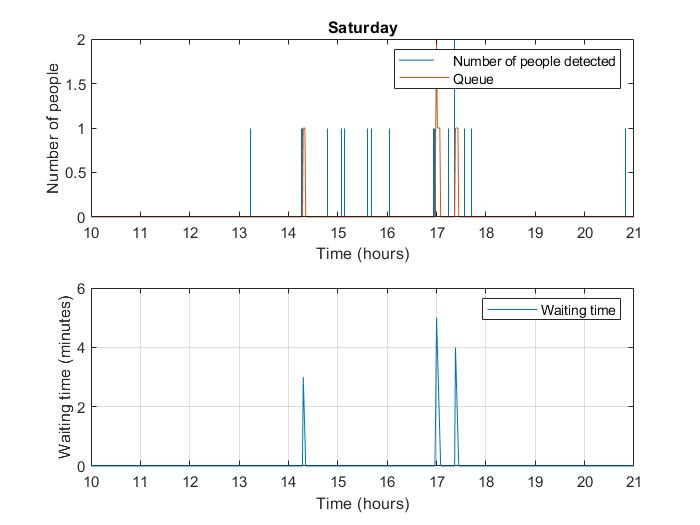
The Matlab simulation is used to calculate the amount of measurement stations that are necessary to not hinder the customers too much. The simulation shows the amount of people waiting in the queue to enter the measurement station, the amount of people detected every minute, and the amount of time the last person in the queue has to wait to enter the measurement station over the time of the day.
Input
The Matlab simulation takes as inputs, the chance a person is infected, the chance an infected person is detected per by the first detection device, the chance a healthy person is detected by the first detection device and the time people spend inside of the measurement station.
The chance a healthy person is infected is 0.001. The chance that a healthy person is detected is the chance a healthy person coughs times the chance the detection device detects the cough: 0.0008*0.87 = 0.000696. The chance a infected person is detected is calculated the same as the chance a healthy person is detected: 0.0512*0.87 = 0.044544. The time a person stays inside the measurement station is 4 minutes. The chance a person is infected, the chance a healthy and infected person cough near the detection device and the amount of time spend inside the measurement station is explained in the numbers section.
Another input of the Matlab simulation would be the amount of people entering the Heuvel Galerie. This input is divided in three categories: The people every minute entering during busy, medium busy and quiet hours. This was decided based on that the Heuvel Galerie has a table on their website that shows when these hours are. This table can also be seen underneath the header Use case: Heuvel Galerie. Since this table only shows when busy, medium busy and quiet hours are, we went during these times to the Heuvel Galerie to count how many people entered during this time. The Heuvel Galerie has a total of 4 entrances 2 busy entrances and 2 quiet entrances. Due to a lack of time in the project it was not feasible to count at all the entrances during the busy, medium busy and quiet hours. So instead we counted at only 2 entrances, a quiet entrance and a busy entrance. We counted for 30 minutes as to get a more accurate number of how many people entered. After this to calculate the total amount of people that entered during their respective times the counted answer is multiplied by 2 and divided by 30. This gives the following input values:
People entering during quiet hours: 6
People entering during medium busy hours: 21
People entering during busy hours: 66
The last input is the number of measurement stations, this input will be varied to make a conclusion toward how many measurement stations are necessary.
The simulation
The Matlab model calculates the outputs (the amount of people in the queue, the waiting time and the number of people detected) every minute. The fist thing done in the Matlab simulation is varying the amount of people entering every minute with a for loop. In this for loop it is first decided how many of the people that entered were healthy and how many were infected. The way the Matlab simulation determines this is randomly with the probability described in the Input section. After it is determined how many of the people that entered are healthy and how many are infected, it is determined how many people are detected by the device. This is also done separately for the healthy and infected people after which they are added since they have a different detection chance. The way the amount of people that are detected is determined is in the same way randomly with the probability described in the input section.
Next, the random people are added to the amount of detected people. This is done by adding 1 person to the amount of people detected for every 2 people that are detected by the detection device. The random person is only added if 1 of the measurement stations is empty, the way this is determined is by making a variable (m in the Matlab code) that is equal to 1 if someone is inside the measurement station and 0 if it is empty. The total amount of people here is added to the number of people standing in the queue. Thereafter, it is checked if the people/person inside the measurement station(s) have/has been in there for the time they are inside the measurement station the measurement station is empties and the variable m is put back to 0.
Following that, if the measurement station(s) is/are empty a person from the queue is added to them and the queue is lowered by 1. The number of measurement stations used here is the value specified by the input. If the queue is empty, no person will be added to the measurement station and m stays at 0. For the measurement stations where a person was added, the variable m goes back to 1.
Finally the amount of time the last person in the queue needs to wait is calculated. This is done by looking at which measurement station the person will go to, then adding the time the person inside of that station still stays inside the measurement station with the amount of people before him/her that also go into the same measurement station as her times the time they spend inside of the measurement station. (Time person stays in measurement station + people going to the same measurement station*time people stay inside measurement station)
Results
To get results from the simulation, it is important to know how long people are willing to spend in the queue. Form the last questionnaire, it can be seen that people are willing to spend about 6.4 minutes in the queue. Since the Matlab simulation works with random numbers it is necessary to run the simulation multiple times to get an estimate of how long people will need to stand in the queue. Underneath one of the runs of the simulation is shown with the amount of measurement stations equal to 1. The run includes all the different days since it might vary in day how many measurement stations would be necessary. On the x-axis the time of the day is shown while on the y-axis the amount of people detected in that minute, the amount of people in the queue and the waiting time is shown.
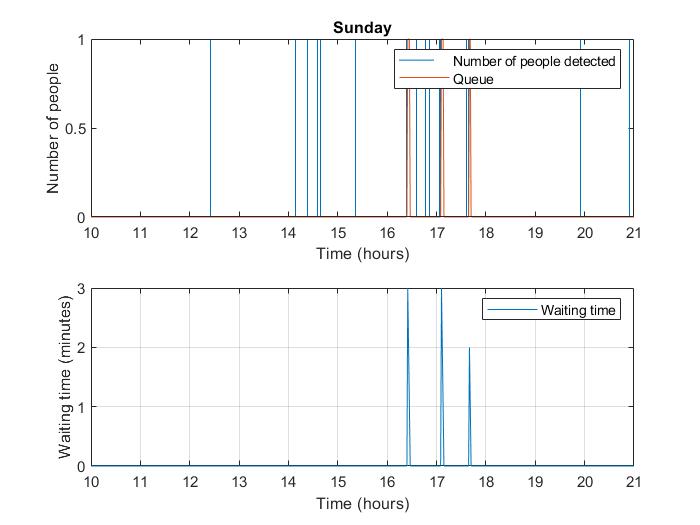
From the current graphs it can already be seen that usually a person does not have to wait in order to enter a measurement station if there is only 1 available. After running the simulation 50 times the highest amount if waiting time was 7 minutes on Saturday and Sunday, this however occurred only a few times. On the weekdays the highest waiting time was 5 minutes.
When the number measurement station was increased to 2 and another 50 runs of the simulation were done, the highest amount of time the person had to wait in the weekend was 4 minutes. The highest during the week was also 3 minutes.
From this it can be concluded that during the week a single measurement station is enough to handle the people send from the detection device. In the weekend the number of measurement stations could be increased to 2 as to avoid that a person needs to wait for 7 minutes. But given how often this happened and how close 7 minutes is to 6.40 minutes this will not be necessary.
Underneath the file for the matlab simulation is given.
Simulation of people flow
The COVID-19 symptom detection system is designed to be placed at the entrances of the Heuvel Galerie. Here, it can monitor the flow of people entering the shoppincenter. To visualize the operation of the system and evaluate it's effectiveness, a Netlogo model has been made.
The model
The model is created and written in a program called Netlogo.[45] Netlogo is a modelling environment which can be used to model the behavior of large numbers of agents (called turtles) at the same time, and thus is suitable for modeling and visualizing the flow of people at the entrance of the Heuvel Galerie.
In the model, a flow of people moving towards the entrance of the Heuvel Galerie is modelled, as can be seen in the following figure:
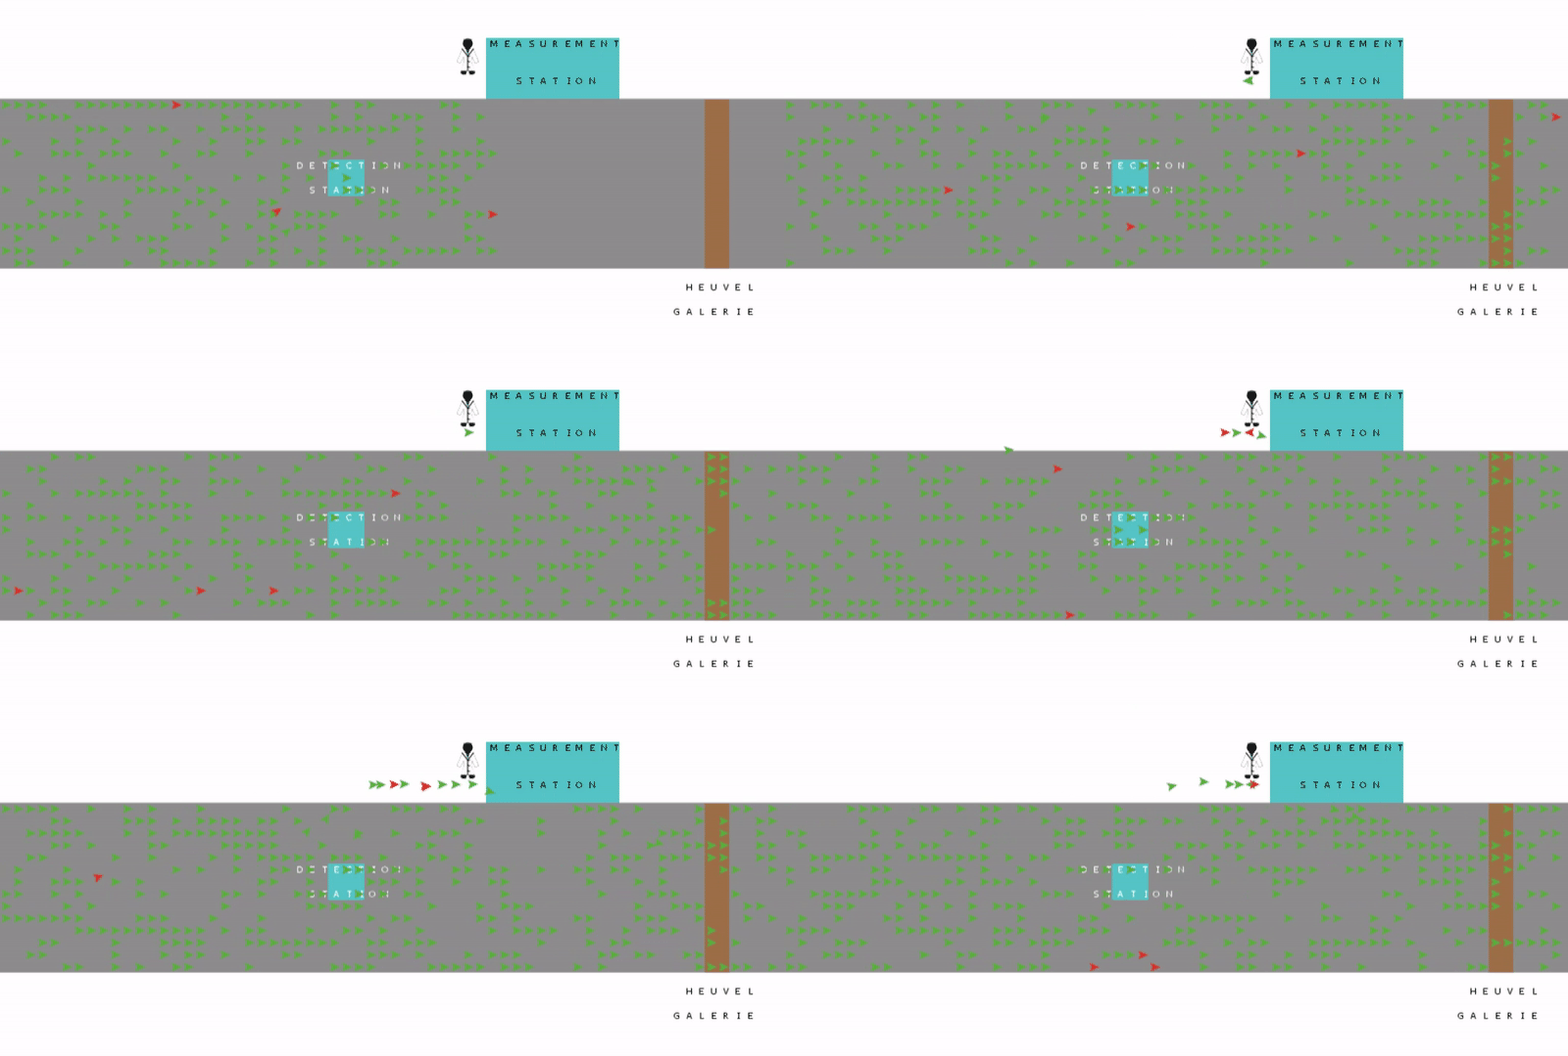
The people are represented by arrows. The environment consists of tiles and is updated every tick (timestep). Each arrow moves 1 tile per tick. A green arrow indicates a healthy person and a red arrow indicates a person with symptoms corresponding to COVID-19. In the middle of the flow of people is the detection station. This is the station with the camera and microphone. When people are to the left of the detection station, they can be detected. When they are detected they are sent to the measurement station (in the top part of the screen). Here, additional measurements are performed. From the measurement station people can be turned away or they are allowed to re-join the flow of people entering the Heuvel Galerie.

The behavior and outcome of the model is controlled by a set of parameters, as can be seen in the figure on the right. These parameters are implemented as sliders in the user interface such that they can easily be changed. The parameters are defined as follows:
- perc_infected: The percentage of the persons that are infected and show COVID-19 symptoms. As explained in the (insert numbers section title) section, 0.1% will be used for this value.
- max_people: The maximum amount of people present in the simulation. This is used to keep the simulation clear and not to cluttered with arrows.
- detection-chance: This is the chance a coughing person is detected by the system while moving from the spawn location at the left side of the screen to the detection station. When a person has passed the detection station he/she can not be detected anymore. In the model, this detection chance is multiplied by the chance a person coughs while walking towards the detection system. No specific data regarding the coughing frequency of a person with COVID-19 is available as of yet, therefore data for a person whith a chronic cough will be used. A person with a chronic cough will cough approximately 43 times per hour. [46] Combined with the detection range of the microphones and the average walking speed this gives a chance of 5.12% that a person coughs while walking towards the detection system.
- measurement-accuracy: This is the accuracy of the test conducted at the measurement station. This percentage determines the amount of people with symptoms that are turned away and the amount of healthy people that were randomly picked out and are allowed to enter.
- test-time: This variable is the amount of ticks it takes to test one person at the measurement station.
- random-pick-chance: As explained before, healthy people are randomly picked out by the system. This parameter represents the chance a healthy person is picked out while moving from the spawn location at the left of the screen to the detection station.
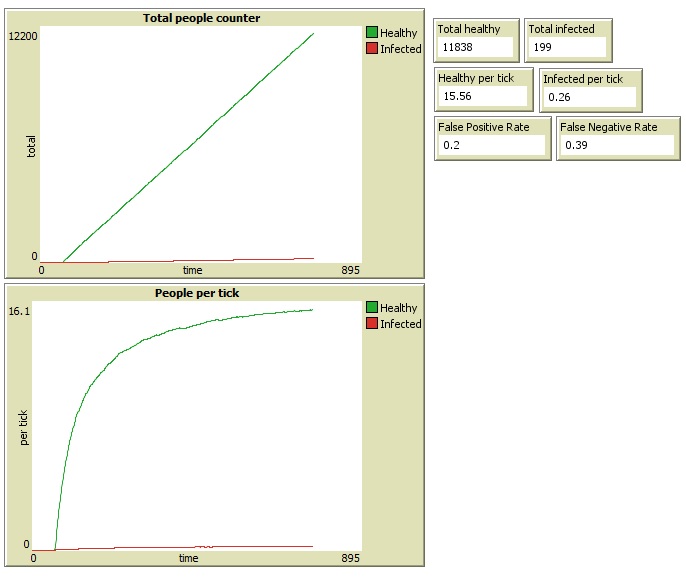
The output of the model is in the form of the visualization as shown above and in the form of graphs and numbers that are of interest, as can be seen in the figure on the right. These numbers/graphs represent the following:
- Graph Total people counter: A graph showing the total number of healthy and infected people that entered the Heuvel Galerie since the start of the simulation.
- Graph People per tick: A graph showing the number of healthy and infected people entering the Heuvel Galerie per tick (timestep).
- Total healthy: Number showing the total amount of healthy people that entered the Heuvel Galerie since the start of the simulation.
- Total infected: Number showing the total amount of infected people that entered the Heuvel Galerie since the start of the simulation.
- Healthy per tick: Number showing the amount of healthy people that enter the Heuvel Galerie per tick.
- Infected per tick: Number showing the amount of infected people that enter the Heuvel Galerie per tick.
- False Positive Rate: The false positive rate of the system. A false positive is when the system determines that a healthy person is infected. This rate is defined as the number of false positives divided by the actual number of negatives, which is equal to the sum of the false positives and the true negatives.
- False Negative Rate: The false negative rate of the system. A false negative is when the system determines that an infected person is healthy. This rate is defined as the number of false negatives divided by the actual number of positives, which is equal to the sum of the false negatives and the true positives.
Results
The Netlogo model is used to evaluate the system regarding its effectiveness in reducing the number of infected people entering the Heuvel Galerie. By varying the parameters described in the above section, the output of the model will change. First, the effect of varying the detection chance of the detection system and the measurement accuracy of the measurement station will be evaluated. Then the model will be used to evaluate if the RPC regarding the accuracy of the system is met.
Varying the detection chance
In the following figure, the number of infected people entering the Heuvel Galerie per tick (timestep) can be seen when the detection chance (which is the chance a coughing person is detected by the detection system) is varied for a fixed measurement accuracy. As explained in the (insert numbers section title) section, it is expected that the system will have a 7% false positive and false negative rate at the measurement station. Therefore, for this experiment a fixed measurement accuracy of 93% is used. The percentage of infected people is set to 0.1%.
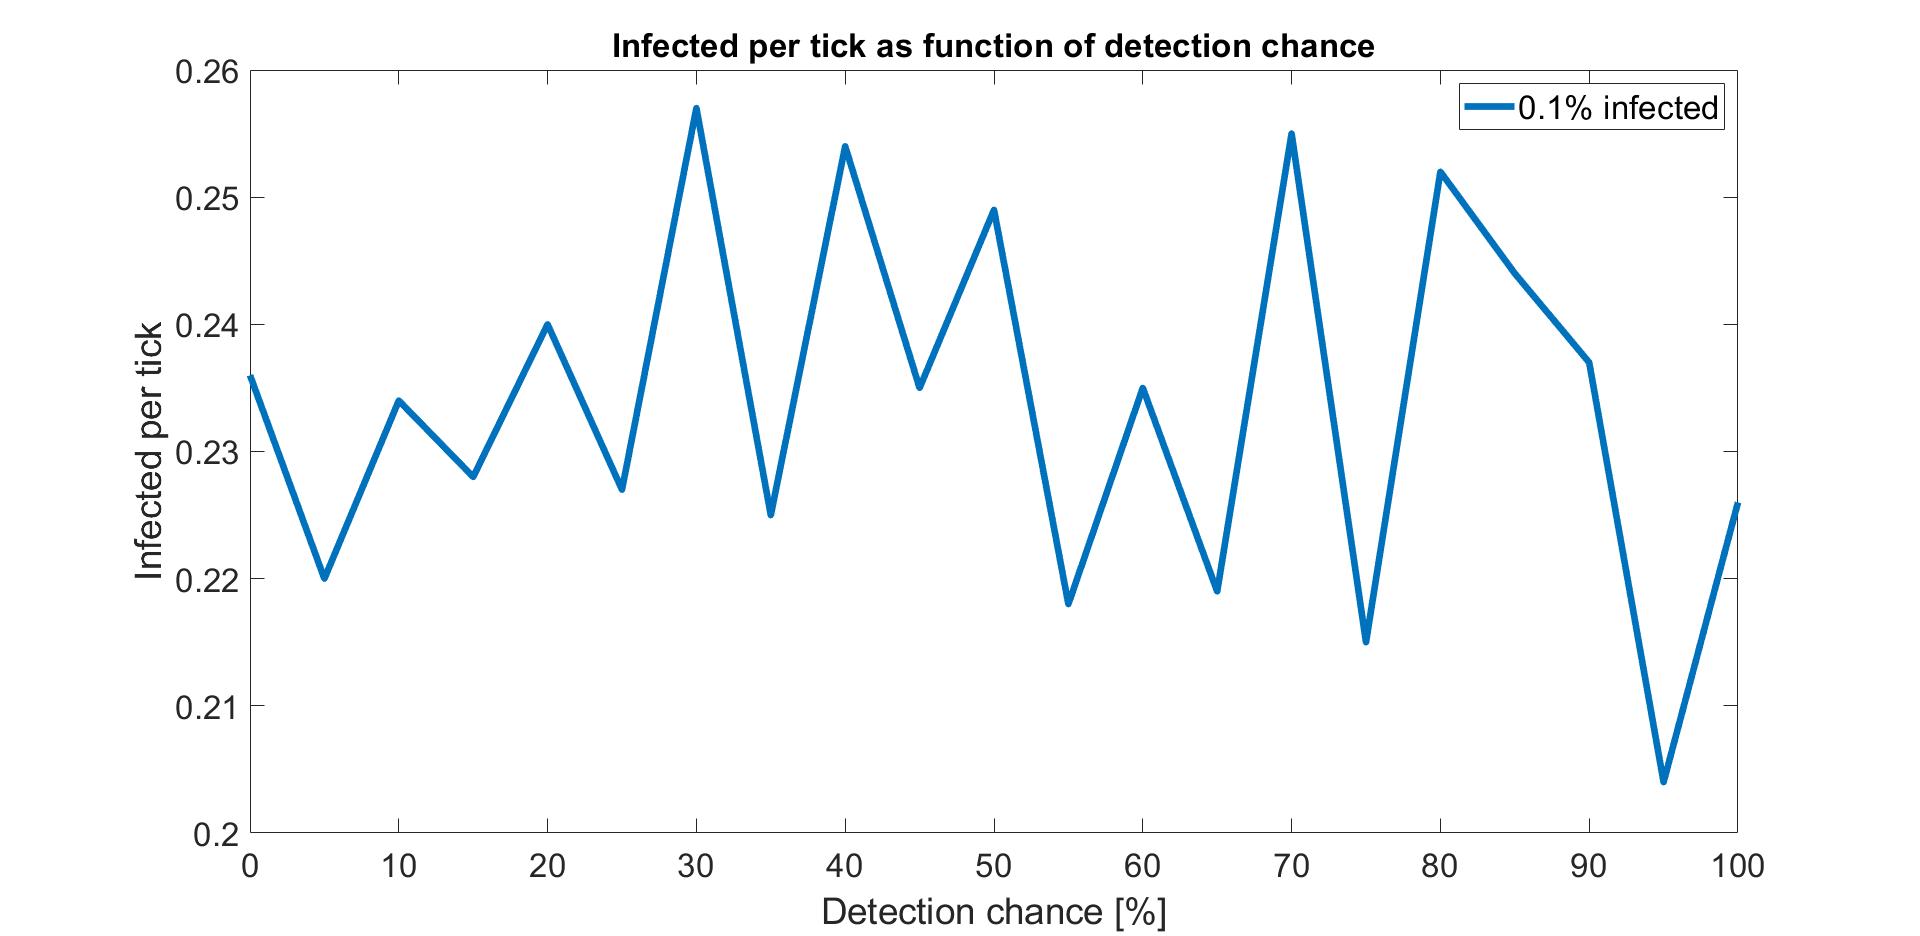
The data is collected after 3000 ticks, which is when the number of infected per tick was seen to have converged. At a 0% detection chance the system is basically turned off and at a 100% detection chance, everyone who coughs is detected. It can be seen that the there is no clear relation between the detection chance and the number of infected people entering the Heuvel Galerie per tick. This result seem to suggest that the system is not very effective for these parameters. This is probably due to the small amount of people being infected combined with the low chance that one of these people coughs while walking past the detection system.
When the percentage of infected people is increased, the result changes slightly, as can be seen in the following figure:
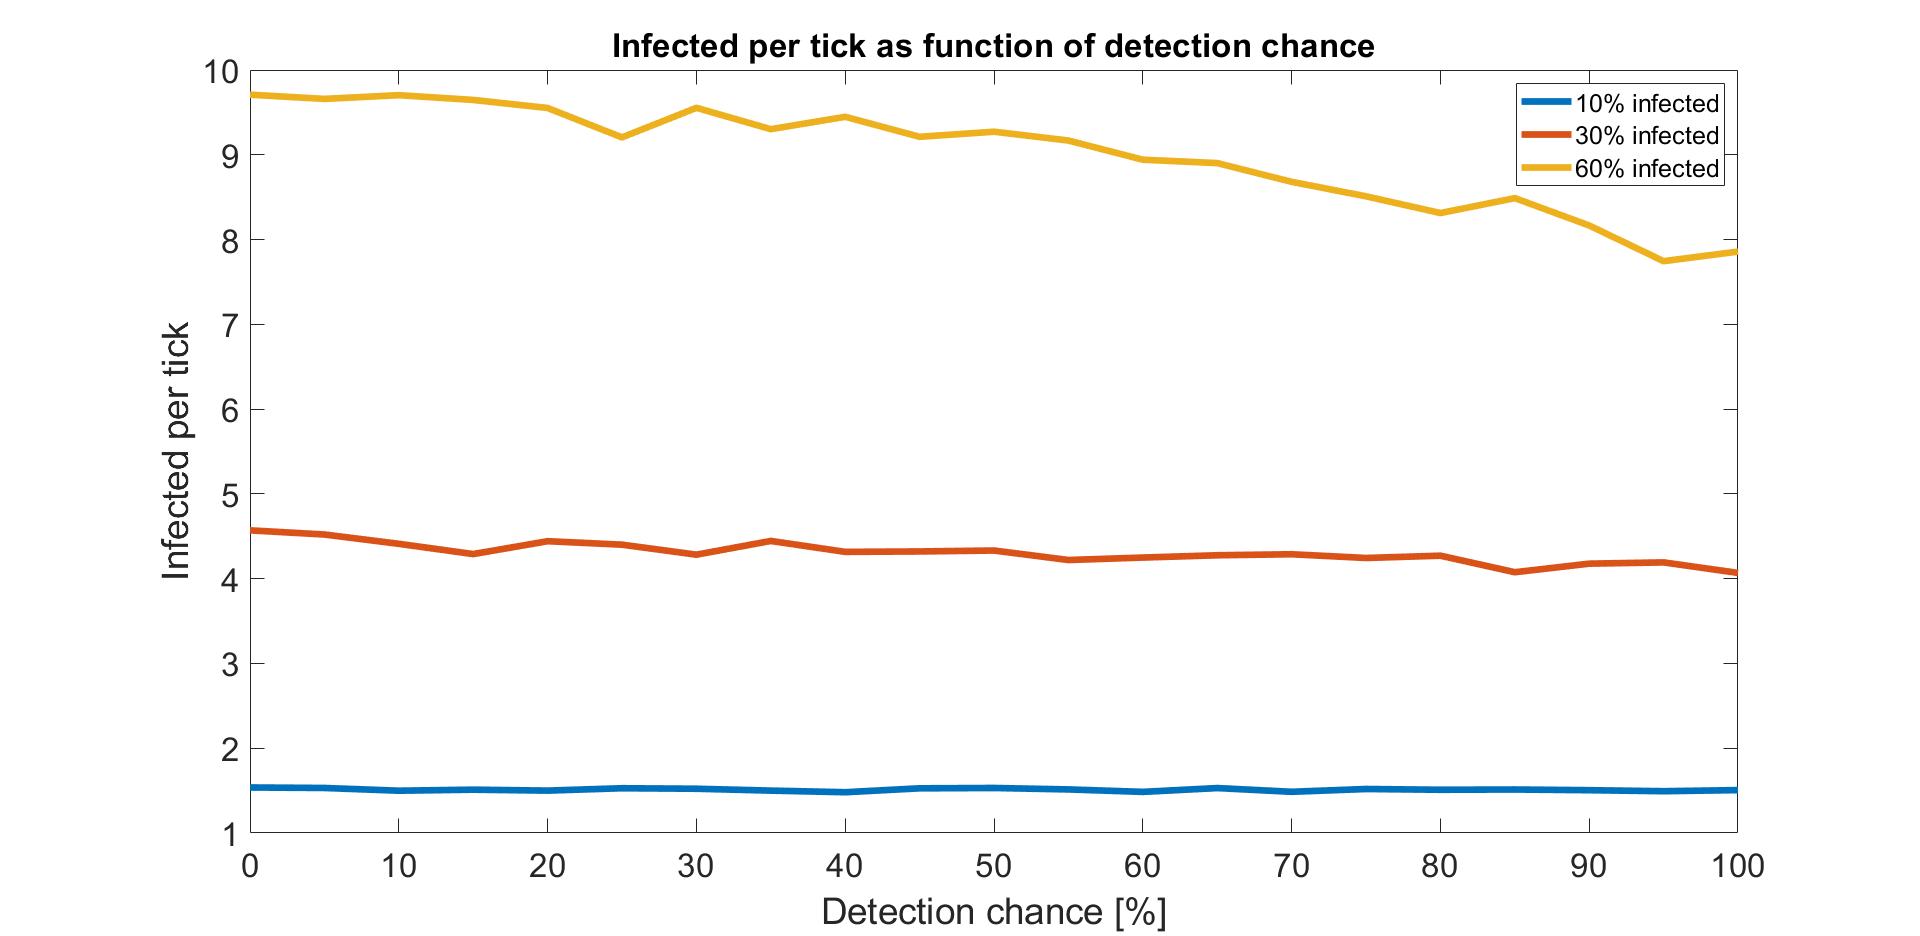
It can be seen that for higher percentages of infected people, for example the yellow line where 60% of the people are infected, the system is more effective: Now a small decrease in the number of infected people entering the Heuvel Galerie per tick can be seen.
Varying the measurement accuracy
In the following figure, the false positive and false negative rates can be seen when the measurement accuracy of the measurements station is varied for a fixed detection chance. The detection chance will be fixed at a value of 87% (see number section title).
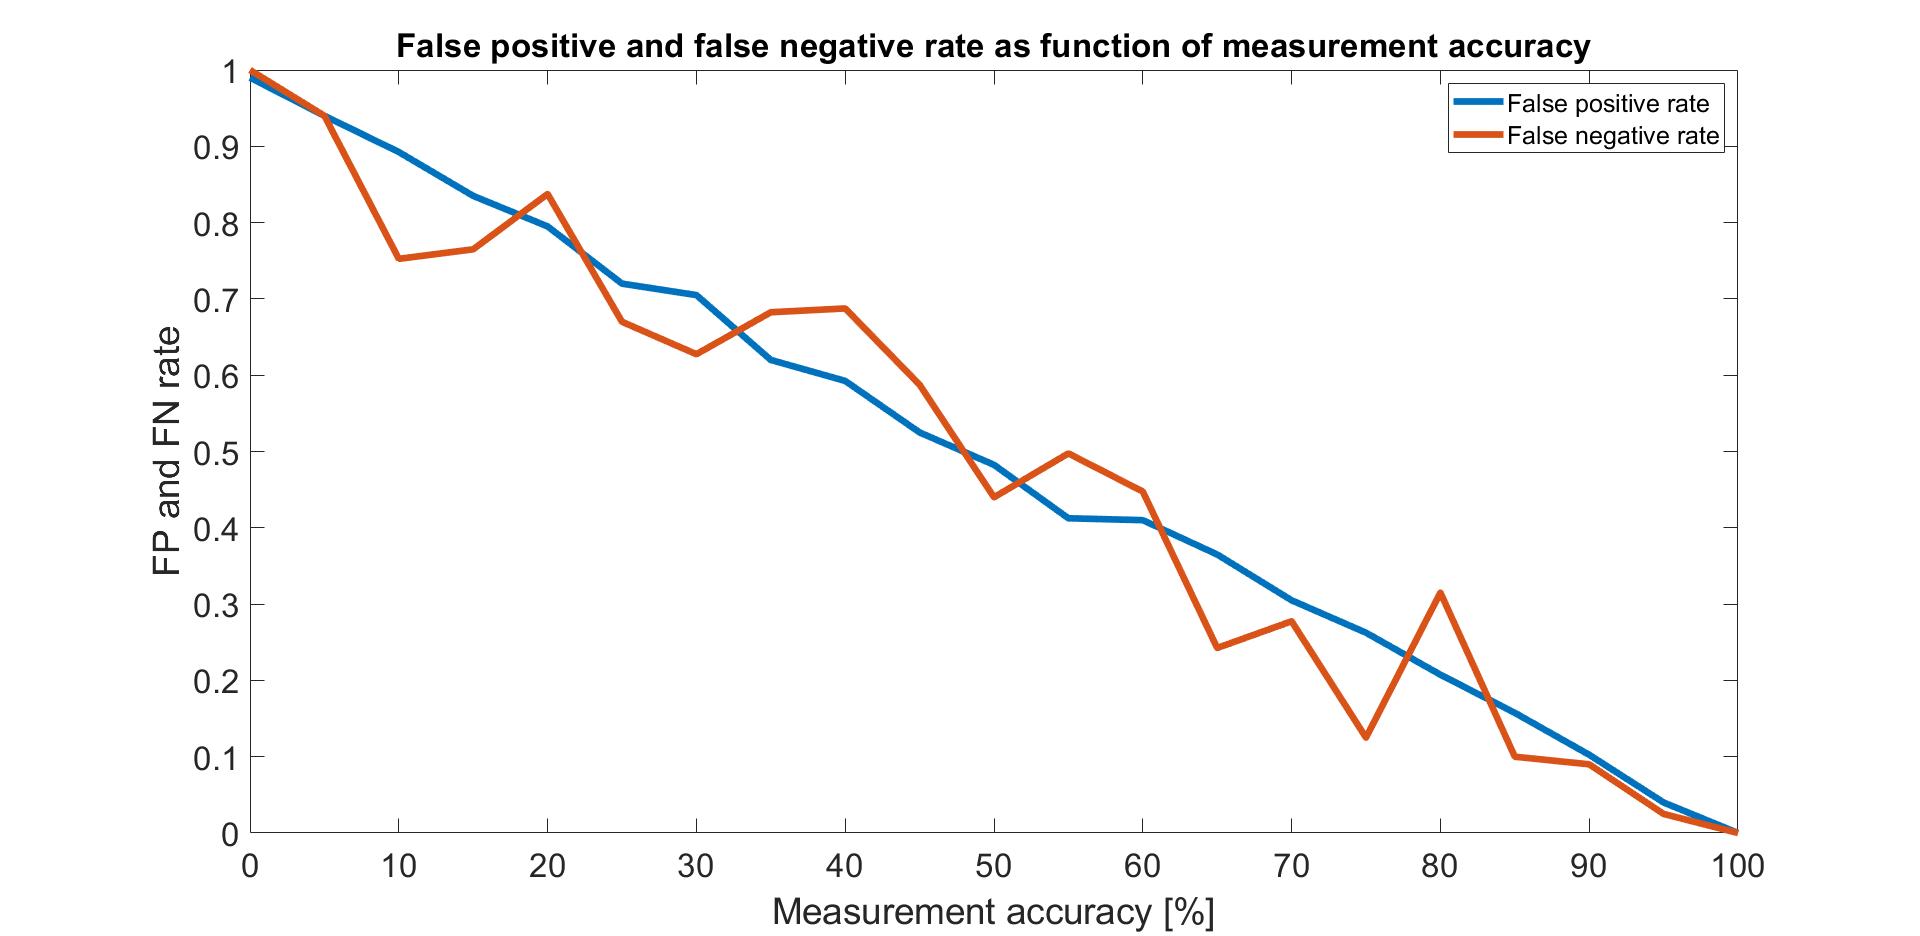
As to be expected, the false positive and false negative rate show an inverse linear relation to the measurement accuracy. It can be seen that the false negative line shows more fluctuation than the false positive line due the fact that there are less infected people than healthy people being tested because healthy people are also picked out randomly.
False positive and false negative requirement evaluation
One of the requirements for the system is to have less than 10% false positive and false negative rates. The Netlogo model is used to validate if this requirement is met. The expected values of 87% detection chance, 93% measurement accuracy and 0.1% infected people will be used. The results of running the simulation for 10000 ticks with these parameters can be seen in the following table:
| Run | FP rate | FN rate |
|---|---|---|
| 1 | 0.07 | 0.06 |
| 2 | 0.07 | 0.06 |
| 3 | 0.06 | 0.06 |
| 4 | 0.05 | 0.02 |
| 5 | 0.07 | 0.06 |
| 6 | 0.06 | 0 |
| 7 | 0.06 | 0 |
| 8 | 0.07 | 0.05 |
| 9 | 0.07 | 0.08 |
| 10 | 0.06 | 0.1 |
| Average | 0.064 | 0.049 |
From these results it can be seen that the average false positive rate is 6.4% and the average false negative rate is 4.9%. Therefore, it can be concluded that the requirement of having false positive and false negative rates of less than 10% is met when the expected detection chance of 87% and the measurement accuracy of 93% are achieved and 0.1% of the visitors are infected.
It is also interesting to look at the range of measurement accuracy and detection chance for which the requirement is met. The following figure shows the false positive and false negative rates as a function of the measurement accuracy and the detection chance:

From this plot it can be seen that the detection chance has no influence on the false positive and false negative rates, as is to be expected. Also, it can be seen that generally the requirement of having less than 10% false positive and false negative rates is achieved from a measurement accuracy of 90% and higher, as expected.
Cost-benefit analysis
Here, a cost-benefit analysis of the COVID-19 symptom detection system is performed.
(Comparing cost of system against expected benefit. Together with Netlogo model determine optimum system accuracy)
Costs over a two month period
- Costs of making the product
- €5500,- for the thermal camera
- €1000,- for the michrophone system
- €100,- for the microphone in the cabin
- €400,- for the camera on the pole
- €750,- for the camera pole
- €3000,- for the booth including the computer, software, screens and interfaces
- €200,- for the disinfecting UV-light
- Costs of personnel
Medical personnel:
€25,- per hour including employer charges, according to Edward Nijhuis who is a salary administrator at Administratiekantoor Boekel
Security guard:
€18 per hour including employer charges
10 people are needed at all time, one medical person and one security guard per entrance will add up to €24100,- for two months
-Maintanance costs
- Small maintenance every two weeks for €500,- for all 5 systems
- Large maintenance every two months for €2000,- for all 5 systems
This will add up to a total cost of €4000,- for two months
- Costs of potential client-loss for the shops in the Heuvelgalerie due to inconvenience
According to the questionnaires there are people that are not willing to go to the Heuvelgalerie because of the presence of the detection system. However, as discussed in the chapter about the questionnaire this outcome may not be completely reliable because the question was only asked once, to a small sample group, with only a very general explanation about the detection system. Therefore, from this data it is quite hard to pinpoint the exact number of client loss at the Heuvelgalerie.
In order to make an estimate about the client loss in the Heuvelgalerie, the outcome of the questionnaire with the shoppers, the questionnaire with the shopkeepers and the prior based on the feeling given by those talks and questionnaires will be taken into account. Based on this, an approximate loss of 5% of the clients at the Heuvelgalerie is expected. An approximate spending amount of €130,- per person will be used. We can estimate the loss of revenue by first calculating the average number of people in total entering the Heuvelgalerie at quiet, medium and busy hours. This number will be multiplied by the total number of quiet, medium and busy hours per week, based on the table from the Heuvelgalerie. Then this total number can be multiplied with the estimated percentage loss of people and the average spending per person. This comes down to a total of €808.860,- per week, which is €6.470.880,- per two months
- Costs for publicity of the system
To increase the pulic knowledge about the system in the Heuvelgalerie, a poster campaign will be held which would approximately cost €100,-, and advertising via omroep Brabant will be done, which is a local newssite, radio and telivision company. 90 commercials of 20 seconds on television, 60 commercials of 20 seconds on radio, and a month long coverage on the internet with a guaranteed 225.000 views cost €2.150,33 according to Anne-Marie van de Meulengraaf, who is an employee at Omroep Brabant.
For the costs of developing these three types of commercials a cost of €5000,- will be taken into account.
Benefits over a two month period
- Monetary gain due to potential increase in clients for the shop-owners in the Heuvelgalerie because of increased feeling of safety.
Similar to the costs of client loss due to inconvenience, this number is quite hard to estimate. Even more so because the questionnaires did not cover this target group. Because not much is known about this subject yet, an estimation of 1% increase in shoppers will be taken into account. The target group that will be gained this way will most likely be older. Older people are more likely to spend more according to the statistics we used to get our money spent per person, so an average of €150,- will be taken into account. Taking all this into account will bring the increase in revenue to €186.660,- per week, which is €1.493.280,- per two months.
- Decrease in healthcosts because of less spread of COVID-19 in the Heuvelgalerie
At the time of writing this report the Dutch reproduction number is 1.17[41]. This indicates that COVID-19 cases increase exponentially. Every case that can be informed and quarantined earlier has an effect on the state of the pandemic in the country. At the moment it is impossible to say how much difference a few people being sent away and made aware of their risk being sent away by the system will make. However, with the current reproduction number it is safe to say that every case that is made known early is worth a lot, even though no monetary value can be put on that yet.
-Macro-economic scale
At the time of writing this report, COVID-19 is at the start of its second peak. Many new measures are being taken, and a second lockdown is closer than ever. It is unknown how much of an impact this will have on the macroeconomic scale yet, but expert economics are not optimistic. Everything that can help the pandemic stay at a reasonable level is something that has unknown, but possibly very large effects on the macroeconomic scale.
Conclusion
For the Heuvelgalerie and the shops in the Heuvelgalerie, the system will probably cost more than the monetary benefit will be. However, when other stakeholders such as the local government, or even the government of the Netherlands are taken into account, the balance might definitely shift in favor of the system. This however is not yet certain, because it is hard to put monetary values on the prevention of the spread of COVID-19. Because the crisis is still very much ongoing at the time of writing this report, not much can be said about the possible economic downfall due to the crisis, or the long-term healthcosts of COVID-19 patients.
Evaluation questionnaire
At the end of the project, a final evaluation questionnaire was conducted. The aim of this questionnaire is to get feedback from potential users on the final design. This feedback could be used by teams doing further research on this type of system in the future. It was planned to do this final evaluation questionnaire at the Heuvel Galerie in order to get a representative group of potential users. However, due to the situation around COVID-19 in October 2020, it was deemed unsafe to approach people on the street. Since the final evaluation of the design among potential users is an important aspect in this project, an alternative had to be found. It was decided to make an online questionnaire and send it to friends and family living in or near Eindhoven. Because of this target group the age range of the participants is between 15 and 60 years old, although the most represented age group lies between 18 and 25 years old. In the end 23 responses were obtained.
The questionnaire starts with the following introduction of the system:
'This questionnaire will ask you several questions about your experiences and opinions of being in a shopping mall in times of COVID-19 and about our COVID-19 detection system.
The detection system is able to detect coughs via a microphone at the entrances of a shopping mall (specifically the Heuvel in Eindhoven). If a cough is detected, medical personnel will bring you to a test center. Here a temperature measurement and an additional cough test that tests for a COVID-specific cough will be taken. If one of those tests are failed the tested person can be sent away from the shopping mall. The pictures down below are designs of the detection pole and the measuring station.'
After this introduction, some of the CAD design renders from the final hardware design section are shown. The questionnaire itself consists of two closed questions and three open questions. The results of the questionnaire will be discussed below.
Closed questions
The two closed questions that were asked were:
- How likely are you to still go to a shopping mall if you are feeling a little bit unwell?
- How likely are you to still go to a shopping mall if you are feeling a little bit unwell if there would be a COVID-19 symptom detection system in place?
The first two questions are mostly interesting to see what the psychological effect would be of the presence of the detection system. It appears that most people are less likely to go to a shopping mall if they feel unwell and there is a detection system in place. Two respondents however mentioned they were a bit more likely to go to the shopping mall if there was a detection system in place. This difference could be explained by some people being more oppurtunistic than others, and going to the shopping mall just to be tested, while other people feel more self-consciouss about going to a shopping mall while sick, and choose to stay home instead. Of course, for the general safety of the masses, the last type of behaviour would be preferred. In the data it is very easy to see that most people are more likely to display this second type of behaviour, and a simple Chi-squared test shows with a p-value of 0.028 that this effect is indeed significant. A Cramérs V of 0.56 indicates that the intercorrelation between the two variables is also relatively high. The histograms below show the answers to the two questions, where 1 means very unlikely and 5 means very likely.


Open questions
The three open questions that were asked were:
- How much time are you willing to wait before entering a shopping mall because of security measures because of the symptom detection system?
- Are there any requirements that you would have for the system?
- Do you have any additional remarks?
Interesting answers were obtained. Some gave new insights, and some reinstated the user requirements obtained from the initial questionnaire that are already incorporated in the design.
For the first question people are asked about the time they are willing to wait before entering the shopping mall because of security measures. The mean of the indicated waiting time is 6.4 minutes, with a standard deviation of 4.7 minutes. The time people are willing to spend waiting differs greatly from person to person, but many people answered that they were willing to wait 5 minutes.
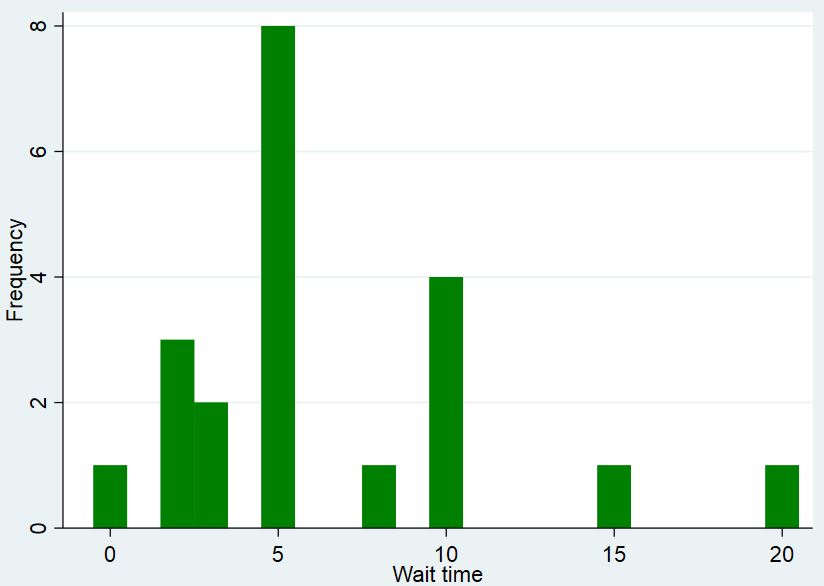
For the last two questions more qualitative answers were obtained. First off, privacy is seen as important. People want the system to be as discrete as possible and think no one should be able to see if the tested person has COVID-19 or not. Multiple people mentioned the term ‘Big Brother’ (a TV show in which a group of people lives in a house full of cameras and microphones). Fortunately, protecting the privacy is already taken into account as much as possible in the design.
It was mentioned a couple of times that it must be possible to deny the test in the measurement cabin and choose not to enter the Heuvel Galerie. This is already incorporated in the design; people are asked to do the second test and are not forced to do so. But still, this indicates that people do not want to be forced to do anything, they want to stay in control.
People think that detection only by means of a cough may not be that effective. It was mentioned that it is possible for people to hold in their cough till they pass the system. It was suggested to add the detection of more symptoms to the detection system.
Furthermore, the system should be fast and handle large amounts of people. It should not result in too much extra waiting time before one can enter the Heuvel Galerie. This is similar to the RPC which states that the system should not cause excessive hindrance.
Also, hygiene and safety is mentioned to be important, the system should be disinfected regularly. This requirement is already incorporated in the design through the UV-disinfection light.
Besides these points, people also mention they think the system is a good idea can be really useful.
Conclusion
Here, an overal conclusion on the project is drawn.
Conclusion
The aim of the project was to perform a feasibility study on a system which detects COVID-19 symptoms in crowded places. The chosen case scenario was the Heuvel Galerie in Eindhoven. The users were selected. From the selected users a preliminary requirements list was made. To confirm these assumptions a survey was made. The survey was aimed at two types of users of the Heuvel Galerie, the shoppers and the shop owners. From the survey it was discovered that a mass detection system was preferred and that discretion when treating potentially infected people was essential. Further requirements were suggested. Hindrance by the system should be minimal, detection levels with a 10% sensitivity and specificity, and privacy of the users should be respected. In response to the requirements list further research was conducted. A study of similar systems available on the market was done. A study on Privacy issues was done. And the legality of conducting tests on people was further researched.
Design
With the information gathered the design process of the system started. First the study on the legality of tests authorized performing tests on the users at some conditions. The conditions were that all measurements were anonymous and that data which could be used to trace a person’s identity was not stored. It was also found that the Heuvel Galerie had every right to deny access to people not passing tests. Furthermore, some industries were, at that moment, already performing temperature measurements on their employees. From the requirements visibility of the system was brought as an important point. Visibility and transparency of the operation of the system would help users to comply willingly. Therefore, several posters were drawn for different types of users, high-self-monitoring people and low-self-monitoring people. The study on similar systems showed that performing thermographic measurements on crowds was useless. Therefore, thermographic measurements must be conducted on a single individual. Since a mass detection system was a user requirement a second measuring technique was used. A cough detection system was chosen as the mass detection option. The cough detection system is mounted on a pole which is placed within the flow of people. The users selected by the mass detection system would be subjected to two more tests. A secondary measurement station was designed to perform the two more tests. The design of the secondary station took into consideration the aspects of privacy and security. To protect the privacy of the users a closed cabin was designed. Also, the closed cabin design complied with the requirement of security. After each measurement, the cabin is disinfected by UV lights mounted on the cabin’s ceiling. The users addressed that hindrance of the system should be minimal. Minimal hindrance was already taken as a requirement during the design of the two measurement structures. The pole was designed with a small footprint to reduce obstructing people’s flow. The placement of the two measurement stations in a given space also influences hindrance. Therefore, a layout design which minimalizes hindrance was provided, by placing all measurement stations outside of the entrance.
Simulations
Two simulations were made to assess the performance of the system. The first simulation was done to assess if the system was able to meet its high accuracy requirements given the systems parameters. The requirement for the system was to have less than 10% false positives and false negatives. The expected system parameters were found through research and were an 87% detection chance, and a 93% measurement accuracy. With the given parameters the system met its accuracy requirement by achieving a false positive rate of 6.4% and a false negative rate of 4.9%. Furthermore, the simulation proved to decrease the number of infectious people entering the Heuvel Galerie, but only for a high percentage of infected people. The second simulation was made to optimize the flow of people in the queue, waiting to take the second measurement. The results showed that with the same set of parameters used in the first simulation the average waiting time was 7 minutes. With such a low waiting time a secondary measurement station was not necessary.
Finally, a cost benefit analysis combined with a final evaluation survey were made in order to assess the feasibility of the system. The hardware components of the system were quite expensive, amounting to an expected initial cost of €10950. Furthermore, the combined operating and maintenance costs for two months were calculated to add up to €28100.Furthermore, an analysis of potential client loss was made based on the results from the first user survey. The monetary loss from decrease in clients was estimated to be around €6.4 million for two months. Also costs for the advertising campaign to raise awareness of the system would amount to €5000. While benefits hardly outweigh costs. The estimated monetary gain from increase in customers was calculated to be only €1.4 million. Also, the potential positive impact on macro-economic scale is not quantitatively measurable. The cost benefit analysis proved that the system had a high price tag. And the costs did not outweigh the benefits. Furthermore, the design did have some shortcomings. First the symptom detection for the mass detection part is quite ineffective. The selected symptom was cough and cough can be voluntarily controlled. Therefore, a user could control to hold their cough until they were out of the measurement area. Because of a small number in participants different requirements could be discovered. And many systems on which the project was based were still in research phase. All these factors greatly reduced the effectiveness of the whole system. Therefore, at the current state the designed system was not viable because of too high costs and not enough tangible benefits. Nevertheless, as discussed in the Recommendations section some parts of the design could be improved to make the design viable. For example, the results of the survey could be improved by adding further questions and reaching more user types. Also, with future research conducted on the SARS-COVID-2 more helpful information on the disease could be found. Ideally this information could lead to a better detection method.
Discussion
In this project a procedure to limit the spread of corona is proposed by not letting infected people enter the Heuvel Galerie if they are infected with corona. To get to this procedure several steps were taken:
- A preliminary questionnaire was conducted to find RPC’s
- Research about privacy issues and regulations was conducted
- Research about similar systems was conducted
- A design was made
- Simulations were made
- Pseudocode was made
- A cost benefit analysis was done
- A feasibility study was done
- A final questionnaire was made
During the project there was also an intermediate questionnaire planned, however due to Corona regulations it became impossible to get adequate responses which led to it not being executed.
Preliminary questionnaire
The preliminary questionnaire was done by going to the Heuvel Galerie and asking people the questions. Restrictions for this questionnaire were that not a lot of questions could be asked as to have people answer the question in times of Covid-19. If a lot of questions were asked people would just walk away. This results in not being able to repeat questions in different ways to eliminate incorrect answers. Furthermore it would have been better to ask the questionnaire to more people to get more accurate answers. This was not possible because of the limited time in the project and could be taken into account for future projects about the same topic. The thought about putting the questionnaire on the internet was also put up in our discussions, it was however impossible to find a representative group to answer the questions without giving people money to fill it in.
Privacy issues and regulations
In our design there could be less invasion of privacy, however this would cost a lot of money. This in turn makes it impossible to accomplish since the device would not be used otherwise. On the other hand, all the rules around the privacy of the device are taken into account, which makes the procedure legal.
Similar systems
For the similar systems part, more systems could have been taken into account to get to our final design. Here once again due to time restriction not more was done about this and can be a topic that can be researched further on.
Design
The reason why our design uses a camera and microphones to detect people that are coughing is because a guard can not be alert the entire time, a machine on the other hand can. The design takes into account most of the RPC’s, this could however unfortunately only be tested in simulations due to only designing and not actually making the machines in the procedure. A worry about the design will be that it is easy for people to pass by the device by just holding in their cough. This is however a point we were not able to improve during our study.
Simulations
The simulations verify if our design satisfies our RPC’s. The Netlogo model tests how much the procedure does towards preventing people with Covid-19 to enter. The Matlab model verifies how long people need to queue with a different amount of measurement stations, and so how much hindrance people will have due to the procedure. Neither of the simulations take into account the people that decide not to go to the measurement station but go home instead since it was seen from the preliminary questionnaire that nearly everyone picked out by the system would go for the secondary tests. Something else that might be improved for the simulations is that the constants used for the simulations like the number of people entering during certain times, the number of infected people entering the Heuvel Galerie etc. might not be the most accurate numbers due to a lack of time in being able to investigate these numbers. From the Netlogo model it is shown that the RPC of false positives and false negatives is accomplished. From the Matlab model it can be seen that people will not have to wait for long and that the queues are empty most of the time due to the low chance that someone coughs near the measurement device.
Pseudocode
The pseudocode was put in to explain what the system is doing. It would have been preferable if a real working code was made, however with the restrictions in time this was not feasible to be done in this project. So this is another point that could be researched more in the future
Cost benefit
The cost of everything needed in the procedure is quite high. This is mainly due to the thermal camera in the measurement station.
Final questionnaire
The final questionnaire could not be done in a representative group due to stricter measures around the Corona. This left us with sending the final questionnaire to friends and family resulting in a biased results of the questionnaire.
Recommendations
For a future study on a COVID-19 symptom detection system the following recommendations are made:
- Obtain more data on COVID-19. COVID-19 is still a relatively new disease and because of this it was encountered that some data regarding the virus and it's symptoms is not yet known. An example of this is the frequency with which a person infected with COVID-19 coughs. It is expected that this type of data will become available over time as the virus is researched but it could also be possible to try to obtain the required data by performing own experiments.
- Research other detection options. It could be that when COVID-19 and it's symptoms are better understood, more effective symptom detection options can be used. This was also mentioned by potential users in the final evaluation questionnaire.
- Obtain more feedback from the different user groups. As mentioned in the discussion, due to the current situation regarding COVID-19, it was not possible to conduct any more real-life questionnaires on the street. In a future study, it can be really valuable to show the proposed design to shoppers and shop owners at the Heuvel Galerie and get their feedback on the system. Also, there is one group of users, namely the people that used to shop in the city and now shop in the quieter villages instead, which could not be contacted due to the COVID-19 situation. It was planned to visit villages and conduct real-life questionnaires. The requirements and needs of this group are also important to take into consideration. Some tips on how to conduct a good questionnaire and obtain useful results are given in Questionnaire among shopping people.
- Adjust the design based on additional user requirements or detection options. It could be that when above mentioned questionnaires and research are conducted, new requirements for the design or new detection options are discovered.
- When the design is deemed to be finished, the system can be build. If the system has been built, thorough testing of all components and testing of the total system should take place. It is best to perform the initial tests in a closed-off experimental environment before testing the system in a public setting.
Peer review
Here, the peer review is given.
Workload
An overview of who has done what per week of the project.
Week 1
| Name | Student ID | Hours this week | Tasks |
|---|---|---|---|
| Davide Fabbro | 1255401 | 9 | Intro videos + first brainstorm (1.5 hours) + Studied and wrote summaries for papers: [6], [7], [17], [16], [28], [29], [30] (6 hours) with small research on [31], [32] (0.2 hours) + second meeting (0.5) + Reorganizing state of the art section (1 hour). |
| Lieke Nijhuis | 0943276 | 12 | Intro videos + first brainstorm (1.5 hours) + Studied and wrote summaries for papers: [27], [21], [8], [12], [10], [11], [9] (6.5 hours) second meeting+ sending e-mail (45 minutes) + Describing problem statement and objectives (15 minutes) + Miscellaneous work (3 hours) |
| Ikira Wortel | 1334336 | 10 | Intro videos + first brainstorm (1.5 hours) + Studied and wrote summaries for papers [5], [19], [20], [14], [15], [13]and [18](7 hours) + extra meeting discussing chosen subject (0.5 hour) + Who are the users (1 hour) |
| Wout Opdam | 1241084 | 12.5 | Intro videos + first brainstorm (1.5 hours) + Start with wiki layout (1 hour) + Studied and wrote summaries for papers: [22], [23], [24],[25] and [26] (5 hours) + wrote about approach and deliverables (0.5 hour) + Made planning for project (2.5 hours) + extra meeting discussing chosen subject (0.5 hour) + Describing user requirements (1.5 hours) |
Week 2
| Name | Student ID | Hours this week | Tasks |
|---|---|---|---|
| Davide Fabbro | 1255401 | 5.5 | Tutor feedback meeting (0.5 hour) + Group meeting (1 hour) + Rewrite focus on COVID-19 symptom detection (0.25 hour) + Research Thermal cameras and grid(4 hour) |
| Lieke Nijhuis | 0943276 | 10 | Tutor feedback meeting (0.5 hour) + Group meeting (1 hour) + Research and write "what happens after testing" (0.5 hour) + Research psychological effects detections center (5 hours) + Detection systems explanation (30 minutes)+ Extra group meeting (0.5 hour) + Miscellaneous work (2 hours) |
| Ikira Wortel | 1334336 | 10 | Tutor feedback meeting (0.5 hour) + Group meeting (1 hour) + Redefine USE'ers (1 hour)+ Extra group meeting (0.5 hour) + questionnaire questions privacy (2 hours) + Reading and finding papers about privacy (5 hours) |
| Wout Opdam | 1241084 | 7.5 | Tutor feedback meeting (0.5 hour) + Group meeting (1 hour) + Revised project planning (1.5 hours) + Re-designed wiki layout (1 hour) + Describe use case Heuvel Galerie and learn wiki page formatting (1.5 hours) + Redefine USE'er requirements (1.5 hours) + Extra group meeting (0.5 hour) |
Week 3
| Name | Student ID | Hours this week | Tasks |
|---|---|---|---|
| Davide Fabbro | 1255401 | 9 | Tutor feedback meeting (0.5 hour) + Group meeting ( 1.5 hours) + Research on similar systems (3 hours)+ Research on convetional security checkpoints (1 hour) + Miscellaneous (3 hours) |
| Lieke Nijhuis | 0943276 | 12 | Tutor feedback meeting (0.5 hour) + Group meeting ( 1.5 hours) + Setting up e-mail for shopowners in the Heuvelgalerie (0.5 hours) + Finding contactinfo of and mailing to 17 shopowners in the Heuvelgalerie (1 hour) + Interviewing shoppers Heuvelgalerie (2 hours) + Designing posters (3 hours) + Extra meeting (0.5 hours) + Miscellaneous work (3 hours) |
| Ikira Wortel | 1334336 | 19 | Tutor feedback meeting (0.5 hour) + Group meeting ( 1.5 hours) + making questionnaire (1.5 hours) + interviewing shoppers Heuvel Galerie (2 hours) + Extra meeting (0.5 hours) + Working on privacy part(8 hours) + Working on matlab model (3 hours) + Miscellaneous work (2 hour) |
| Wout Opdam | 1241084 | 16 | Tutor feedback meeting (0.5 hours) + Group meeting ( 1.5 hours) + Adjusting planning (1 hour) + Miscellaneous work (0.5 hours) + Research legal side of measurements at Heuvel Galerie entrance (2 hours) + Making initial design concept sketches (2 hours) + Work on Netlogo simulation model (7.5 hours) + Extra group meeting (0.5 hours) + Update user requirements and RPC's based on questionnaire (0.5 hours) |
Week 4
| Name | Student ID | Hours this week | Tasks |
|---|---|---|---|
| Davide Fabbro | 1255401 | 6.5 | Tutor feedback meeting (0.5 hours) + Group meeting (1 hour) + Thermal imaging (2 hours) + research on far field voice recognition (2hours) + Measurement of heuvel galerie (1hour) |
| Lieke Nijhuis | 0943276 | 17 | Tutor feedback meeting (0.5 hours) + Group meeting (1 hour) + Updating questionnaire part (2 hours) + Finishing poster design and update wiki (2 hours) + Interviewing shopping personnel and updating wiki (5 hours) + Researching disinfection methods (2 hours) + Finishing research on psychological effects (0.5 hours) + Extra group meeting (0.5 hours) + Starting on cost-benefit analysis (1 hour) + Adjusting user requirements according to survey (0.5 hours) + Misc (2 hours) |
| Ikira Wortel | 1334336 | 17 | Tutor feedback meeting (0.5 hours) + Group meeting (1 hour) + Working on matlab model(9 hours) + Extra group meeting (0.5 hours) + Writing pseudo code(2 hours) + questionnaire workout (2 hours) + miscellaneous (2 hours) |
| Wout Opdam | 1241084 | 19.5 | Tutor feedback meeting (0.5 hours) + Group meeting (1 hour) + Update planning (1 hour) + Finalize sketches of measurement station and detection system (1 hour) + Finish Netlogo simulation (6 hours) + Make CAD design of detection system (3 hours) + Make CAD design of measurement station (4 hours) + Miscellaneous work (0.5 hours) + Update user requirements and RPCs based on shop owner questionnaire (0.5 hours) + Extra group meeting (0.5 hours) + Wiki page formatting and creating second page (1.5 hours) |
Week 5
| Name | Student ID | Hours this week | Tasks |
|---|---|---|---|
| Davide Fabbro | 1255401 | 15 | Tutor feedback meeting (1 hour) + Extra group meeting (1 hour) + Researched numbers for RPC's (2.5 hours) + Extra group meeting (1.5 hours) + Counting visitors at the Heuvelgalerie (1 hour) + Drawing Design Layout (6 hours) + Researching permits (1 hour) + Describing design layout (2 hours) |
| Lieke Nijhuis | 0943276 | 13.5 | Tutor feedback meeting (1 hour) + Extra group meeting (1 hour) + Miscellaneous work (1 hour) + Researched numbers for RPC's (2 hours) + Extra group meeting (1.5 hours) + Miscellaneous (0.5 hours) + Counting visitors at the Heuvelgalerie (1 hour) + explaining decisions made around questionnaires (0.5 hours) + Statistical analysis questoinnaire and discussion of results (3 hours) + Miscellaneous (2 hours) |
| Ikira Wortel | 1334336 | 15 | Tutor feedback meeting (1 hour) + Extra group meeting (1 hour) + Researched numbers for RPC's (2 hours) + Extra group meeting (1.5 hours) + Counting visitors at the Heuvelgalerie (1 hour) + Extra group meeting (0.5 hours) + matlab model (3 hours) + Miscellaneous work (1 hour) + making a page for the numbers and adding to the RPC (2 hours) + Pseudocode (2 hour) |
| Wout Opdam | 1241084 | 34.25 | Tutor feedback meeting (1 hour) + Extra group meeting (1 hour) + Miscellaneous work (0.75 hours) + Update planning (0.5 hours) + Added false-positive and false-negative rates to Netlogo model (1 hour) + Netlogo bug fixing (1 hour) + Researched numbers for RPCs (1 hour) + Describe workings of Netlogo model on wiki (3 hours) + Make CAD design of human walking and standing (3 hours) + NX rendering tutorial (1 hour) + Extra group meeting (1.5 hours) + Counting visitors at Heuvel Galerie quiet time (1 hour) + Make CAD design of Heuvel Galerie entrance (7.5 hours) + Finalize CAD designs of measurement station and detection system (3.5 hours) + CAD coloring and rendering (4.5 hours) + Add CAD designs and description of design choices to wiki (1.5 hours) + Extra group meeting (0.5 hours) + Counting visitors at Heuvel Galerie busy time (1 hour) |
Week 6
| Name | Student ID | Hours this week | Tasks |
|---|---|---|---|
| Davide Fabbro | 1255401 | ||
| Lieke Nijhuis | 0943276 | 15 | Tutor feedback meeting (0.5 hours) + Extra group meeting (1 hour) + Making a new questionnaire (2 hours) + Miscellaneous (1 hour) + Finish Cost-Benefit analysis (3 hours) + Start on presentation (1 hour)+ Extra meeting (0.5 hours) + Statistical analysis (2 hours) + Extra meeting (0.5 hours) + Make a comic (1 hour) + Miscellaneous (0.5 hours) + Starting a new presentation draft (2 hours) |
| Ikira Wortel | 1334336 | 14.5 | Tutor feedback meeting (0.5 hours) + Extra group meeting (1 hour) + Extra group meeting(0.5 hours) + Finish pseudocode and description of the procedure (2 hours) + Extra group meeting(0.5 hours) + write discussion (4 hours) + fix matlab simulation (5 hours) + Miscellenious(1 hour) |
| Wout Opdam | 1241084 | 15.5 | Tutor feedback meeting (0.5 hours) + Extra group meeting (1 hour) + Update planning (0.5 hours) + Miscellaneous work (0.5 hours) + Calculating cough chance (0.5 hours) + Obtain Netlogo simulation results and describe on wiki (6.5 hours) + Write recommendation (1 hour) + Read through wiki, make adjustments, adjust layout (2 hours) + Extra group meeting (0.5 hours) + Describe results open questions final evaluation questionnaire (1.5 hours) + Extra group meeting (0.5 hours) + Draw comic about testing procedure (0.5 hours) |
Week 7
| Name | Student ID | Hours this week | Tasks |
|---|---|---|---|
| Davide Fabbro | 1255401 | Tutor meeting (0.5 hours) | |
| Lieke Nijhuis | 0943276 | Tutor meeting (0.5 hours) + Group meeting (1 hour) + Miscellaneous (0.5 hours) + Redo Cost-Benefit analysis (1 hour) + Redo analysis of evaluation questionnaire (1 hour) + Updating powerpoint (2 hours) + Researching video software (3 hours) + Filming and editing (2 hours) | |
| Ikira Wortel | 1334336 | Tutor meeting (0.5 hours) | |
| Wout Opdam | 1241084 | Tutor meeting (0.5 hours) + Group meeting (1 hour) + Netlogo FP/FN rate requirement simulation for varying detection chance and measurement accuracy (4 hours) + Read through wiki adjusting spelling and layout (2 hours) + Miscellaneous (0.5 hours) |
*Miscellaneous work: reading, brainstorming, discussing things in Whatsapp group, adjusting wiki after comments from tutor etc.
References
- ↑ Coronavirus disease (COVID-19) – World Health Organization. (2020). WHO. https://www.who.int/emergencies/diseases/novel-coronavirus-2019.
- ↑ [1] Bookelaar, N. (2015). Ingang van winkelcentrum Heuvel Eindhoven aan de westzijde van het gebouw.
- ↑ [2] Healy. Baker. (2001). Where People Shop. Commascon 2001
- ↑ [3] Heuvel Eindhoven. Heuvel Eindhoven Drukteprofiel.
- ↑ 5.0 5.1 [4] Imran, A., Posokhova, I., Qureshi, H. N., Masood, U., Riaz, S., Ali, K., John, C. N., Hussain, I., & Nabeel, M. (2020). AI4COVID-19: AI enabled preliminary diagnosis for COVID-19 from cough samples via an app. Informatics in Medicine Unlocked, 20, 100378.
- ↑ 6.0 6.1 [5] Brown, C., Chauhan, J., Grammenos, A., Han, J., Hasthanasombat, A., Spathis, D., Xia, T., Cicuta, P., & Mascolo, C. (2020). Exploring Automatic Diagnosis of COVID-19 from Crowdsourced Respiratory Sound Data. 3474–3484.
- ↑ 7.0 7.1 [6] Chung, K. F., Bolser, D., Davenport, P., Fontana, G., Morice, A., & Widdicombe, J. (2009). Semantics and types of cough. Pulmonary Pharmacology and Therapeutics, 22(2), 139–142.
- ↑ 8.0 8.1 [7] Gostic, K. M., Gomez, A. C. R., Mummah, R. O., Kucharski, A. J., & Lloyd-Smith, J. O. (2020). Estimated effectiveness of symptom and risk screening to prevent the spread of COVID-19. ELife, 9.
- ↑ 9.0 9.1 [8] Menni, C., Valdes, A. M., Freidin, M. B., Sudre, C. H., Nguyen, L. H., Drew, D. A., Ganesh, S., Varsavsky, T., Cardoso, M. J., El-Sayed Moustafa, J. S., Visconti, A., Hysi, P., Bowyer, R. C. E., Mangino, M., Falchi, M., Wolf, J., Ourselin, S., Chan, A. T., Steves, C. J., & Spector, T. D. (2020). Real-time tracking of self-reported symptoms to predict potential COVID-19. Nature Medicine, 26(7), 1037–1040.
- ↑ 10.0 10.1 [9] Gandhi, M., Yokoe, D. S., & Havlir, D. V. (2020). Asymptomatic transmission, the achilles’ heel of current strategies to control Covid-19. In New England Journal of Medicine (Vol. 382, Issue 22, pp. 2158–2160). Massachussetts Medical Society.
- ↑ 11.0 11.1 [10] Lerner, A., Chrysanthou, Y., & Lischinski, D. (2007). Crowds by example. Computer Graphics Forum, 26(3), 655–664.
- ↑ 12.0 12.1 [11] Udugama, B., Kadhiresan, P., Kozlowski, H. N., Malekjahani, A., Osborne, M., Li, V. Y. C., Chen, H., Mubareka, S., Gubbay, J. B., & Chan, W. C. W. (2020). Diagnosing COVID-19: The Disease and Tools for Detection. In ACS nano (Vol. 14, Issue 4, pp. 3822–3835). NLM (Medline).
- ↑ 13.0 13.1 [12] Pokhrel, P., Hu, C., & Mao, H. (2020). Detecting the Coronavirus (COVID-19). ACS Sensors, 5, 2283–2296.
- ↑ 14.0 14.1 [13] Fletcher, T., Whittam, A., Simpson, R., & Machin, G. (2018). Comparison of non-contact infrared skin thermometers. Journal of Medical Engineering and Technology, 42(2), 65–71.
- ↑ 15.0 15.1 [14] Tay, M. R., Low, Y. L., Zhao, X., Cook, A. R., & Lee, V. J. (2015). Comparison of Infrared Thermal Detection Systems for mass fever screening in a tropical healthcare setting. Public Health, 129(11), 1471–1478.
- ↑ 16.0 16.1 [15] Crowd temp screening is a joke, one tech expert says | FierceElectronics. (n.d.). Retrieved September 4, 2020, from Webarticle
- ↑ 17.0 17.1 [16] Pereira, C. B., Yu, X., Czaplik, M., Rossaint, R., Blazek, V., & Leonhardt, S. (2015). Remote monitoring of breathing dynamics using infrared thermography. Biomedical Optics Express, 6(11), 4378.
- ↑ 18.0 18.1 18.2 [17] Winkler, T., & Rinner, B. (2010). A systematic approach towards user-centric privacy and security for smart camera networks. ICDSC - 4th ACM/IEEE International Conference on Distributed Smart Cameras, 133–141.
- ↑ 19.0 19.1 [18] Apthorpe, N., Reisman, D., & Feamster, N. (2017). A Smart Home is No Castle: Privacy Vulnerabilities of Encrypted IoT Traffic.
- ↑ 20.0 20.1 [19] Offermann-Van Heek, J., Arning, K., & Ziefle, M. (2019). All Eyes on You! Impact of Location, Camera Type, and Privacy-Security-Trade-off on the Acceptance of Surveillance Technologies. Communications in Computer and Information Science, 921, 131–149.
- ↑ 21.0 21.1 21.2 [20] Ackerman, E. (n.d.). Autonomous Robots Are Helping Kill Coronavirus in Hospitals - IEEE Spectrum. Retrieved September 6, 2020.
- ↑ 22.0 22.1 [21] Davies, N. (2016). Can robots handle your healthcare? Engineering and Technology, 11(9), 58–61.
- ↑ 23.0 23.1 [22] Nichol, P. B. How medical robots will change healthcare | CIO. Retrieved September 5, 2020.
- ↑ 24.0 24.1 [23] Broadbent, E., Stafford, R., & MacDonald, B. (2009). Acceptance of healthcare robots for the older population: Review and future directions. In International Journal of Social Robotics (Vol. 1, Issue 4, pp. 319–330). Springer.
- ↑ 25.0 25.1 [24] Beasley, R. A. (2012). Medical Robots: Current Systems and Research Directions. Journal of Robotics, 2012, 1–14.
- ↑ 26.0 26.1 [25] Strickland, E. (2017). Medical robots go soft [News]. IEEE Spectrum, 54(4), 11–12.
- ↑ 27.0 27.1 [26] Dahl, T., & Boulos, M. (2013). Robots in Health and Social Care: A Complementary Technology to Home Care and Telehealthcare? Robotics, 3(1), 1–21.
- ↑ 28.0 28.1 [27] Monti, M. M., & Owen, A. M. (2010). The aware mind in the motionless body. Psychologist, 23(6), 478–481.
- ↑ 29.0 29.1 [28] Owen, A. M., Coleman, M. R., Boly, M., Davis, M. H., Laureys, S., & Pickard, J. D. (2006). Detecting Awareness in the Vegetative State. Science, 313(5792), 1402 LP – 1402.
- ↑ 30.0 30.1 [29] Massimini, M., Boly, M., Casali, A., Rosanova, M., & Tononi, G. (2009). A perturbational approach for evaluating the brain’s capacity for consciousness. In Progress in Brain Research (Vol. 177, Issue C, pp. 201–214). Elsevier.
- ↑ 31.0 31.1 [30] Ferrarelli, F., Massimini, M., Sarasso, S., Casali, A., Riedner, B. A., Angelini, G., Tononi, G., & Pearce, R. A. (2010). Breakdown in cortical effective connectivity during midazolam-induced loss of consciousness. Proceedings of the National Academy of Sciences of the United States of America, 107(6), 2681–2686.
- ↑ 32.0 32.1 [31] Sarasso, S., Rosanova, M., Casali, A. G., Casarotto, S., Fecchio, M., Boly, M., Gosseries, O., Tononi, G., Laureys, S., & Massimini, M. (2014). Quantifying cortical EEG responses to TMS in (Un)consciousness. Clinical EEG and Neuroscience, 45(1), 40–49.
- ↑ [32]Kunin, V., Turqueti, M., Saniie, J., & Oruklu, E. (2011). Direction of Arrival Estimation and Localization Using Acoustic Sensor Arrays. Journal of Sensor Technology, 01(03), 71–80.
- ↑ [33] Basava, S. (2012). Microphone Array Wiener Beamforming with modeling of SRP- PHAT for Speaker Localization.
- ↑ [34] Autoriteit Persoonsgegevens. Algemene informatie AVG
- ↑ 36.0 36.1 [35] Autoriteit Persoonsgegevens. Temperaturen en gezondheidscheck
- ↑ [36] Verrijt, H (2020). Even tempen van wie bij ASML in Veldhoven gebouw binnen wil. Eindhovens Dagblad
- ↑ Health News Review. Understanding medical tests: sensitivity, specificity, and positive predictive value. [37]
- ↑ Heßling, M., Hönes, K., Vatter, P., & Lingenfelder, C. (2020). Ultraviolet irradiation doses for coronavirus inactivation–review and analysis of coronavirus photoinactivation studies. GMS hygiene and infection control, 15.
- ↑ Stibich, M., Stachowiak, J., Tanner, B., Berkheiser, M., Moore, L., Raad, I., & Chemaly, R. F. (2011). Evaluation of a Pulsed-Xenon Ultraviolet Room Disinfection Device for Impact on Hospital Operations and Microbial Reduction. Infection Control & Hospital Epidemiology, 32(3), 286–288. https://doi.org/10.1086/658329
- ↑ 41.0 41.1 Actuele informatie over het nieuwe coronavirus (COVID-19). (2020). RIVM. https://www.rivm.nl/coronavirus-covid-19/actueel
- ↑ DeBono, K. G. (1987). Investigating the social-adjustive and value-expressive functions of attitudes: Implications for persuasion processes. Journal of Personality and Social Psychology, 52(2), 279–287. https://doi.org/10.1037/0022-3514.52.2.279
- ↑ Gibbons, F. X. (1990). The impact of focus of attention and affect on social behaviour. Shyness and embarrassment: Perspectives from social psychology, 119-143.
- ↑ Carver, C. S., & Scheier, M. F. (1978). Self-focusing effects of dispositional self-consciousness, mirror presence, and audience presence. Journal of Personality and Social Psychology, 36(3), 324–332. https://doi.org/10.1037/0022-3514.36.3.324.
- ↑ [38] Netlogo. Uri Wilensky.
- ↑ [39] Birring, S.S., Matos, S., Patel, R.B., Prudon, B., Evans, D.H., Pavord, I.D. (2005). Cough frequency, cough sensitivity and health status in patients with chronic cough. Respiratory Medicine p. 1105-1109, Volume 100, Issue 6, June 2006.
