PRE2019 3 Group5: Difference between revisions
TUe\20175054 (talk | contribs) |
TUe\20175054 (talk | contribs) |
||
| Line 79: | Line 79: | ||
| Ana Maria Risnoveanu [10.5h]|| Two group meetings[3h], make the survey in Google forms [3h], distribute the survey [0.5h], first sketch of the bins digitally [4h]. | | Ana Maria Risnoveanu [10.5h]|| Two group meetings[3h], make the survey in Google forms [3h], distribute the survey [0.5h], first sketch of the bins digitally [4h]. | ||
|- | |- | ||
| Stacey Elshove[6h]|| Two group meetings[3h], Prepare questions, finalize | | Stacey Elshove[6h]|| Two group meetings[3h], Prepare questions, finalize and distribute [https://docs.google.com/forms/d/e/1FAIpQLSeYOQWsBpQKPW1f1nmIgbDDBToYi5oIFSYK-L6rm2173ROFRQ/viewform?usp=sf_link Survey][1.5h], learn wikitext- links within a page and to external pages and add links[0.5h], edit wiki-[[#User|User]], [[#Data analysis|Data analysis]] [1h] | ||
|- | |- | ||
| Petru Radulescu[8h]|| Two group meeting[3h], How the Dutch recycle[4], editing wiki[1h] | | Petru Radulescu[8h]|| Two group meeting[3h], How the Dutch recycle[4], editing wiki[1h] | ||
Revision as of 16:44, 20 March 2020
Group members
| Name | Student ID | Department |
|---|---|---|
| Ana Maria Risnoveanu | 1230444 | Electrical Engineering |
| Stacey Elshove | 1279998 | Psychology and Technology |
| Petru Radulescu | 1371320 | Psychology and Technology |
| Yiqin Hou | 1281135 | Electrical Engineering |
| Tobias Hilpert | 1281070 | Chemical Engineering |
Problem Statement
Today technology for recycling already exists and is put to use in most first world countries, but at times it can be inefficient because of mistakes made by all of us when throwing the trash, either unwillingly or because of our ignorance. So to mitigate this and help create a better planet for the future generations, we have come up with the idea of a smart bins, that will use a wide array of sensors and cameras to determine whether the waste should go in the glass, plastic or paper bin. This product will be small enough to fit in our homes and, in the future, it could be up scaled to service a full residence, like a block of flats.
Objectives
- Design an affordable smart trash can that fits into our homes.
- Use machine learning and AI to sort the trash into their corresponding compartment.
- Find suitable technologies to achieve this.
USE Aspects
User
The user group we wish to target is households, we would like to improve recycling at the source and make it easier for users. To better understand the users' needs, a survey was carried out. Survey
A Data analysis was performed under Data analysis and the requirements needed can be found in Product specifications.
Survey2 was created to finalize the design based on the users needs and wants as well as to help determine our products success.
Society
Automatizing recycling will shift the topic from a widely recognized theme to an issue to be solved by experts. Recycling campaigns will likely get far less attention than they do now and did in the recent past. This might slightly counteract the intended effect of increasing recycling. These effects seem unlikely to outweigh the advantages gained in the efficiency of sorting, however. There will also be a shift of who holds the responsibility for recycling. This responsibility is currently largely held by the consumer who is expected to throw garbage into the designated bins. If this process is largely automated the responsibility will either be carried by a few enterprises or, shared among society as a whole if the adoption of smart bin is facilitated through government owned utilities.
Enterprise
Recycling firms are struggling to be profitable in large part due to expensive and inefficient separation of waste feed-streams. An automated bin will judge much more accurately which products are likely to be recyclable than the average consumer. This improved recycling prior to waste collection would drastically lower the cost of recycling and increase profitability of these plants, therefore encouraging new investments into such businesses. The increase of separated waste arriving at recycling plants rather than landfills will also allow for these plants to invoke the economics of scaling up to further increase profitability, making such businesses even more attractive. It is thus likely that widely accessible smart bins will grow the recycling industry.
Task distribution
Week1
| Name[total hours of work] | Tasks and hours |
|---|---|
| Ana Maria Risnoveanu [8h] | Learn wikitext[1h], Material sensors [5h]
[1] [2] [3] [4] [5] [6], Approach-Milestones-Deliverables [1h], look over internet for other ideas [1h] |
| Stacey Elshove[10.5h] | Learn wikitext[2h], Reasons why[7][8]and summary[4h], What already exists[9][7][10] and summary[4.5h] |
| Petru Radulescu[6h] | Learn wikitext[2h]; Objectives[1h]; Problem statement[1h]; Sorting systems[2h]... |
| Yiqin Hou[13h] | Papers about X-ray imaging[11][12][13][14]/Object recognition[15] searched and studied[7h]; summary of X-ray and coputer vision[2h]; Learn wikitext and make template for the group wiki[3.5h]; User aspect[0.5h] |
| Tobias Hilpert[14h] | Literature study into waste sorting[4h], Research into Infrared spectroscopy[8h], Learned wikitext[2h], Wrote Enterprise and Society aspect[0.5h] |
Week2
Subgroups
User survey form: Ana Maria Risnoveanu, Stacey Elshove, Yiqin Hou. Recycling center: Petru Radulescu, Tobias Hilpert.
| Name[total hours of work] | Tasks and hours |
|---|---|
| Ana Maria Risnoveanu [10.5h] | Two group meetings[3h], make the survey in Google forms [3h], distribute the survey [0.5h], first sketch of the bins digitally [4h]. |
| Stacey Elshove[6h] | Two group meetings[3h], Prepare questions, finalize and distribute Survey[1.5h], learn wikitext- links within a page and to external pages and add links[0.5h], edit wiki-User, Data analysis [1h] |
| Petru Radulescu[8h] | Two group meeting[3h], How the Dutch recycle[4], editing wiki[1h] |
| Yiqin Hou[8.5h] | Two group meetings[3h], Prepare questions and distribute the user form[1h], edit wiki[0.5h],think and sketch possible bin designs (the draft will not be uploaded to Wiki)[3h] |
| Tobias Hilpert[8h] | Two group meetings[3h], Research into Dutch recycling plants[2h], research into recycling mechanisms[2h], research into household waste composition[1h] |
Week3
| Name[total hours of work] | Tasks and hours |
|---|---|
| Ana Maria Risnoveanu [7.5h] | Three group meetings[7h], part of feature analysis for the trash from the survey Basket categories,Size[30min]; |
| Stacey Elshove[8.5h] | Two group meetings[3.5h], Data analysis on Stata[4.5h], Survey 2 questions [0.5h] |
| Petru Radulescu[h] | Three group meeting[7h], Fun to recycle[1h], |
| Yiqin Hou[9h] | Three group meetings[5h], General plan made, possible problems or hazards listed[1h], Analyze erplies of question: "What do you recycle?"[1h], Adjust product specifications according to data analysis results and merge hazards into the form[1h], New sketch of the bin: Sketching[1h] |
| Tobias Hilpert[6.5h] | Two group meetings[3.5h], Exploratory data analysis in Python [3h] |
Week4
| Name[total hours of work] | Tasks and hours |
|---|---|
| Ana Maria Risnoveanu [13h] | Meeting with Petru to discuss about flaws of design and write down documentation for the latest model [4h], try to sketch the bin in illustrator (but failed) [1h], update wiki with the information about the latest model but the work was not saved by wiki[4h], repeat last task [4h] Model description |
| Stacey Elshove[7.5h] | Two group meetings[4h], make paper prototype[1h], edit the requirements under Product specifications to requirements and could have [0.5h], Survey2[2h] |
| Petru Radulescu[8h] | Two group meetings[4h], Meeting with Ana to discuss about flaws of design and write down documentation for the latest model [4h] |
| Yiqin Hou[5.5h] | Two group meetings[4h], make sketch version 3.0 in Sketching[1h], eidt list of components[0.5h] |
| Tobias Hilpert[9h] | Two group meetings[4h], Organize Lab access to the Analytical Lab in Helix [2h], Discuss plan for experiments with Wilco Wegemans (supervisor of the Lab) [2], collect first samples [1h] |
Week5
| Name[total hours of work] | Tasks and hours |
|---|---|
| Ana Maria Risnoveanu [h] | Two group meetings[4h], |
| Stacey Elshove[10h] | Two group meetings[4h], correct wiki text (spelling, consistency, overlap) [4h], start on the presentation [2h] |
| Petru Radulescu[h] | Two group meetings[4h], |
| Yiqin Hou[h] | |
| Tobias Hilpert[17.5h] | Two group meetings[4h], Sample preparation, Machine calibration and Measurements [7h], Data Analysis with Essential FTIR and Database research [6h], summarizing results [0.5h] |
Week6
| Name[total hours of work] | Tasks and hours |
|---|---|
| Ana Maria Risnoveanu [h] | |
| Stacey Elshove[h] | Data analysis for survey 2[4.5h], correct wiki text (spelling, consistency, overlap) [h], work on presentation [h] |
| Petru Radulescu[h] | |
| Yiqin Hou[h] | |
| Tobias Hilpert[h] |
SotA
Reasons why
Too much rubbish
Nowadays there is an over load in rubbish in cities and in rubbish dumps, he main reason for this is that there are many recyclable materials that just get throw away in the normal rubbish. Having smart bins will help reduce this waste and the resources we use to make produces. Sharma and Singha, [7] found that the pile up of rubbish is leading to many diseases and came up up with a solution about a Smart Bin that will alert the collector when the bin is full and they will come a collect it. This will prevent rubbish over load for example, rubbish falling out of bins or piling up next to them because they are full. However this is just a start to our problem as this still does not solve the recycling issue, this is dealt with in the next section.
Easy to recycle
The best way to get people to do things is to make it easy for them to do it. When it is easy to do something people are more inclined to do it than when they would have to put lots of effort in for example to have to take their separate plastics bag to the supermarket to recycle it when they could just add it to the normal rubbish.
Lack of knowledge
Thomas etal, found that many people are unaware of what happens after they throw something away, or the benefits of recycling[8]. Creating more awareness will cause people to understand what their actions will lead to and hopefully impact the way they behave.
Fun to recycle
When something is fun to do as when it easy to do people are more inclined to do it. This can be seen in the Efteling in the Netherlands, they have paper bins which are shaped like people who have their mouth open. People can through paper into their mouths and then they are thanked for recycling (feeding them). This make people more inclined to recycle as now it is fun to throw the paper into his mouth and they also receive positive feedback.
Another idea is to create an accompanying app that can comper your recycling proficiency with your friends or other people from the same city. This could make the process of recycling competitive pushing owners to do it more thoroughly and maybe give potential customers enough incentive to do the final step. Such systems are used in smartwatch products like Fitbit.
What already exists
Bin e is a smart bin that sorts anything you throw away[9] . It sorts the items into plastic, glass, paper and metal. This bin is only for recyclable materials thus people still have to put some thought into whether they can recycle it or not.
As mentioned above the Smart bin[7], which informs the collectors when it is full. The bin uses Ultrasonic sensors to determine how full the bin is.
How the Dutch recycle
There is a curbside collection service that collects: [16]
- Biodegradable waste in the green bins (almost all cities)
- Paper in yellow bins (almost all cities)
- Plastics in blue bins (major cities)
- Household chemicals, batteries in red bins (most cities)
- Clothing in green clothing containers (most cities)
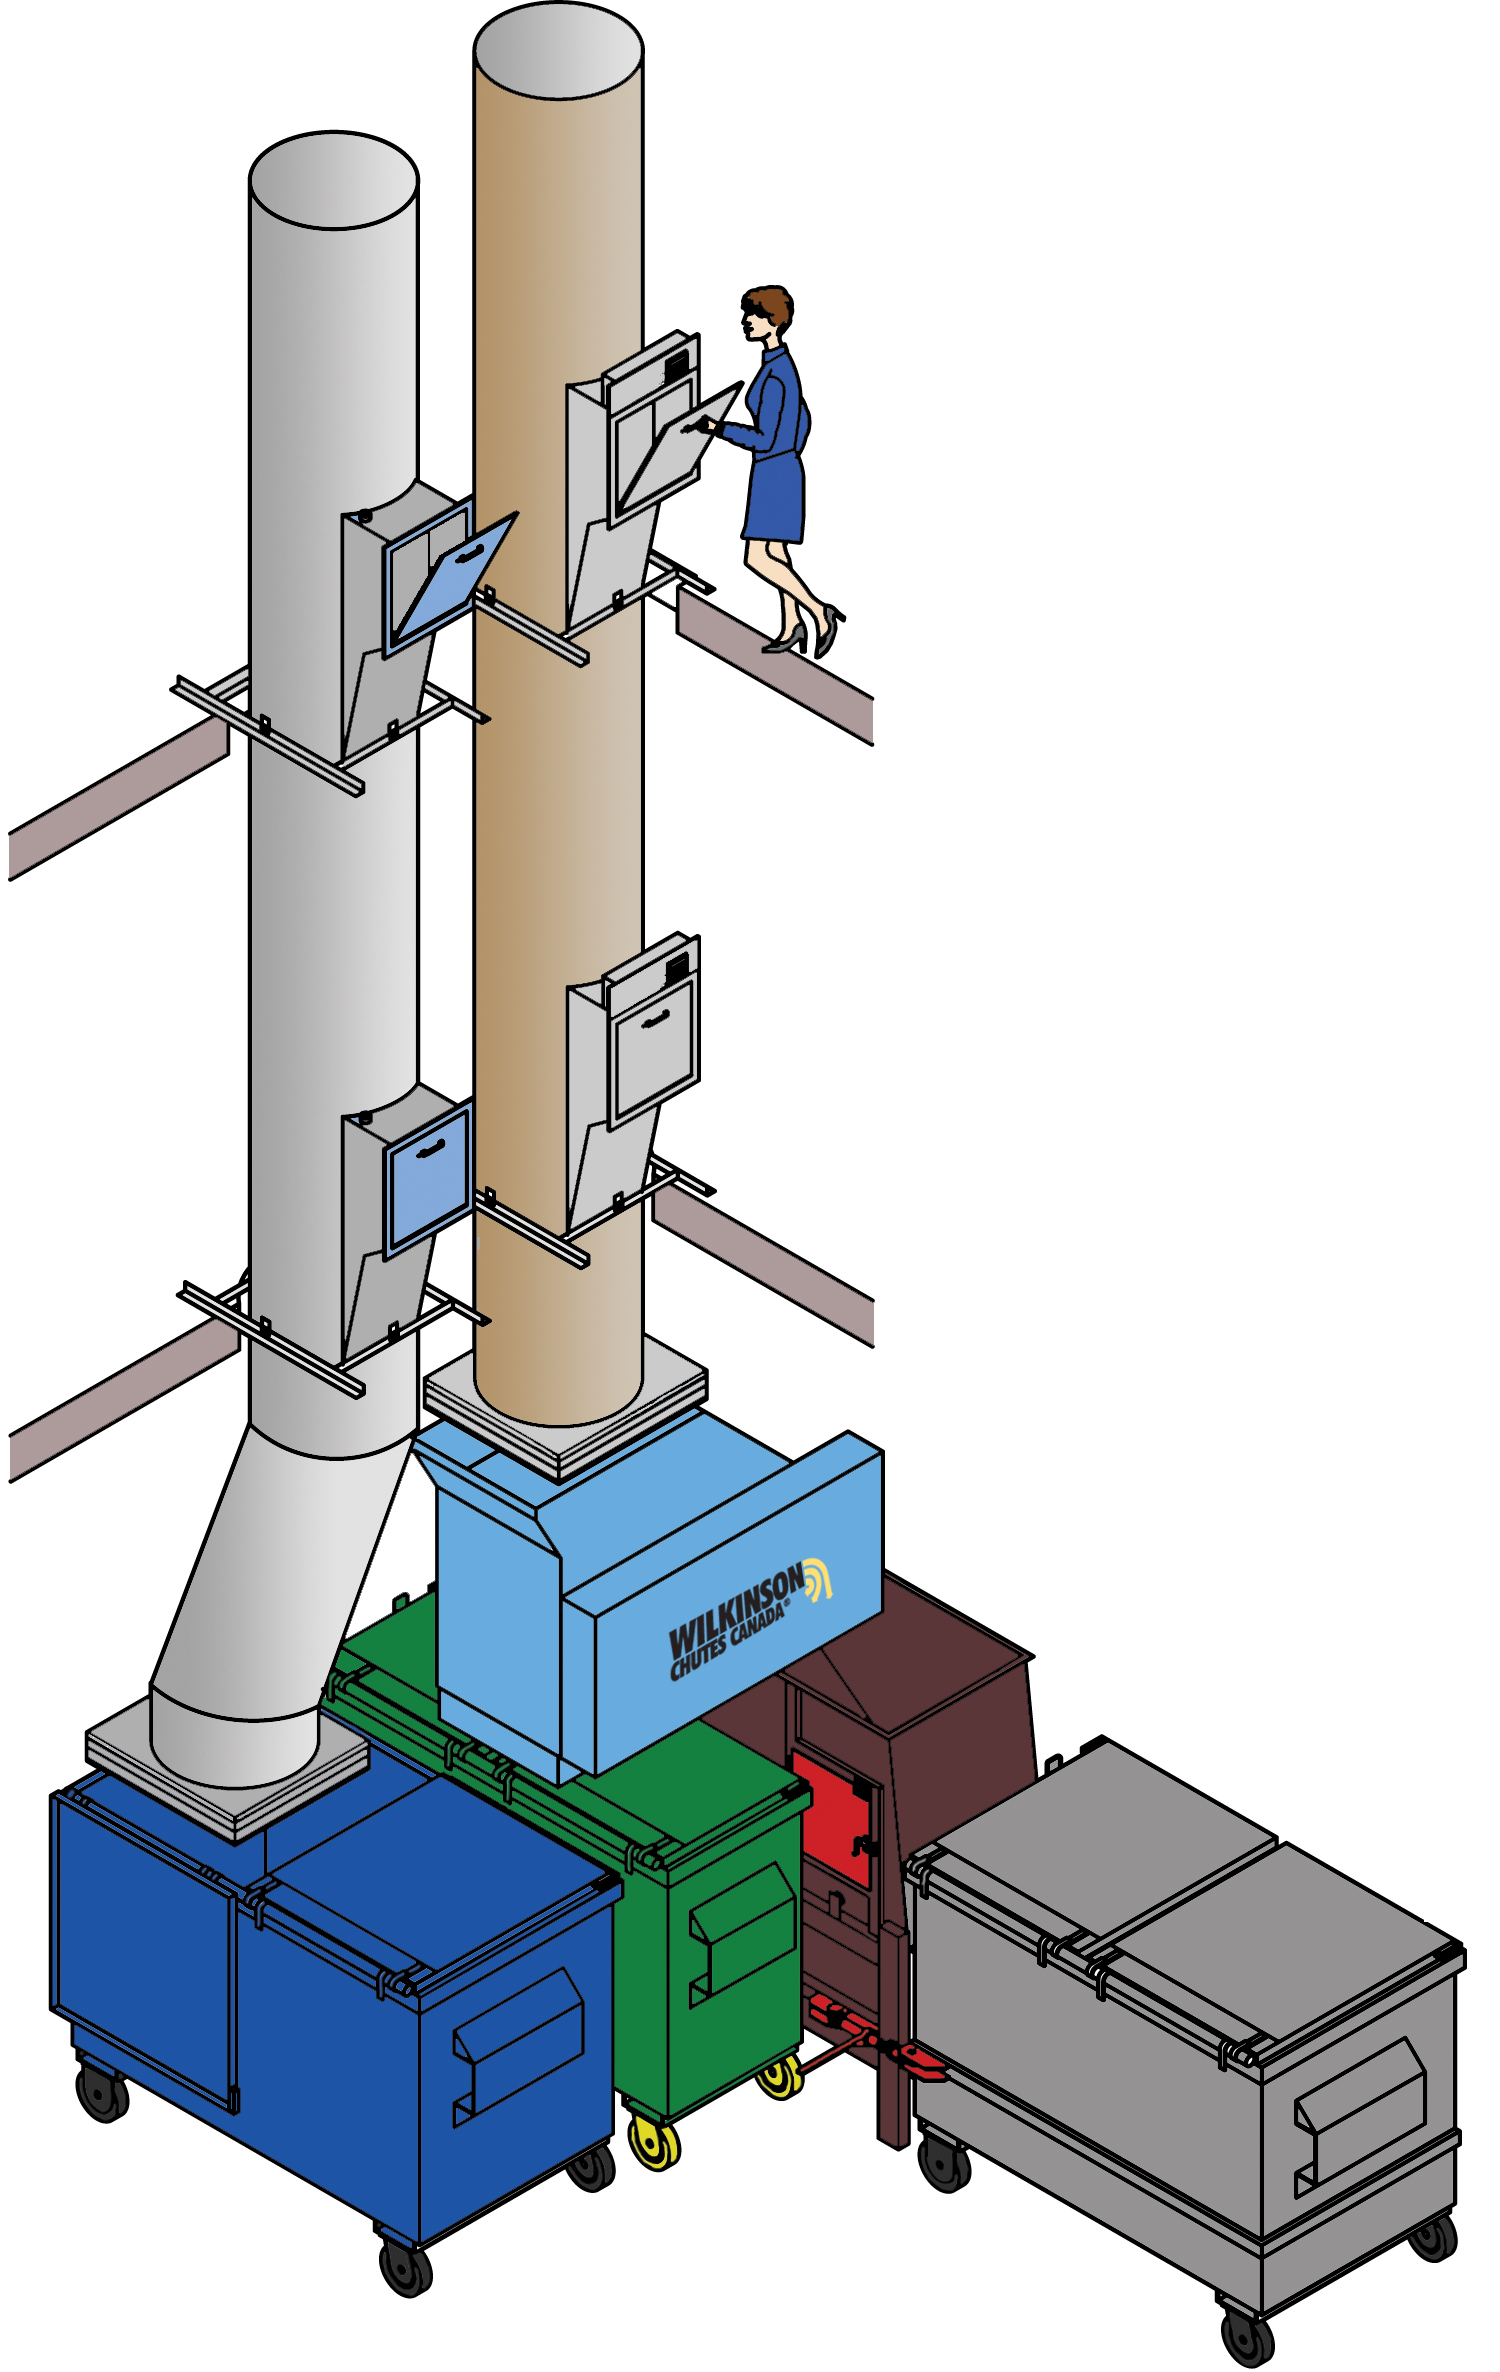
For example, the cities of Eindhoven, Valkenswaart and Geldrop-Mierlo employ the company “Cure Afvalbeheer” to collect refuse and waste paper and recycle it into new products. Cure takes care of the collection of waste paper and cardboard, plastics, bulky household waste, glass and chemical waste.[17]
On the collection of recyclable waste: [18]
What paper can be recycled:
- Newspaper and fliers
- Copying, writing, drawing paper
- Envelopes
- Gift-wraps
- Egg boxes
- Paper bags and cardboard boxes
- Cardboard and paper packaging
What plastics can be recycled:
- Plastic bags and bread-, pasta and rice bags
- Wraps from magazines and advertising materials
- Plastic trays
- Yoghurt, cream and ice cream pots
- Plastic lids from jars
- Plastic bottles (from drinks, cooking products and sanitary products)
- Shampoo, shower gel, hand soap and bath foam bottles and similar
What glass can be recycled:
- Glass packaging of beverages
- Glassware of food (jars)
- Glass packaging of cosmetics
- Glass packaging of medicines
- Glass deodorant rollers
- Perfume bottles
What textile can be recycled:
- Clothing
- Bath towels
- Sheets, blankets
- Kitchen textiles
- Curtains
- Shoes (paired together)
- Bags, belts and scarves
What chemical waste can be recycled:
- Batteries, low-energy light bulbs, strip lights, liquid drain cleaner, lamp oil, kerosene, pesticides/ herbicides/insecticides
- Medicines, mercury thermometers, injection needles
- Paint, varnish, stain and wood preservation agents, products used when painting such as turpentine, thinner, paint stripper, paintbrush cleaner, paintbrush softener and benzene, mercury switches
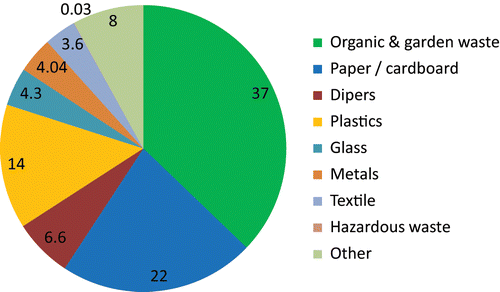
The percentage of different wastes collected in the Netherlands: [19]
Recycling firms in the Netherlands
Existing facilities
The market for waste consists of consumers, collectors, processors and disposers. Collectors in the Netherlands are contractors hired by local municipalities or services directly employed by said municipallities. [21] Depending on the size of their waste streams industrial facilities may either employ the local services or hire a private waste collector. This choice is still regulated on the provincial level [22] by the distribution and requirement of permits. Collected waste is then further distributed to processors, who recycle waste streams into new secondary material, and disposers, who make use of landfilling and incineration to remove the unrecyclable waste. There are close to 600 individual recycling facilities and support firms located in the Netherlands [23] recycling wood, metals, plastics, paper, electronics and glass. This large presence of companies lead to an substantial import in recyclable waste into the Netherlands in recent years [24]
Recycling mechanisms
Recycling mechanisms naturally differ largely by the type of waste inside a given waste stream.
Metals
In the Netherlands most ferrous metals are directly sorted from general waste with the help of electromagnets, whereas pure sources of non-ferrous metals, most notably aluminium, are collected separately. Both kinds are then processed in a similar way, first being compressed for transport, then shredded for sorting and more efficient melting. The melted metal is then purified, usually using electrolysis. [25]
Paper
Paper waste is grouped into several different groups depending on the kind of paper and the print on it. These groups range from wood-free white paper without print to wood-containing coloured or heavily printed paper. The recycling mechanism differs for different categories, but usually includes multiple washing, kneading and dewatering steps. The main difference between the categories is the number and placement of deinking steps [26]
Organic
Organic waste is most commonly recycled by the use of Composting, Biofuel Production or Algae Production, the latter being the least common in the Netherlands. [27] Most household waste are categorized as solid food spills and are converted into biogas in anaerobic bioreactors. [28]
Plastics
There are close to 40 plastic recycling plants in the Netherlands. About 1/3 of these facilities accept a wide range of different plastic types, including PET, PP, PS, HIPS, PVC, HDPE, LDPE, ABS, and PMMA. The most common types present in household waste are PET, PP, and PE (both HDPE and LDPE). Most of the other facilities specialize in one more of the these common plastics. [29]
Waste composition
A comparison of the waste composition of both produced and recycled solid waste is given below:
| Kind of waste | Amount collected [/person/year] | Amount recycled (percentage) [/person/year] | |
|---|---|---|---|
| Biological | 144kg | 86kg (60%) | |
| Paper | 66 kg | 52 kg (78%) | |
| Tetrapaks | 3,6 kg | 1,8 kg (50%) | |
| Glas | 28 kg | 20 kg (73%) | |
| Plastic packaging | 25 kg | 14 kg (59%) | |
| Metal cans | 7,1 | 6,7 kg (95%) | |
| Electrical equipment | 18 kg | 9 kg (49%) | |
| Textiles | 15 kg | 4,7 kg (31%) | |
| Small chemical disposables | 1,4 kg | 1,2 kg (86%) |
There are notable deficits in the recycling statistics in biological waste, Tetrapaks, plastic waste, electrical equipment and textiles. The drop in percentage point for electrical equipment and plastic packaging can be explained by the complex recycling processes necessary for these materials [31]. Biological waste and Textiles, however, are recycled with relative ease. These deficits are mainly due to improper collection of the waste streams: bio-waste is difficult to separate from general waste and textile collection is difficult for the consumer.
Detection
X-ray
Inspired by security machines, X-ray imaging could be a usefull tool in detcting the type of rubbish. X-ray imaging [32]makes use of the property of X-ray that it attenuates differently accorss difderent materials. For example metal atoms and ions attenuate more X-ray than normal organic tissue, such as fat and protein. Some new X-ray imaging techniques could even determine the chemical structures that form within the materials[14]. With such techiniques and some morden X-ray imaging detectors [12], the bin can distinguish materials much more accurate than using normal X-ray imaging. It is also possible to distinguish different types of plastics with X-ray imaging[11], which further increases the recycling sorting process.
Despite its reliable performance in detecting metal and different kinds of organic materials, an X-ray imaging system is too expensive to implement in a household trash bin. Even the cheapest X-ray tubes cost $100 to $500 each, let alone the detectors, power supply and other systems.
Computer vision and image processing
An alternative could be object recognition, by simply mounting a camera in the container and train an AI system to recognize different types of wastes. With the technique of using discriminative parts[15], the system could be even more precise. For example, it can distinguish the words on the package of the waste. Computer vison could be implemented together with other techniuqes like infrared spectroscopy, to increase overall effectiveness.
Infrared Spectroscopy
Infrared spectroscopy can be classified into different categories based on the wavelengths used. This detection method is both cheap and fast enough for practical applications in waste sorting. Near Infrared (NIR, wavelength 1-1.7µm) Spectroscopy is already deployed for uses in plastic separation. NIR has the ability to excite overtones of molecular vibrations and therefore can give information on the chemical composition of the sample. [33] NIR spectroscopy can also be used for different kinds of waste, such as construction debris [34]. There are clear limitations when analysing black and coloured samples though, as their reflectivity in the NIR spectrum is too low to allow for signal-to-noise ratios high enough for proper identification. To overcome this difficulty NIR spectroscopy can be enhanced with longer wavelengths. It has been shown that combining NIR with Midwave Infrared (MWIR, wavelength 3-12µm) significantly improves the performance of detectors for black and opaque products. [35] This can be extended to multiple spectra in hyperspectral imaging techniques, which probe a wide range of wavelengths even in the visible spectrum for material identification. These systems have also been shown to work at the speeds which would be needed for practical applications. [36] FTIR spectrometers are simple enough devices that handheld versions with sensitivities good enough to separate materials exist. [37].
Available sensors
There are several sensors available on the market: electro-mechanical, pneumatic, magnetic, inductive, capacitive, photoelectric, ultrasonic. The electromechanical sensor only shows how resistive an object is, which might be important but not sufficient here since two different objects could output the same value [1]. The same is the case with a pneumatic sensor, which just differs in the way it is built [2]. The magnetic sensors are of no use since there is no magnetic field created by rubbish [3]. On the other hand, although it also uses an induced magnetic field, the inductive sensor (also known as inductive proximity sensors) may prove successful in the detection of metallic materials. Unfortunately, domestic trash mostly includes other types of materials and aluminium cans, for instance, are usually recycled in waste. Then, there is little difference between the applications of inductive and capacitive sensors [5] and spending time in choosing between them will only be useful if the team decides on the categories of rubbish. A photoelectric sensor is another proximity sensor, which can only be used to check the absence of an object which leads to the last option on the list: ultrasonic sensors. Although these sensors cannot detect different types of materials, they do offer more information: the distance to an object or the speed of the object; they are reliable and can be used in many applications [6]. Some models of ultrasonic sensors come with detection of some aspects of the material (softness, colour) and therefore they are the best choice among simple and cheap detection methods. In order to know if they are a suitable choice, we must set the desired sensitivity of our system and check the limitations of different ultrasonic sensors.
Experimental Testing
In order to determine whether our design is indeed feasible we decided to test the sorting mechanism in depth. From our previous literature research it was indicated that IR-spectroscopy was the most likely candidate to be used in the sensing area. Although an (FT-)IR spectrometer might not be the only sensor in the final design a large portion of the sorting will be determined by it. We have designed some experiments to test the feasibility of and FTIR spectrometer as sensor for trash sorting.
General Methods
Samples were collected throughout a normal work week from used household items before they were thrown into the trash to mimic the samples likely to be encountered in the smart bin closest. They were stored in a PE container cleaned with Isopropanol for no more than 4 days. The samples were cut into 3cm2 pieces for the analysis. All measurements were carried out on an IRAffinity 1 equipped with a MIRacle 10 ZNSE prism plate, both supplied by Shimadzu.
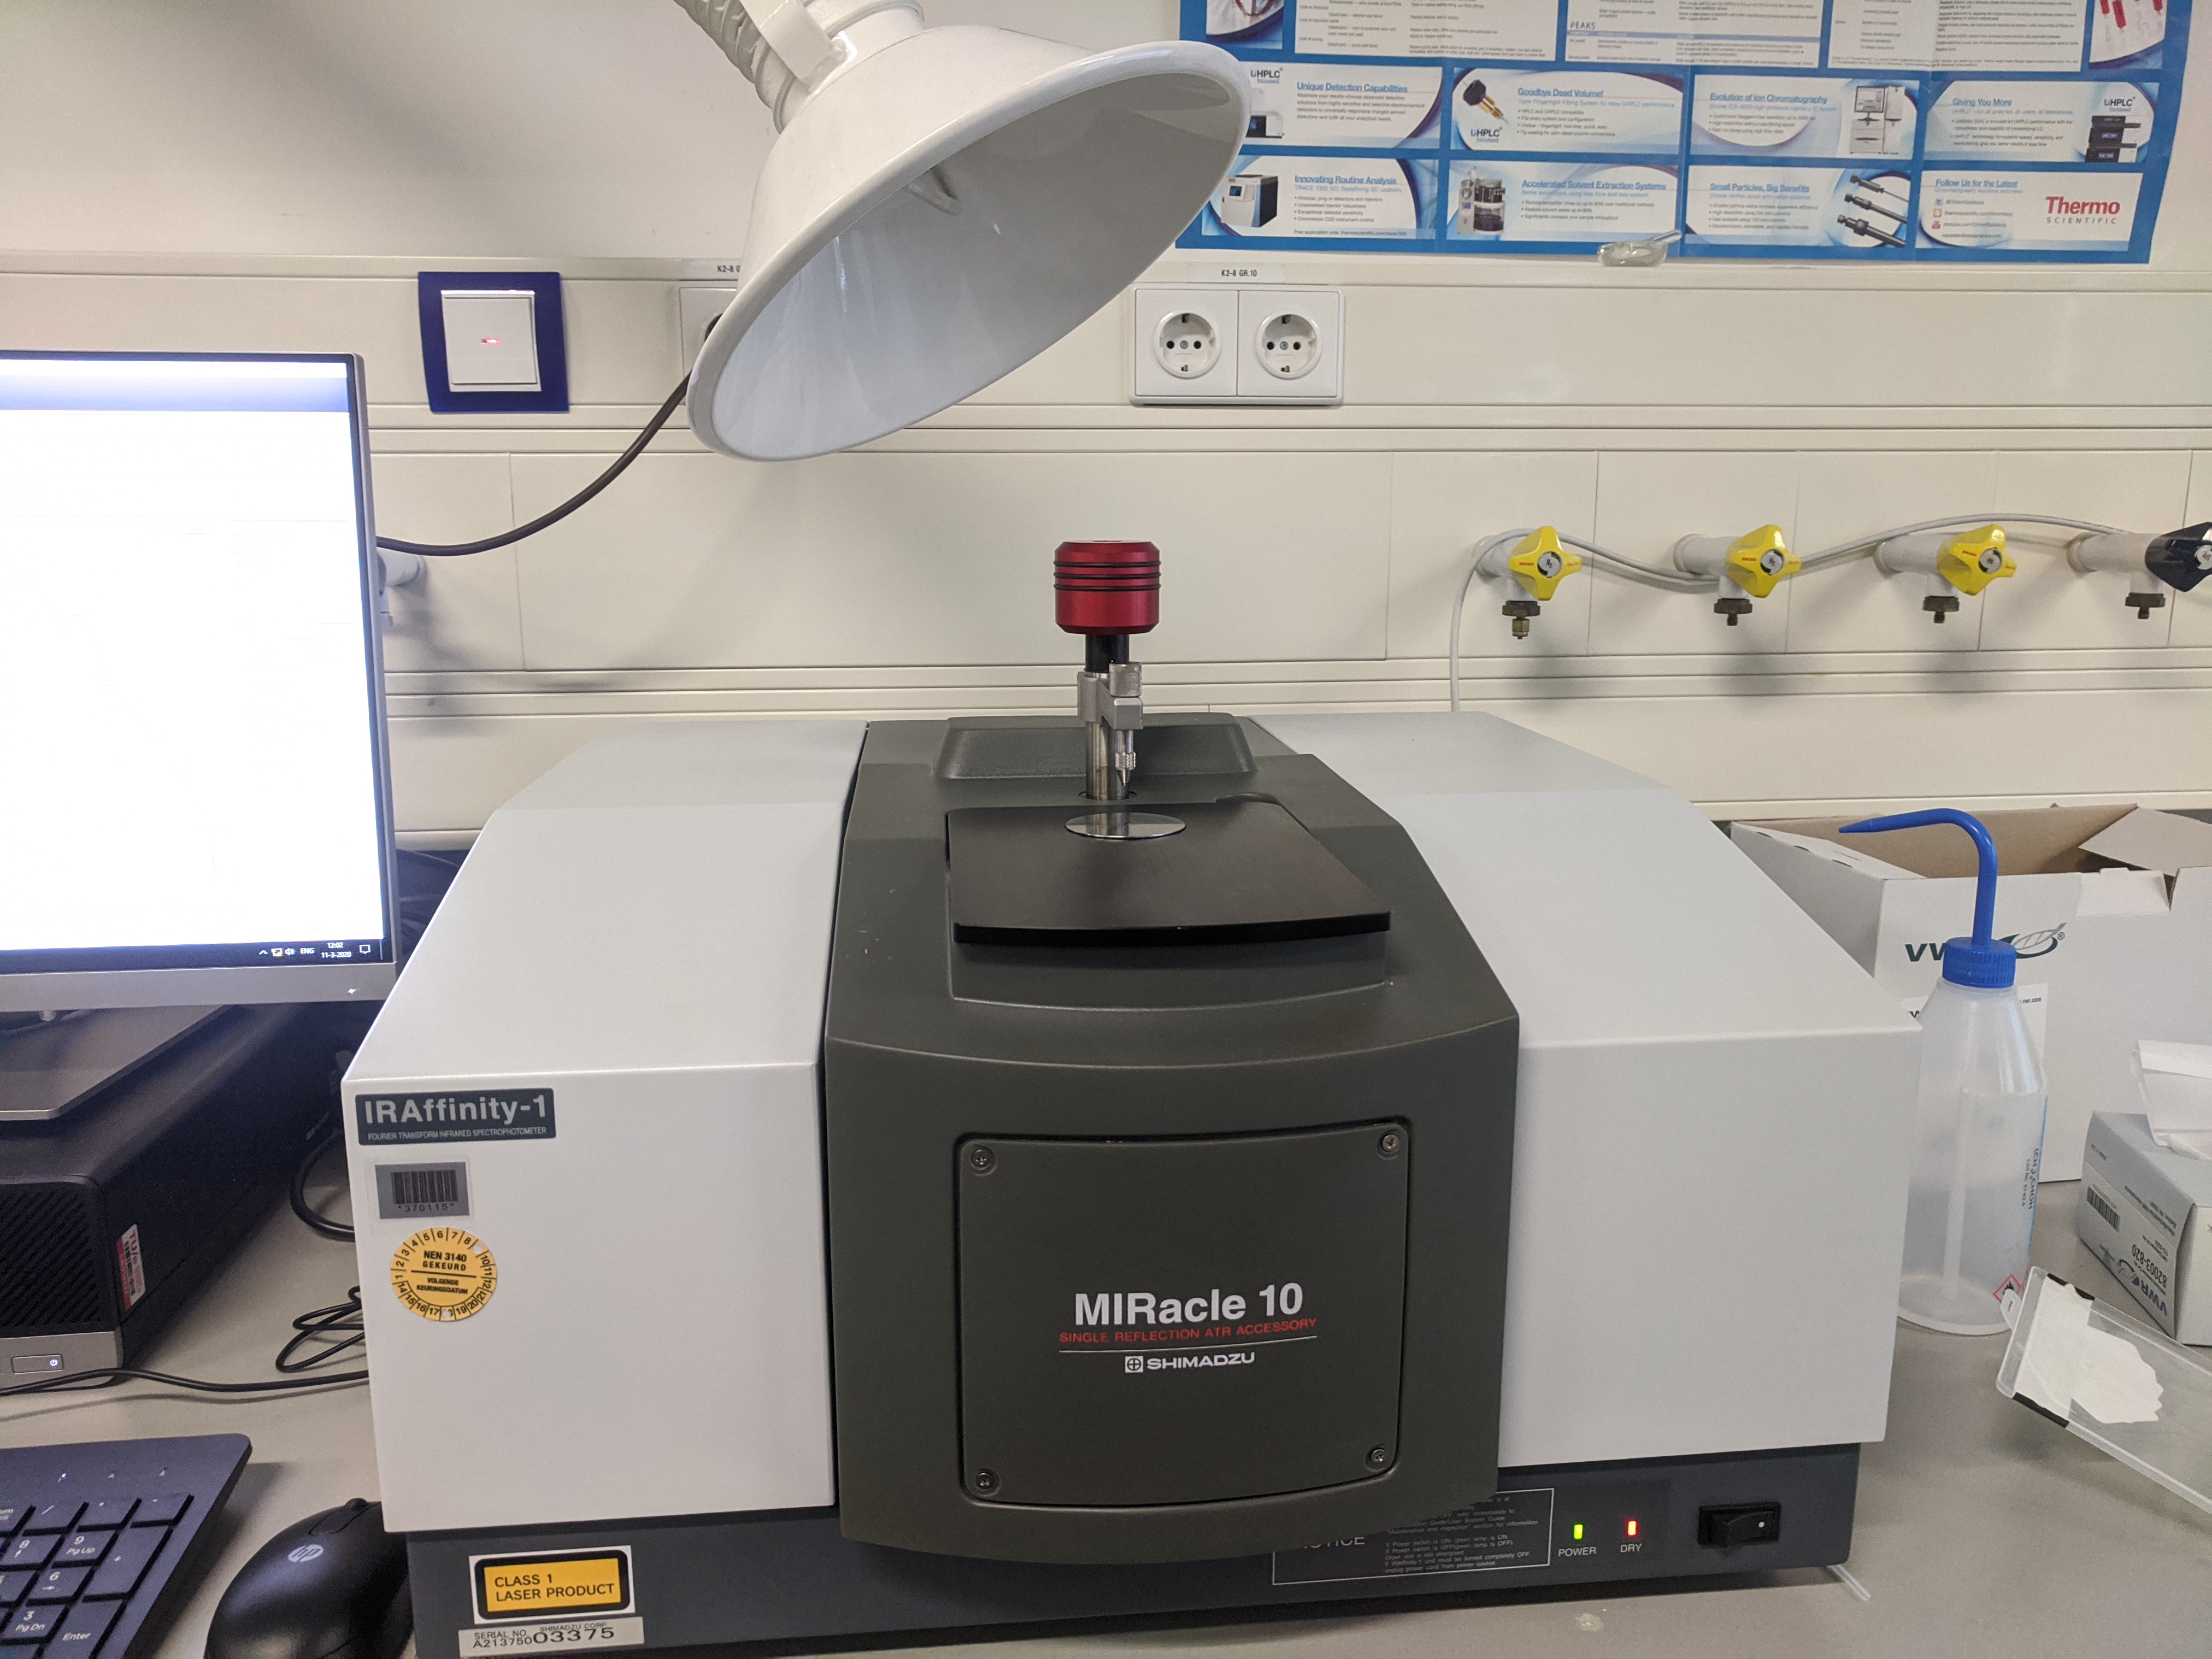
Before the measurements were taken the machine was calibrated by 256 scans of the detected IR radiation from diffuse environmental reflections. In order to guarantee accurate measurements each sample was scanned at least 56 times. The lens tray was thoroughly cleaned with Isopropanol between each measurement. All data analysis was performed in the Essential FTIR (v3.50.194) environment by Operant LLC.
Experiments Week 5
The first round of experiments was prepared to iron out mistakes in the collection and measurement process as well as trying to identify different kinds of plastics.
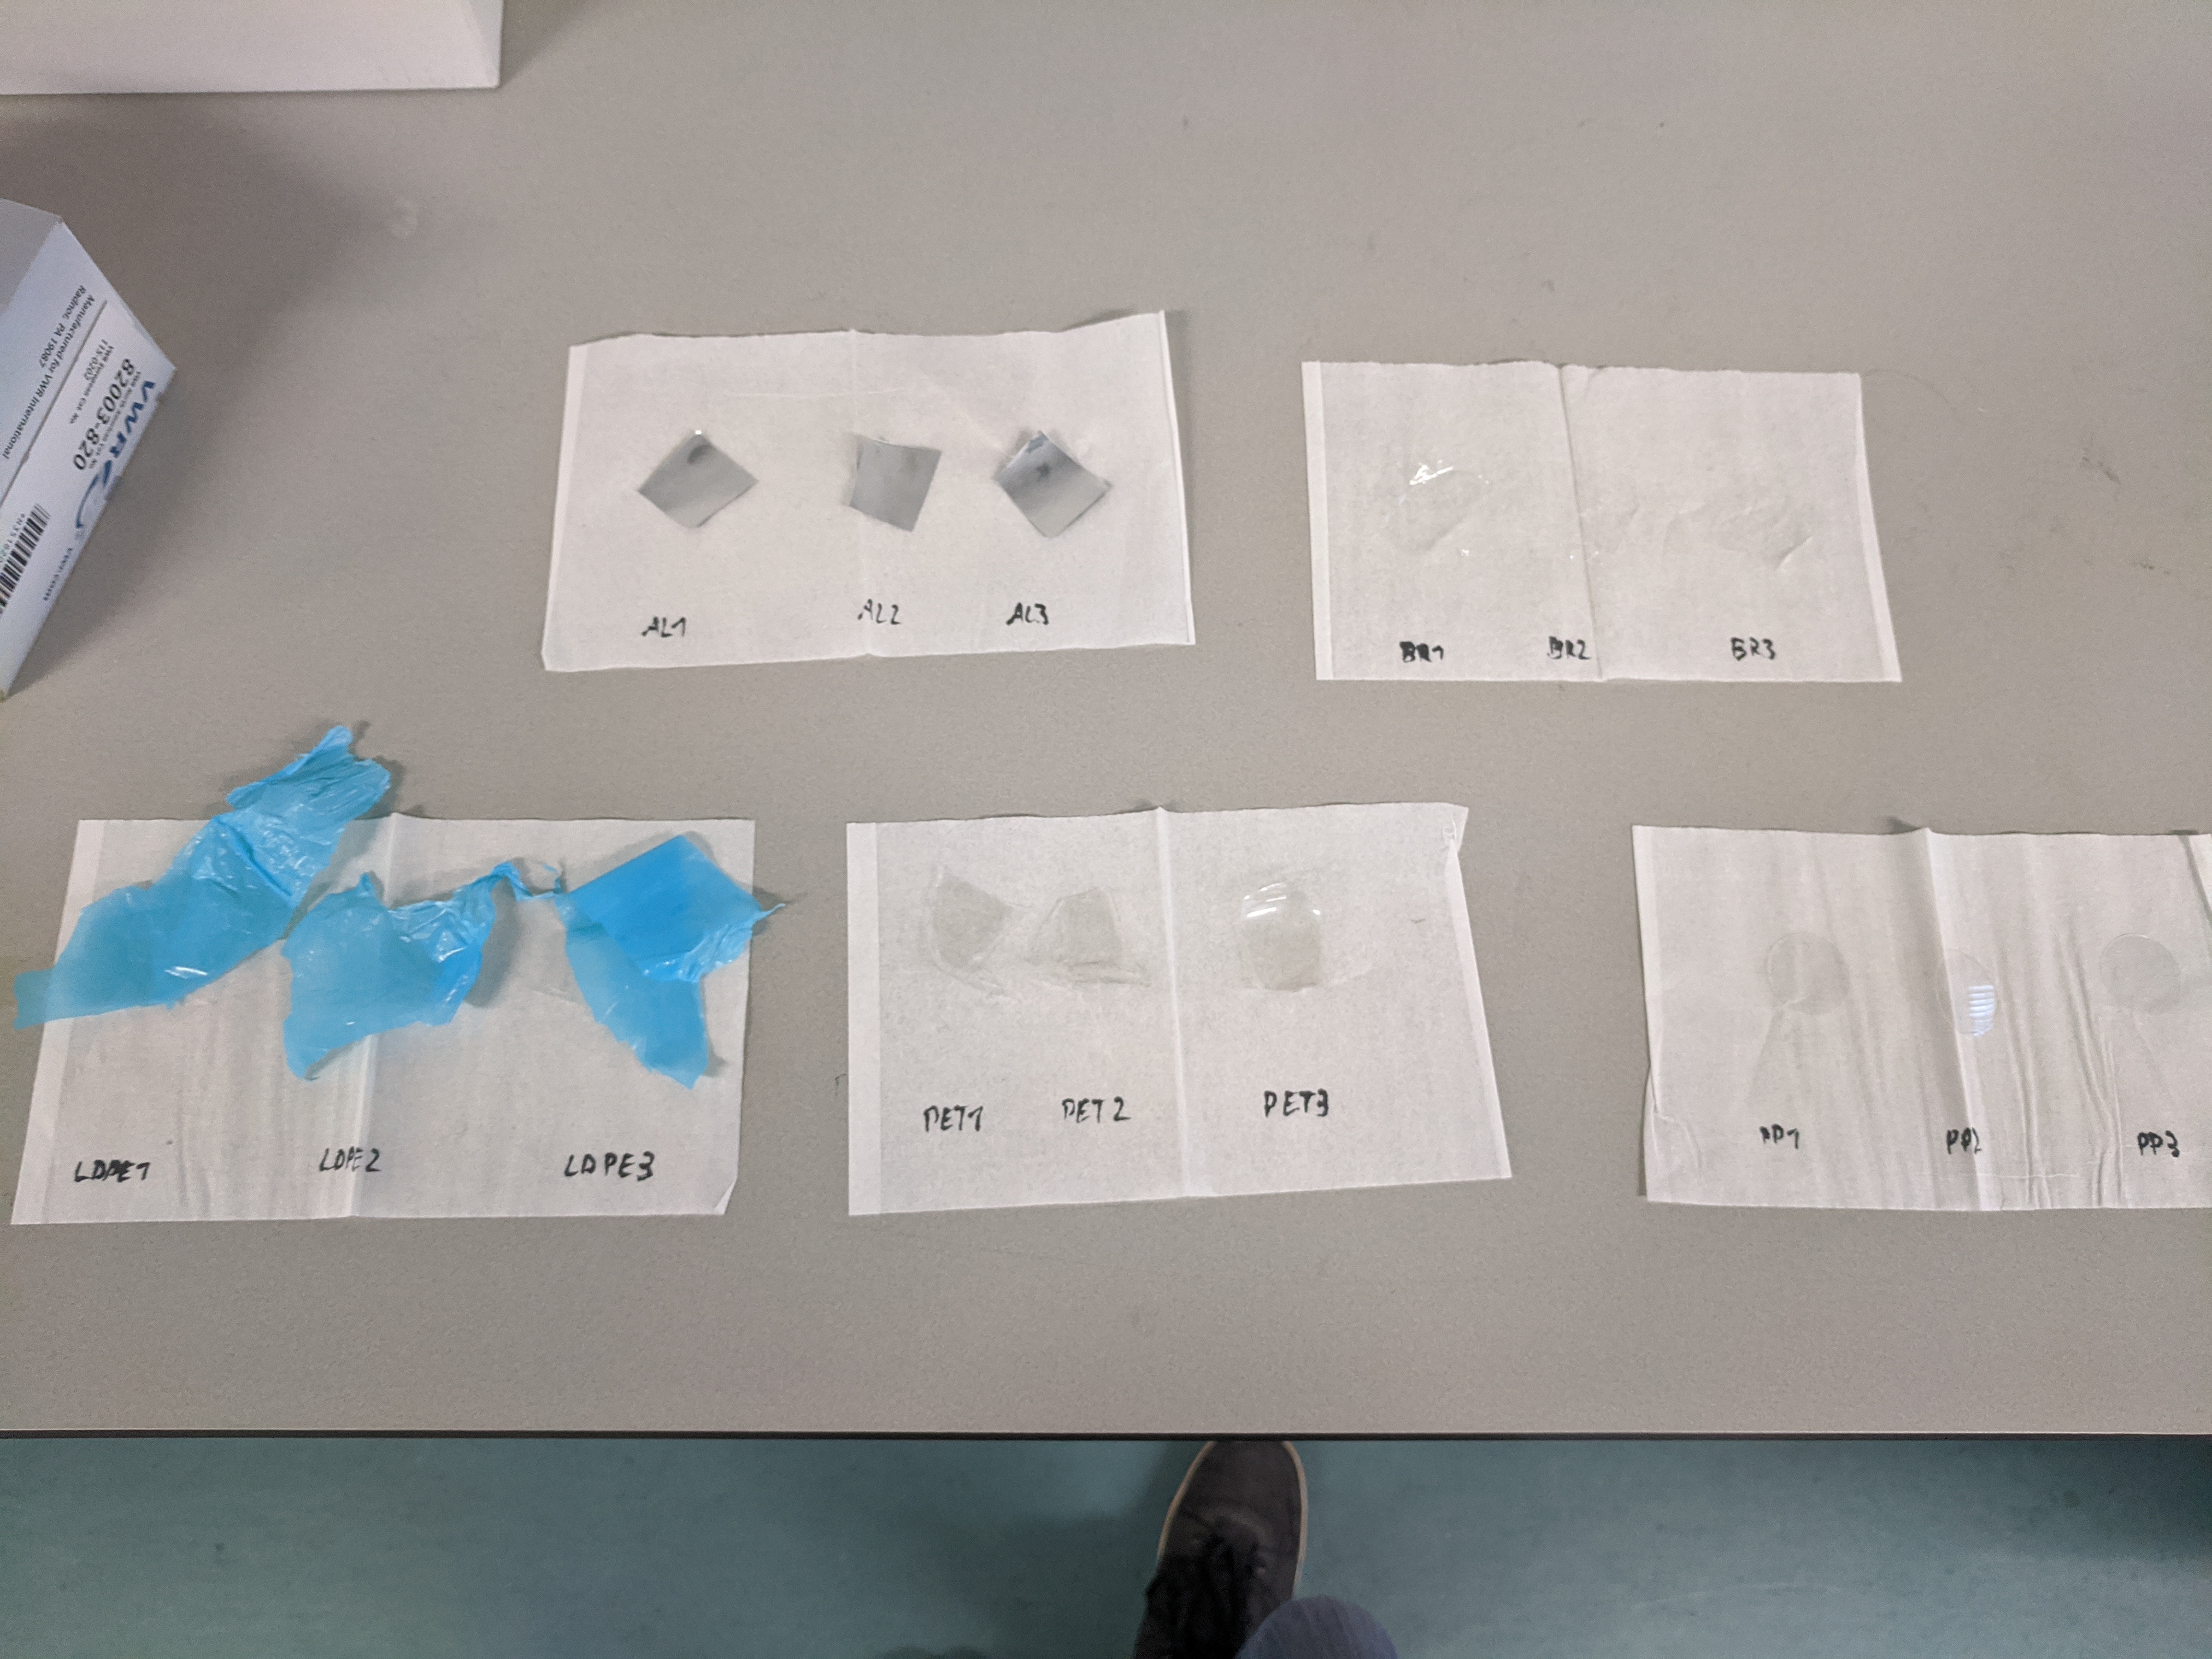
5 different polymers were inspected: (Low density) Polyethylene (PE), Polypropylene (PP), Polyethylene Terephthalate (PET), Aluminium coated polyethylene (here: AL) and a biodegradable polymer (here: BR). For each polymer three samples were collected.
Each sample was scanned 56 times and the spectogram was then analysed.
Results and Discussion:
Every single sample showed very similar characteristic peaks, contrary to our expectations. The overlay of the first sample from each Polymer shows almost identical peaks at a cm-1 that do not clearly correspond to molecular vibrational overtones which should be present in all samples [38].
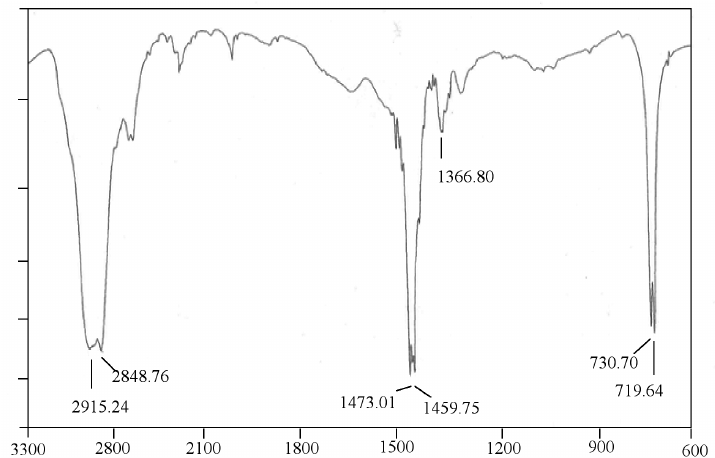
The results also seem to disagree with literature on multiple accounts. The IR-spectrum of PE agreed upon in literature, for example, shows a large deviation from our measurement.
Literature reports this spectrogram[39]:
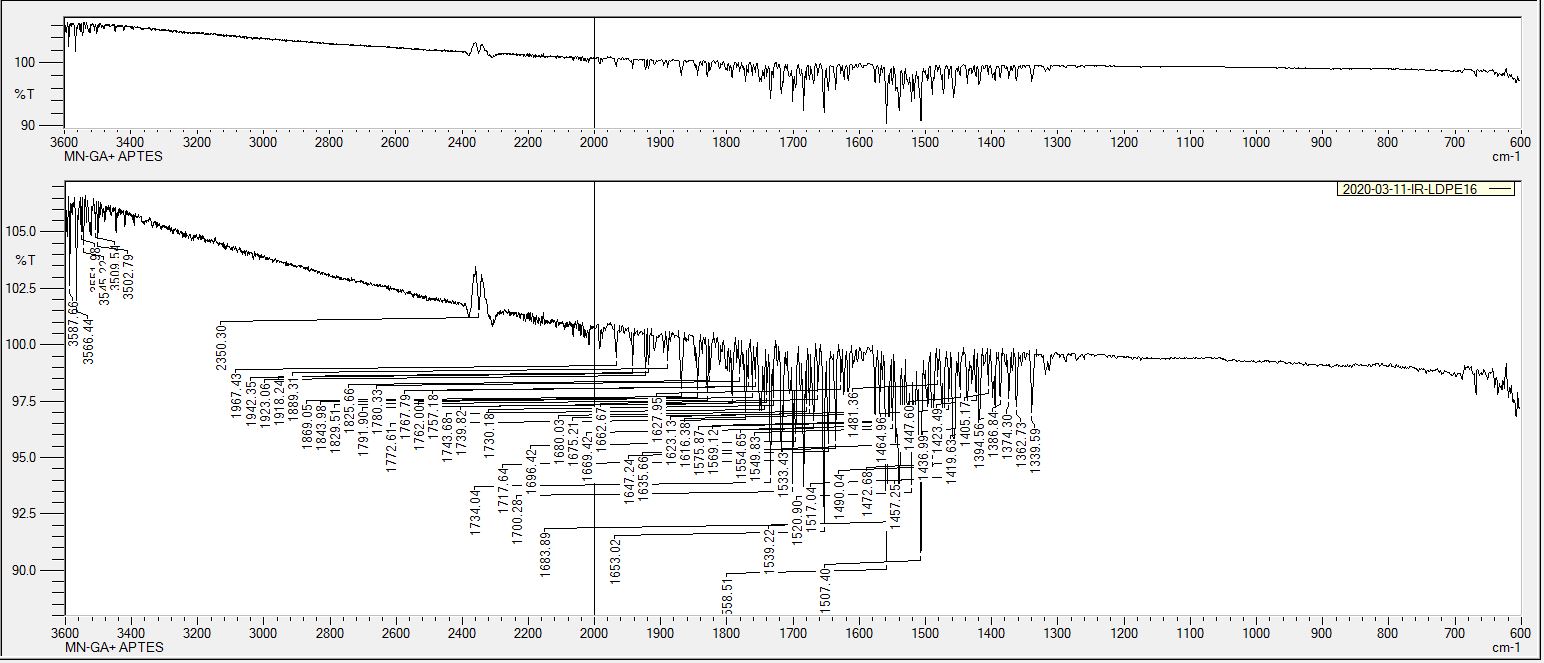
Whereas the measured spectrogram shows different peaks:
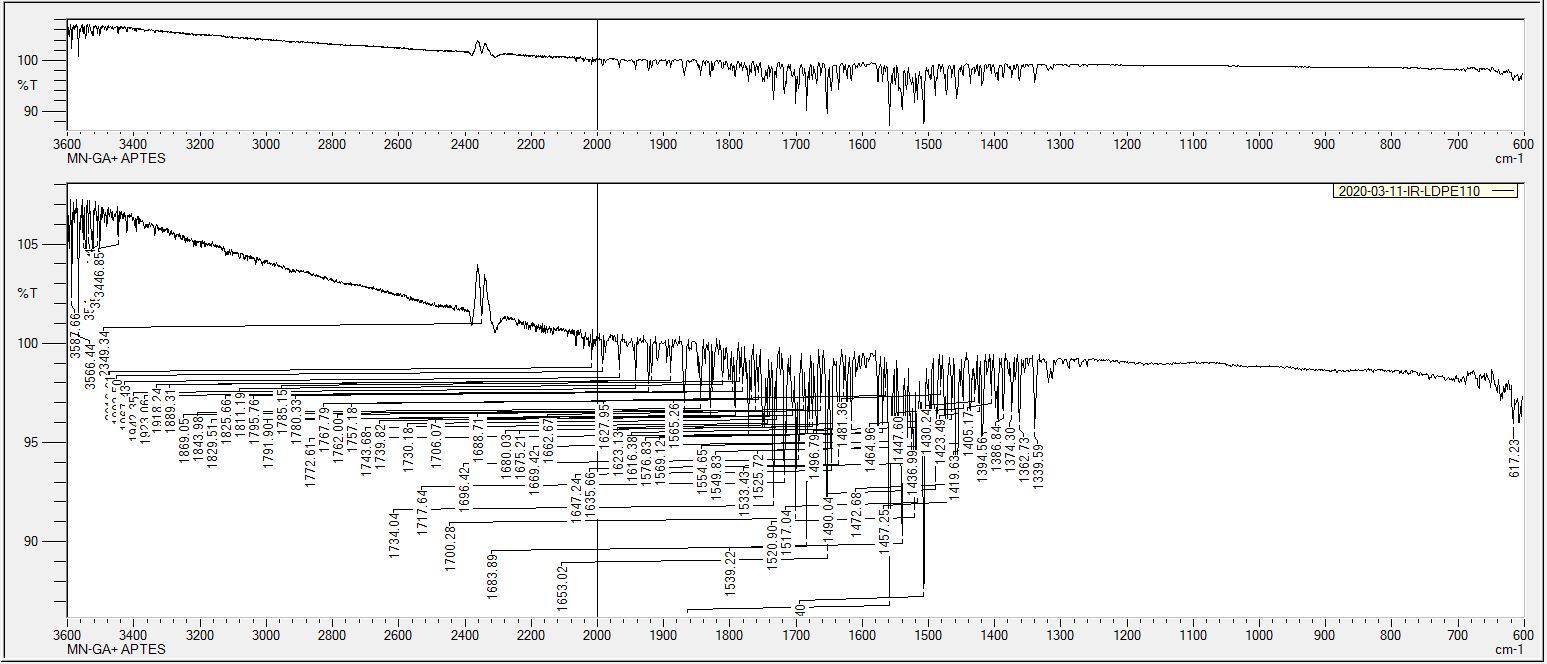
Analogous disagreements were found for PP and PET as well. Especially the Biodegradable Polymer should pose a vastly different spectra than PE or PP. But they seem incredibly similar in our data:
This seems to point to a common contaminant in all samples. As they were collected and stored separately it is likely that the machine itself was polluted with a contaminant which could not be cleaned with Isopropanol. To get insights into the possible issue the spectra of LDPE1 and AL2 were compared with the NICODOM IR library[40], the SpecrtaBase library [41], as well as the Spectral Database (SPBS) [42] from the National Institute of Advanced Industrial Science and Technology (AIST) of the government of Japan.
The first two libraries resulted in no valuable candidates, but the SPBS found hits for the compound 2-methyl-6-(2-(5-nitro-2-furyl)vinyl)-1,2,4-triazine-3,5(2H,4H)-dione, indicating that this substance might have polluted the measurements.
Sorting systems
For sorting the trash itself the use of a conveyor type mechanism could be employed[43], such as a roller cylinder system that moves to create the right path to the corresponding bin for the trash.
Data analysis
Planning
The data analysis will be done on the program Stata. First the data will be checked and cleaned. One of the questions (Why is it difficult/easy to recycle?) will need to be analysed qualitatively, the rest can be analysed quantitatively. A factor analysis could be run on the data to help determine what is best for all the users needs. Correlations of variable can give more information about the effects they have on each other.
Summary
The summary shown on the Google survey shows, that most people do want a smart bin. 39% feel sorting their waste takes too much time or effort, this is shows that their is a need for this Smart bin. Around 70% of people would like all their waste collected and around 65% of people are willing to pay extra to have all their waste collected from this is could be said that people prefer when things are easy or done for them. Currently only 65.9% recycle glass and 22% recycle metal, this can show that there is a need for our Smart bin because around 70% of people do think that recycling is important which means they want to recycle but something is holding them back. From the question ,Why is it difficult/easy to recycle?, it can be seen that many people struggle to recycle because it is difficult to find or take it to the bins. If our smart bin would be implemented in many homes maybe more services would be provided to collect these recyclables because of the money that is saved from having to sort waste, this is something that would still need to be researched and investigated.
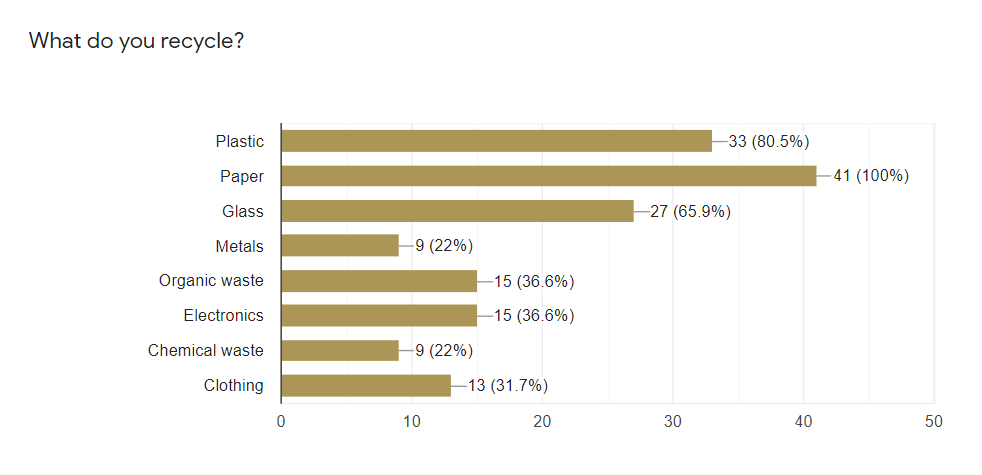
When asked about what do you recycle, 100% respondents recycle paper, most people recycle plastic and glass. The detailed result is shown in the figure below.
The minorities can be left out not only because few people recycle them, but also due to other reasons. For example, metals are usually mixed with other materials, which cannot be separated easily. Electronics are hard to detect, since they also contain different materials. Chemical wastes are very difficult to detect, and the price of Flase Negative is too high. Clothing can be easily separated manually so it is not necessary to include this type in the smart bin.
However, it does not mean only three categories are needed for the bin. One needs to be aware that not all papers can be recycled and there are also different types of plastic. Moreover, glass can be easily distinguished by people, the smart bin would not make the recycling of glass any more efficient. Combining with the information given in How the Dutch recycle, a more proper solution could be that, the bin contains four categories. One is for paper,one for PBD plastic, one for other plastics and one for wastes that cannot be recycled or detected by the bin. It is notable that, paper like cardboards should be excluded by the bin, because they can be easily sorted by people while takes too much space in a bin. The principle is that, the smart bin should not be made to detect everything, but aim to help users distinguish wastes that seem recyclable while actually are not, such as contaminated plastic, photos and milk boxes.
Analysis in Stata
The survey was closed on 19 February 2020. The data was downloaded and put into Stata, it was cleaned and then analysed. The Data analysis was done on Google drive Data analysis and only the main findings are found below.
At a first glance it is clear that there is a moderate correlation between how often people recycle and how important recycling is to them. This could mean that people want to recycle but something is holding them back. There is quite a strong correlation between how easy and how often people recycle. It can also be seen that people find recycling important but not easy to do as there is a very strong correction, this could be the something that is holding them back, it is not easy to recycle and people just may not have the ability or time to do it in the way it is currently being done. People who find it difficult to recycle seem to want our bin more as there is a strong correlation between how much you want the bin and how easy it is for you to recycle.There is a moderate negative correlation between how important it is to recycle and if they feel it takes a long time or too much effort to sort, thus a lot of people find it important and that it doesn’t take up a lot of time or effort. As this is not a strong correction there is still a need for our bin because some people still feel it does take a long time, according to the survey 39% said it takes too much time or effort.
From this we can see there there is a need for our bin and from looking at the responses about our actual product, it is clear that most people are not willing to pay too much for this product (50-100 euros). They would also not want to pay extra or too much extra to have all their waste collected, up to approximately 100 euros. A bin of 30l to 50l is best for the users needs according to their responses.
Exploratory Analysis in Python
The dataset from the survey was also analysed in Python using pandas, matplotlib and the SciKit Learn package to see if other correlations can be discovered. The full code can be viewed in a Jupyter Notebook on the same google drive (Link to download the notebook). While cleaning the data in case of multiple answers for a single question the geometric average was taken to supply a single numeric value.
One notable finding is visualized in the graph below:
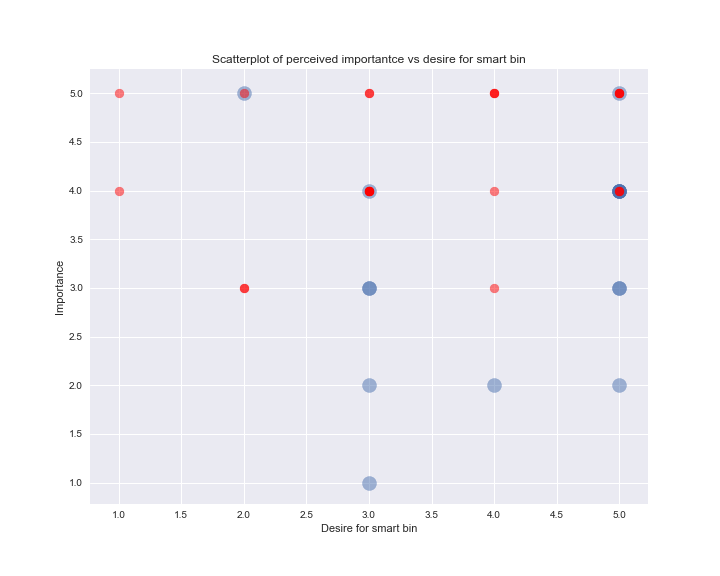
It depicts how important respondents preceived recycling vs how big their desire for the smart bin was. Additionally, red coloured dots correspond to respondents who answered that they do not find recycling too cumbersome, whereas blue coloured dot found recycling too difficult. A more opaque dot corresponds to multiple answers for a single value. The size of the dots is different for visualization purposes only and bears no statistical significance.
In the plot it is visible that mainly respondents who did not find recycling important and also found it too difficult have a strong desire for the smart bin. This defies the intuition one might have that respondents who consider recycling important have a high desire for a smart bin.
To further see if these correlations hold when asked how much respondents are willing to pay for the smart bin several linear regressions were preformed with the Seaborn library. The result is visible below:
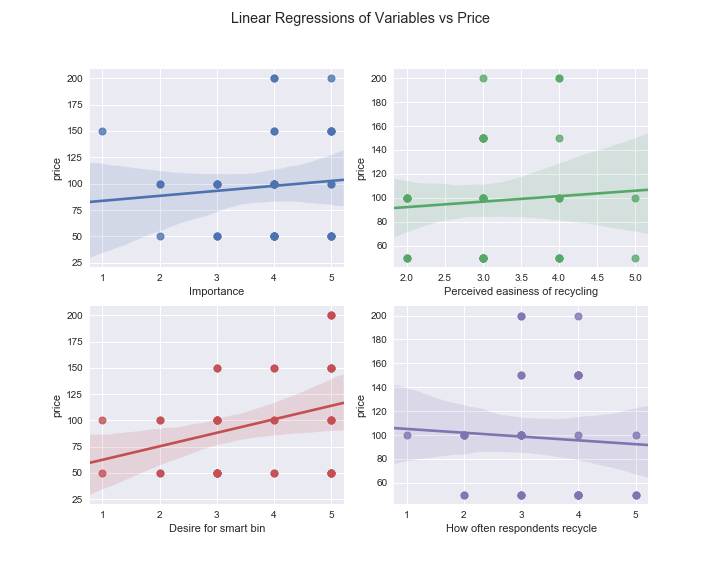
As visible by the large confidence intervals and nearly horizontal regressions in all four cases no statistically significant correlation could be found.
A further attempt to categorize the data was to perform create a model using the k-nearest-neighbour clustering algorithm. Multiple models were set with a cluster size of 2, 3 and 4 and then fitted to the data. However in all cases the normalized mean square distance from the cluster centers to the attributed data entries was larger than 10 000, clearly showing that these models were unfit for our data-set and had no predictive value.
Approach
Solving one of the recycling problem aspects has a difficult set of objectives: first, the team must evaluate if a smart trash can is a suitable solution or if there are easier ways; the implementation is next in line. Our goal is to first design the bin with: all the necessary instructions, design of the smaller components, draw the circuits, write the code; everything necessary to build the smart bin if we had the resources.
Milestones
A certain milestone of the problem is finding a suitable way, preferably non-contact, to detect the trash that is put inside the bin; choosing the method depends on dividing the type of trash in the right categories, setting certain features of trash that the bin must detect. Next, the method must ensure it takes little time such that the bin can cope with high demand. Another milestone would be to make the bin robust to deviations from the model (it can happen that 2 types of trash are scanned together or it can happen that the queue of trash to be sorted becomes too long). The biggest milestone of the project is to actually finish the development (on paper) at the end of the 2 months.
| Week number | Tasks |
|---|---|
| Week1 | Background study |
| Week2 | User survey and factory study |
| Week3 | Preliminary design, make specifications of the product |
| Week4 | Design and make model, chose sensors, decide which part to focus on, study on sensors |
| Week5 | Second survey for feedbacks |
| Week6 | Test sensors/actuators and mount to the bin (if applicable) |
| Week7 | Validation of the design, analyze limitations and prepare for presentation |
Deliverables
The output of the project should be a full description, including the methods (such as pseudocode) for implementing the idea. The description should ensure that anyone who will read it, follow the steps and buy the necessary parts can build the smart trash bin. This might change due to the complexity of the project to simply finding the right method to sort the trash by categories.
Development
Hazards
This part has been merged into Product specifications.
Product specifications
The principle is that, the smart bin should not be made to detect everything, but aim to help users distinguish wastes that seem recyclable while actually are not, such as contaminated plastic, photos and milk boxes. The detailed requirements can be found in this file: Requirements
Size
51.2% of responses in the survey claimed the desired size of the bin is 30 litres, and the same percentage have chosen 50 litres (there were more options and therefore the percentage does not add up to 100%). This is a clear preference since about 19.6% of the responses include other sizes: around 5% would choose a smaller size of 10l which is not feasible for our design. The trend is explainable, the most preferred sizes usually feature in the main trash can of the household, usually placed in the kitchen where most mixed waste is disposed of. The result complies with our vision perfectly since that main bin of the household, exchanged with a smart bin would make the most impact on the recycled quantities.
Number of baskets
Since there is limited space in the trash bin, it was decided that certain categories do not need to be recycled by the device, but it would be more effective if they are recycled directly by the user. For example, cardboard is usually very voluminous and easy to categorise; for this reason, it would be more space-efficient if it was not included in the smart bin categories. The survey has shown that 100% of people who responded already recycle it and this is for good reasons: it is easy to save, it is made of light material and most importantly, it already gets collected every 2 weeks (In the Netherlands). In case of glass, only 65.9% of our sample recycle it and this can be due to the fact that glass is a heavy material which must be transported to the collection points: since it is easy to categories in the three types (white, brown and green glass) and is also voluminous, the better solution than a smart bin can be more collection points in the city, which will facilitate the transportation of glass from the house to the designated bins and make use of the willingness of people to recycle it. Electronic, clothes and chemical waste will be left out since there are hazardous materials and must be dealt with carefully (for instance, simply puncturing a battery can cause a fire). This waste is rare and the risk of fire or contamination is too high in case of electronics and chemical waste. About clothes, not that many people recycle them, the numbers show 31%. This might be due to the lack of collection points which are usually in stores. Sometimes clothes are thrown away in waste because they cannot be donated (they have holes or the material is ripped) and people do keep clothing for longer periods. A solution to this is public awareness: as long as people know the need to recycle these categories and know which stores accept them, then the percentage might change on its own. For now, it is not of maximum utility to use the space of a smart bin for rare waste.
Sketching
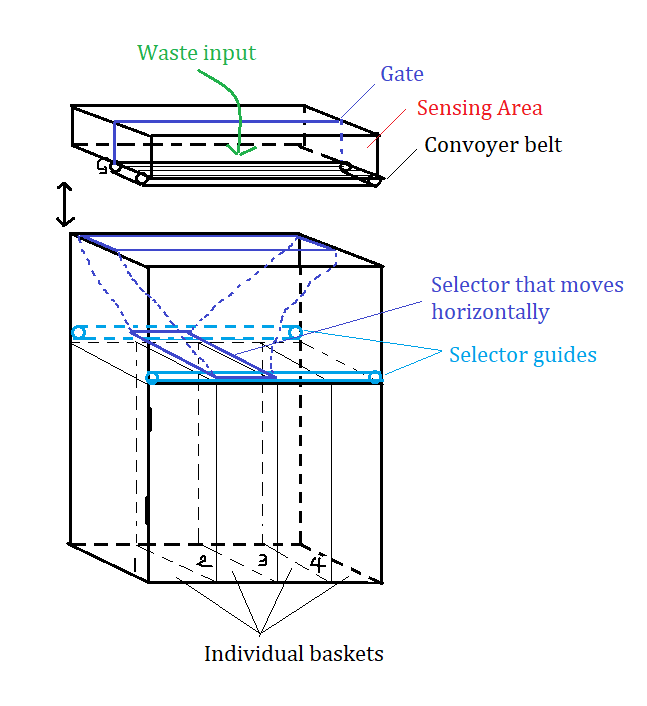
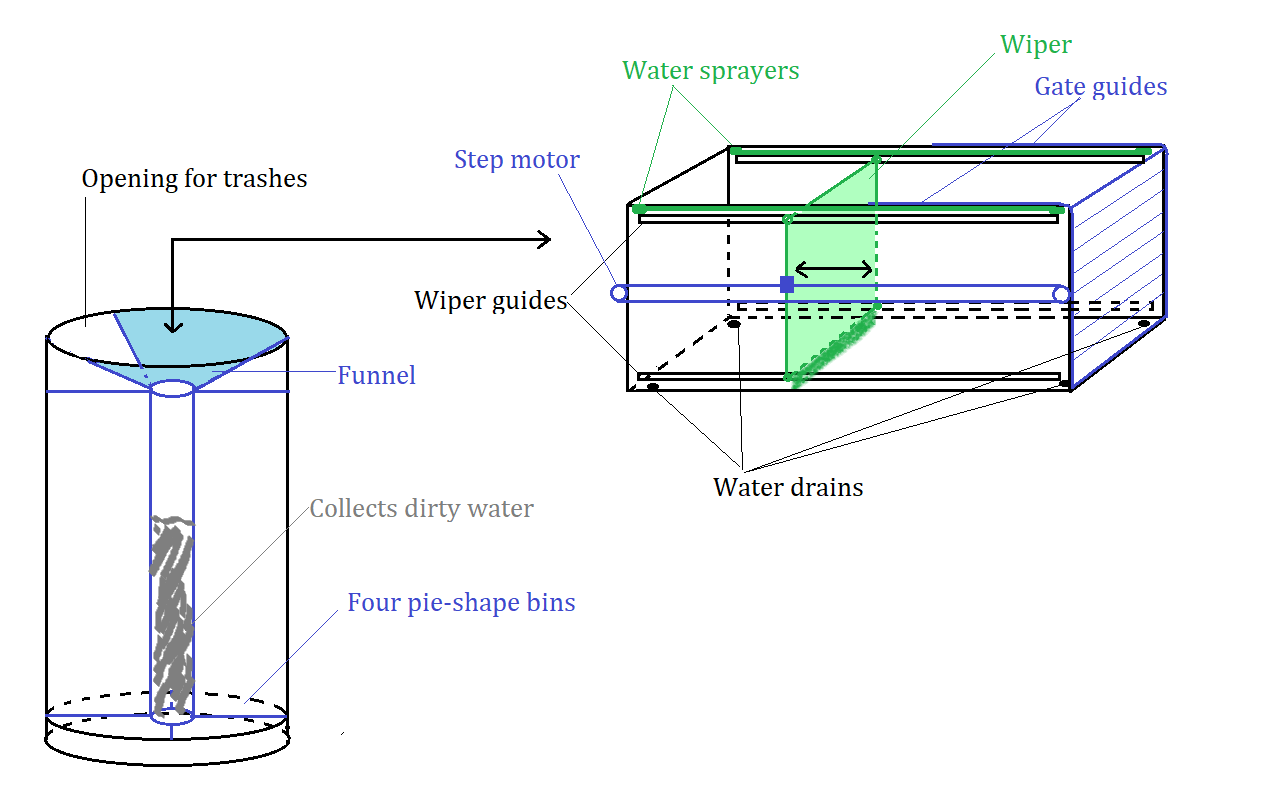
The sketching version 2.0 is shown below.
A sketch of the new design version 3.0 is given. The difference of this design is that, although version 3.0 has more complicated mechanical structure, it is easier to achieve self-cleaning.
Cleanboy 3.0
A description of model Cleanboy 3.0 can be the procedure steps that happen when an item is thrown in the smart bin:
- Throw the item in the trash.
- Cover the opening with the sliding inner wall.
- Scan the trash.
- Once the object is detected, select the right trash container for its category and start moving the containers.
- Start pushing the item with the moving wall until it reaches the end of the floor.
- The item will fall in the container.
- Move back the moving wall and the sliding unit.
- Sense if any object is stuck in the funnel.
- After the process is finished, check the queue first for automatic cleaning, then for another item. If no cleaning is requested, repeat all steps from 2-9. Otherwise, continue with step 10.
- Water sprayers receive water from the tap and they spray it across the bottom of the box.
- The moving wall swings between the two sides to clean with the brushes (no rubber required).
- The water supply stops in about t1 minutes.
- After the water supply stops, the wall still needs to brush the water away for a few more minutes (t2).
- The sprayed water drains down the funnel. Then the residual water is pumped out to the dirty water pipe that goes to the city system.
Side notes:
- The funnel collects the dirty water which can carry larger objects (for example seeds), therefore the disposed water should first be filtered of these large residues. This can be done by placing a strainer on top of the tube of the funnel.
- Time t1 and t2 can be found empirically.
- Step 14 can be improved to make the device more energy efficient: instead of using energy to pump the water out (like a washing machine), the drain can simply be connected to the lowest pipe system, just like the shower. Moreover, the valve to the sewing system does not have to open all the time, but it can be released only when enough water has gathered so only when a certain level in the reservoir was reached. The release system can be controlled in various ways, but they are all subjected to flaws:
- humidity sensor: the sensor would say when it is wet or not. If there is water on the pipe/tube, then the sensor would output 1, but this can happen also after the water has been released since the sensor will still be wet (it takes time to dry).
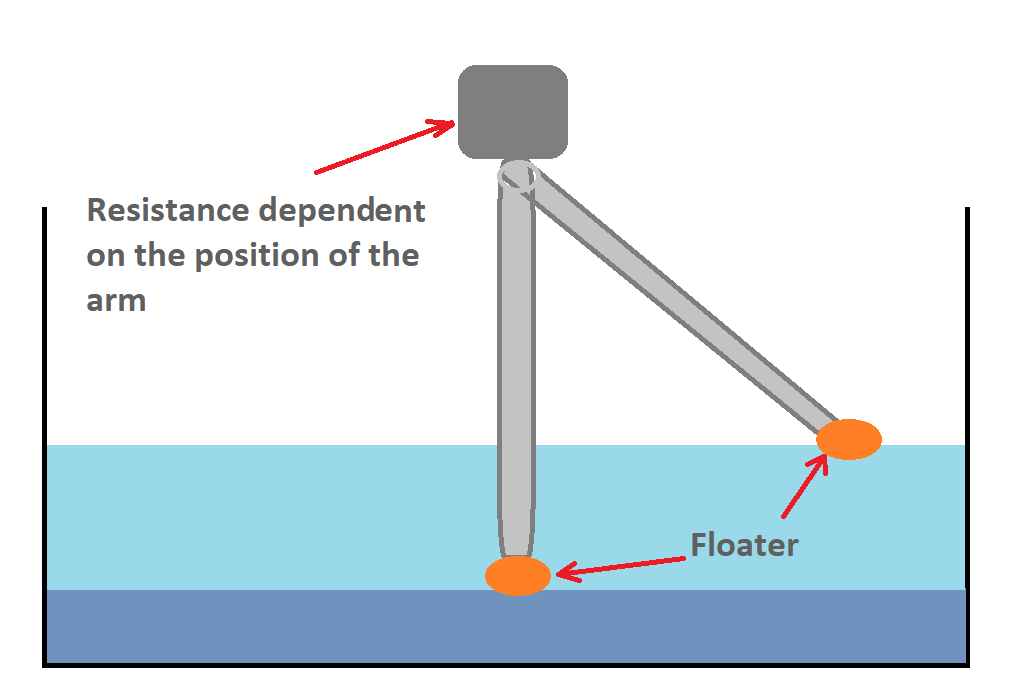
- floater; One idea to detect the water level is with a floater, like the level of fuel in the tank of the car is detected. As the level rises, the resistance seen by the gauge changes. This is illustrated in the image below.
 The same idea can be applied to the water tube:
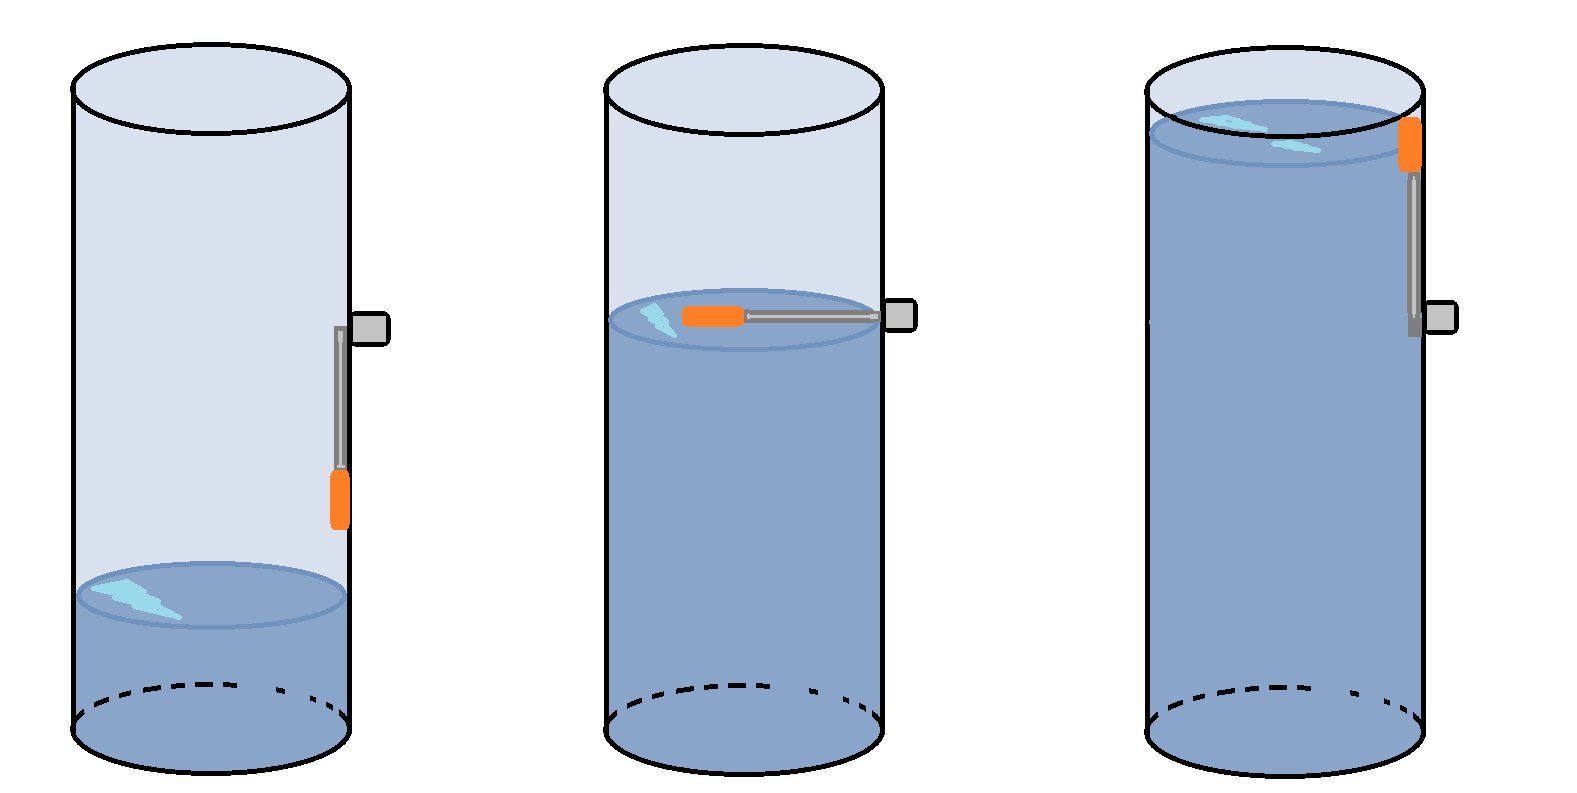 Unfortunately, this method is not reliable due to two reasons. Firstly, if the water level will rise very fast, the middle stage might not be observed and the first and third ones are the same. Secondly, the mechanism might not be as reliable on a small scale as on a normal scale (size used in cars).
- camera; Another idea would be to use a camera and a red ball in the tunnel. In this way, the camera should observe when the redpoint gets closer, but cameras are expensive and in this case, there is no light so an additional light is a must. Anyway, these seem that would bring more flaws than a more simple solution than the ones mentioned before.
- switch: as the water level rises, the contact would be brought to the right place as in the below picture:
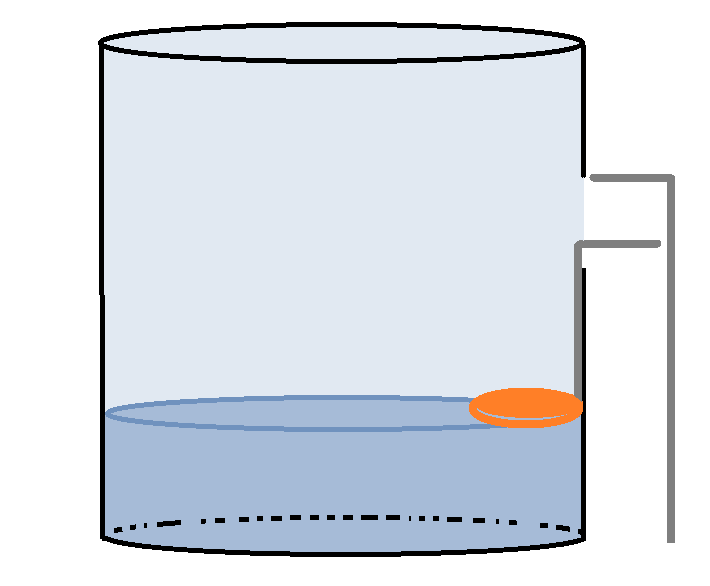 Unfortunately, this can cause an even worse problem if the water level rises too fast: leakage in the circuitry. To solve the problem of the gap, one can place a rubber instead of the gap in the wall and replace the metal part of the switch with a lever. The lever touched the metal part outside the tube and as the water rises, the right half of the lever is pulled down and the contact is detached.
- water tank: the idea used in the fuel gauge for cars would work on a larger scale, which can happen in this design as well if a water tank is added under the containers, at the very bottom. Therefore the residual water can be discharged when the tank is full and at that time also the cleaning process can stop.
Bonus points of the design:
- The sliding door that moves over the scanning cavity ensures darkness for the scanner and offers protection for the user from the light, which can be harmful when exposed many times to it.
Drawbacks:
- Using a strainer to block the larger object would help to keep the tunnel unblock. If this happened, it would result in a huge problem since the tube of the funnel should be narrow. If the tunnel was large, then it would take too much space that could instead be used as extra volume for the trash containers. Therefore as the tunnel is narrow, if any object was stuck in there, unblocking it would become a very difficult task even with user intervention (the stuck object should be pulled up or pushed down the tunnel after taking apart the bottom and reaching it would also be difficult). The strainer plays an important role, but it creates another flaw. The water only goes through the funnel and then it is directly pomped out to the drain system. If the flux of water is high and the pump is not fast enough or the canal gets blocked somehow (maybe residue on the walls of the tube) or if the large objects that were stopped at the strainer would lade the flow of water, then there might be more and more water gathering on top of the strainer; when there is too much water that cannot flow through, it will reach the level of the gap on the side of the funnel (through which trash falls through) and pour into the container.
- The device should be as compact as possible, and this requirement is not fully satisfied since the control box (that contains the scanner) is above the funnel and space between the two does not serve as any purpose.
- After the scanning, the control sends the decision in what mode all trash containers should rotate so that the right one is below the gap of the funnel. That means that after each item is thrown in the trash, more and more energy is used to move the larger mass of trash. This seems impractical since more energy is used for this than just rotating the funnel or the control box each time. On the other hand, the mechanism that would move the trash containers might be more robust than rotating the control box (there will be many wires and the control box should stay stable since it is the connection with the "outer world") or the funnel (the funnel would rotate on the same principle as the containers since they both have circular shapes, but the rail of the funnel has more chances of getting dirty and therefore fail due to some blockage).
- The funnel itself and the edges of the funnel and of the floor of the box will never be really clean. In order to make the bin sparkling, the user will always need to do it themselves.
- Moving all the containers can raise another problem: loose of balance. In order to ensure fast functioning of the sorting process, the rotation must be fast. In the worst case, only one of the containers will be completely full and rotating it with high speed might give it a large momentum and a high centrifugal force; the latter could cause the object to move and be noisy (like a washing machine in the drying mode). Unfortunately, this scenario can easily happen after throwing just some of the trash bags away (because it is collection day for example).
- Automatic cleaning means the
- Time of the self-cleaning might really depend on the type of trash thrown in. For example, biological trash will cause more residue than plastics. Some people use fresh vegetables when preparing food, others use pre-cut produces and therefore make less mess. Ideally, the users should be able to start and stop the process whenever they want. Unfortunately, this implies that the user has to see the surfaces inside and this can be done by using transparent plastic as a case for the mechanism. If the case of the trash was transparent, it would look inesthetic and this would not protect the user from the infrared light.
- Since the design features 4 water strains, there is no point in having the tube of the funnel in the middle of the containers, which makes the system more prone to faults; the residual water can as well be redirected to the side with no other consequences.
References
- ↑ 1.0 1.1 Ilene J. Bush-Vishniac, Eletromechanical Sensors and Actuators, Date accesed: 2020-02-09 www.parker.com › LPCE › function-fittings .
- ↑ 2.0 2.1 Pneumatic Sensor fittings Datasheet, (Springer, 1999).
- ↑ 3.0 3.1 Y Shigeta, S Hayano, Y Saito, Magnetic sensor signal Analysis, (International Journal of Electromagnetics and Mechanics, 2001/2002).
- ↑ 5 reasons to choose Induction over Hall Effect sensors, Date accesed: 2020-02-09 https://www.gillsc.com/newsitem/45/5-reasons-choose-induction-over-hall-effect-sensors.
- ↑ 5.0 5.1 Darran Kreit, Inductive verses Capacitive sensors, (Elsevier, 2013).
- ↑ 6.0 6.1 K Nakamura, Ultrasonic transducers : materials and design for sensors, actuators and medical applications, Part 3,
- ↑ 7.0 7.1 7.2 7.3 Sharma, N., Singha, N., & Dutta, T. (2015). "Smart Bin Implementation for Smart Cities". http://www.ijser.org. 5. Published: International Journal of Scientific & Engineering Research, 6(9).Date accessed: 2020-02-08.
- ↑ 8.0 8.1 Thomas, C., Slater, R., Leaman, J., & Downing, P. (n.d.)." What Makes People Recycle? An Evaluation of Attitudes and Behaviour in London Western Riverside. 11. Date accessed: 2020-02-09.
- ↑ 9.0 9.1 Roberts, F. (2017)."Smart bin from Polish start-up Bin-e set to sort UK recycling problems.https://internetofbusiness.com/smart-bin-bin-e-recycling/. Date accessed: 2020-02-05.
- ↑ 10.0 10.1 Ramson, S. R. J., & Moni, D. J. (2017)." Wireless sensor networks based smart bin.https://doi.org/10.1016/j.compeleceng.2016.11.030. 17: 337-353. Date accessed: 2020-02-08.
- ↑ 11.0 11.1 Peco-InspX. Detecting Plastics with X-Ray Inspection Systems. Date accessed: 2020-02-05. https://www.peco-inspx.com/blog/x-ray-detectable-plastics/
- ↑ 12.0 12.1 Sol M. Gruner.(2012). "X-ray imaging detectors" https://physicstoday.scitation.org/doi/10.1063/PT.3.1819 Pulisher: American Institute of Physics. Date accessed: 2020-02-06
- ↑ Cite error: Invalid
<ref>tag; no text was provided for refs namedXray imaging - ↑ 14.0 14.1 Schroer, Christian G. (2011). "X-ray imaging: The chemistry inside". Nature. 476: 159-160. https://www-nature-com.dianus.libr.tue.nl/articles/476159a Date accessed: 2020-02-06
- ↑ 15.0 15.1 Liu, Ying-Ho; Lee, Anthony J.T.; Chang, Fu. (2012). "Object recognition using discriminative parts". Computer Vision and Image Understanding. 116: 854-867.
- ↑ ,https://en.wikipedia.org/wiki/Recyc,ling_in_the_Netherlands , Recycling in the Netherlands, Date accessed: 2020-02-14.
- ↑ ,https://www.eindhoven.nl/en/city-and-living/living/waste-recycling, WASTE & RECYCLING, Date accessed: 2020-02-15.
- ↑ ,https://www.cure-afvalbeheer.nl/en , Cure Afvalbeheer, Date accessed: 2020-02-15.
- ↑ , Maarten Goorhuis, Pieter Reus, Ellen Nieuwenhuis, Natascha Spanbroek, Mario Sol, Jørgen van Rijn,(2012) https://journals.sagepub.com/doi/10.1177/0734242X12455089 , New developments in waste management in the Netherlands, Date accessed: 2020-02-15.
- ↑ ,https://wilkinsonchutes.ca/ , Wilkinson Chutes, Date accessed: 2020-02-20.
- ↑ Paulien de Jong, Maarten Wolsink "THE STRUCTURE OF THE DUTCH WASTE SECTOR AND IMPEDIMENTS FOR WASTE REDUCTION" Waste Management & Research (1997) 15, 641–658
- ↑ https://business.gov.nl/running-your-business/environmental-impact/waste/producer-responsibility/, Dutch government, Date accessed: 2020-02-19
- ↑ https://www.environmental-expert.com/waste-recycling/companies/location-netherlands, Environmental XPERT, Date accessed: 2020-02-20
- ↑ https://www.wastematters.eu/uploads/media/DWMA_wasteforum_Netherlands_imports_more_waste_sept_2011.pdf , Wastematters, Date accessed: 2020-02-21
- ↑ https://www.conserve-energy-future.com/recyclingmetal.php, Conserve energy future, Date accessed: 2020-02-19
- ↑ R.W.J. McKinney, "The Technology of paper recycling", Springer, 1997
- ↑ Chongrak Polprasert, "Organic Waste Recycling - Technology and Management", IWA Publishing, 2007
- ↑ Azeem Khalid, Muhammad Arshad, Muzammil Anjum, Tariq Mahmood, Lorna Dawson, "The anaerobic digestion of solid organic waste", Waste Management, Volume 31, Issue 8, 2011, Pages 1737-1744
- ↑ https://www.enfrecycling.com/directory/plastic-plant/Netherlands, ENF recycling, Date accessed: 2020-02-22
- ↑ https://www.milieucentraal.nl/minder-afval/afval-scheiden-cijfers-en-kilos/ , Milieucentraal, Date accessed: 2020-02-19
- ↑ Kaiser, K.; Schmid, M.; Schlummer, M. "Recycling of Polymer-Based Multilayer Packaging: A Review." Recycling 2018, 3, 1.
- ↑ Mary E.Coles. (1999). "8. X-Ray Imaging". https://doi.org/10.1016/S0076-695X(08)60419-6 . 35: 301-336. Date accessed: 2020-02-08.
- ↑ D M Scott 1995 Meas. Sci. Technol. 6 156 ‘A two-colour near-infrared sensor for sorting recycled plastic waste’
- ↑ Iñigo Vegas, Kris Broos, Peter Nielsen, Oliver Lambertz, Amaia Lisbona, Upgrading the quality of mixed recycled aggregates from construction and demolition waste by using near-infrared sorting technology, Construction and Building Materials, Volume 75, 2015, Pages 121-128, ISSN 0950-0618, https://doi.org/10.1016/j.conbuildmat.2014.09.109.
- ↑ Offer Rozenstein, Eldon Puckrin, Jan Adamowski, Development of a new approach based on midwave infrared spectroscopy for post-consumer black plastic waste sorting in the recycling industry, Waste Management, Volume 68, 2017, Pages 38-44, ISSN 0956-053X, https://doi.org/10.1016/j.wasman.2017.07.023.
- ↑ A. C. Karaca, A. Ertürk, M. K. Güllü, M. Elmas and S. Ertürk, "Automatic waste sorting using shortwave infrared hyperspectral imaging system," 2013 5th Workshop on Hyperspectral Image and Signal Processing: Evolution in Remote Sensing (WHISPERS), Gainesville, FL, 2013, pp. 1-4. doi: 10.1109/WHISPERS.2013.8080744
- ↑ Masanori Kumagai, Hideto Suyama, Tomoaki Sato, Toshio Amano, and Nobuaki Ogawa, "Discrimination of Plastics Using a Portable near Infrared Spectrometer," J. Near Infrared Spectrosc. 10, 247-255 (2002)
- ↑ https://www.sigmaaldrich.com/technical-documents/articles/biology/ir-spectrum-table.html#ir-spectrum-table-by-range , Spectroscopy table from Sigma Aldrich, Accessed on 09-03-2020
- ↑ Wong, J. & Gan, Seng Neon & Aishah, M.. (2011). Chromium(III) Based Ziegler-Natta Catalysts for Olefin Polymerization. Sains Malaysiana. 40. 771-779.
- ↑ http://www.nicodom.cz/ , NICODOM, library version from 02-2020
- ↑ https://spectrabase.com/ , Spectra Base, accessed on 10-03-2020
- ↑ https://sdbs.db.aist.go.jp/ , Specrtal Database from the AIST, accessed on 10-03-2020
- ↑ Kyle Eubanks, Sorting Through Sorters: Your Guide to Sortation Conveyor. Bastian Solutions. Date accessed: 2020-02-08 https://www.bastiansolutions.com/blog/sorting-through-sorters-your-guide-to-sortation-conveyor/
