Mobile Robot Control 2024 HAL-9000: Difference between revisions
Tag: 2017 source edit |
Tag: 2017 source edit |
||
| Line 289: | Line 289: | ||
====2.2 Re-sample the particles==== | ====2.2 Re-sample the particles==== | ||
#''''What are the benefits and disadvantages of both the multinomial resampling and the stratified resampling?''' | |||
#'''With each particle having N >> 1 rays, and each likelihood being ∈ [0, 1], where could you see an issue given our | |||
current implementation of the likelihood computation?''' | |||
=====2.3 Test on the physical setup ===== | =====2.3 Test on the physical setup ===== | ||
Revision as of 11:48, 5 June 2024
Group members:
| Name | student ID |
|---|---|
| Salim Achaoui | 1502670 |
| Luis Ponce Pacheco | 2109417 |
| Nienke van Hemmen | 1459570 |
| Aniek Wigman | 1463535 |
| Max Hage | 1246704 |
| Max van der Donk | 1241769 |
Exercise 1: Non-crashing robot
For the first exercise, the goal was to ensure that the robot does not move through walls in the simulation and not crash into the walls in both the simulation and the real world. To solve this matter, there were multiple solutions. The first solution collects all of the data from the lasers and stops the robot when it reaches a wall. A second solution also uses this notion but instead of stopping the robot, the robot turns away from the wall. These solutions were then tested on the robot in real life. After testing, it became clear that, although stopping the robot was not an issue, the robot was not able to move along a wall in parallel. This issue occurred since the sensor data was taken uniformly. So on all sides, the robot would stop with the same threshold. Therefore, a third solution was made that took the orientation of the sensor data into account for the robot to move alongside a wall. The details of the solutions will now be covered in more detail.
Solution 1
For the first solution, we utilize the laser data that the robot has. This contains data as to how far a wall or object is to the robot at a certain angle. For each angle, we check whether the robot is too close to an obstacle, thus within range x. If it is, it stops moving. Else, it keeps on going forward.
Solution 2
For the second solution, the first solution was expanded. Instead of just stopping, the robot now rotates until no obstacle is close to the robot anymore, and it moves forward again.
Solution 3
This solution is also an expansion of solution 1. In this expansion, the size of the robot is taken into account aswell. This solution was created after testing the robot physically. We came to the realisation that the size of the robot is not taken into account. Therefore, in the script an offset was included such that the body of the robot does not bump into the wall. using the line: scan.ranges[i] < minDist + robotWidth*abs(sin(currentAngle) we introduce an offset by adding the sinusoid of the current angle, which is approximately the circular body of the robot. Because the laser of the robot is approximately in the middle of its body, the sinusoid creates a proper offset to not bump into a wall anymore.
Questions:
- On the robot-laptop open rviz. Observe the laser data. How much noise is there on the laser? What objects can be seen by the laser? Which objects cannot? How do your own legs look like to the robot.
- Take your example of don't crash and test it on the robot. Does it work like in simulation? Why? Why not? (choose the most promising version of don't crash that you have.)
- If necessary make changes to your code and test again. What changes did you have to make? Why? Was this something you could have found in simulation?
- Take a video of the working robot and post it on your wiki.
For local navigation, 2 different solutions had to be introduced for the restaurant scenario. We have chosen for artificial potential fields and vector field histograms because these solutions seemed the most robust to us. In this parahraph the 2 solutions will be explained.
Artificial potential fields
Artificial potential fields are self-explanatory: they portray the potential fields around an object. A field can either be repulsive or attractive. The reason for being artificial is because these fields do not exist in the real world. In the real world, an object does not push the robot away or pull the robot towards it. In a simulation, however, artificial potential fields can be drawn such that a robot avoids certain objects and gravitates toward others. In this particular case, the robot is drawn towards the goal and repulsed by obstacles that are in its way. The distance between the robot and the goal or obstacle dictates the strength of the field around it. When an obstacle is close, for example, the repulsion force should be higher than the attraction force and high enough to repulse the robot away from the obstacle. This dependency on distance can be seen in the formulas for the two fields. For the implementation, the following source was used: [1]
The artificial attraction potential is dependent on an attraction constant and the distance between the robot and the goal.
[math]\displaystyle{ U_{\text{att}}(x) = \frac{1}{2} k_{\text{attr}} \rho^2 (X, X_g) }[/math]
With the following:
- [math]\displaystyle{ K }[/math]: positive scaling factor.
- [math]\displaystyle{ X }[/math]: position of the robot.
- [math]\displaystyle{ X_g }[/math]: goal of the robot.
- [math]\displaystyle{ \rho(X, X_g) = \| X_g - X \| }[/math]: distance from robot to goal.
This is used in superposition with the repulsion field created with the following formulas:
The repulsive potential field is described by:
[math]\displaystyle{ U_{\text{rep}}(X) = \begin{cases} \frac{1}{2} \eta \left( \frac{1}{\rho(X, X_0)} - \frac{1}{\rho_0} \right)^2 & \text{if } \rho(X, X_0) \leq \rho_0 \\ 0 & \text{if } \rho(X, X_0) \gt \rho_0 \end{cases} }[/math]
- [math]\displaystyle{ \eta \gt 0 }[/math]: positive scaling factor.
- [math]\displaystyle{ \rho(X, X_0) }[/math]: the minimum distance (robot and obstacles).
- [math]\displaystyle{ \rho_0 }[/math]: distance influence imposed by obstacles; its value depends on the condition of the obstacle and the goal point of the robot, and is usually less than half the distances between the obstacles or shortest length from the destination to the obstacles.
Using these formulas, the following artificial potential fields were created for all maps.
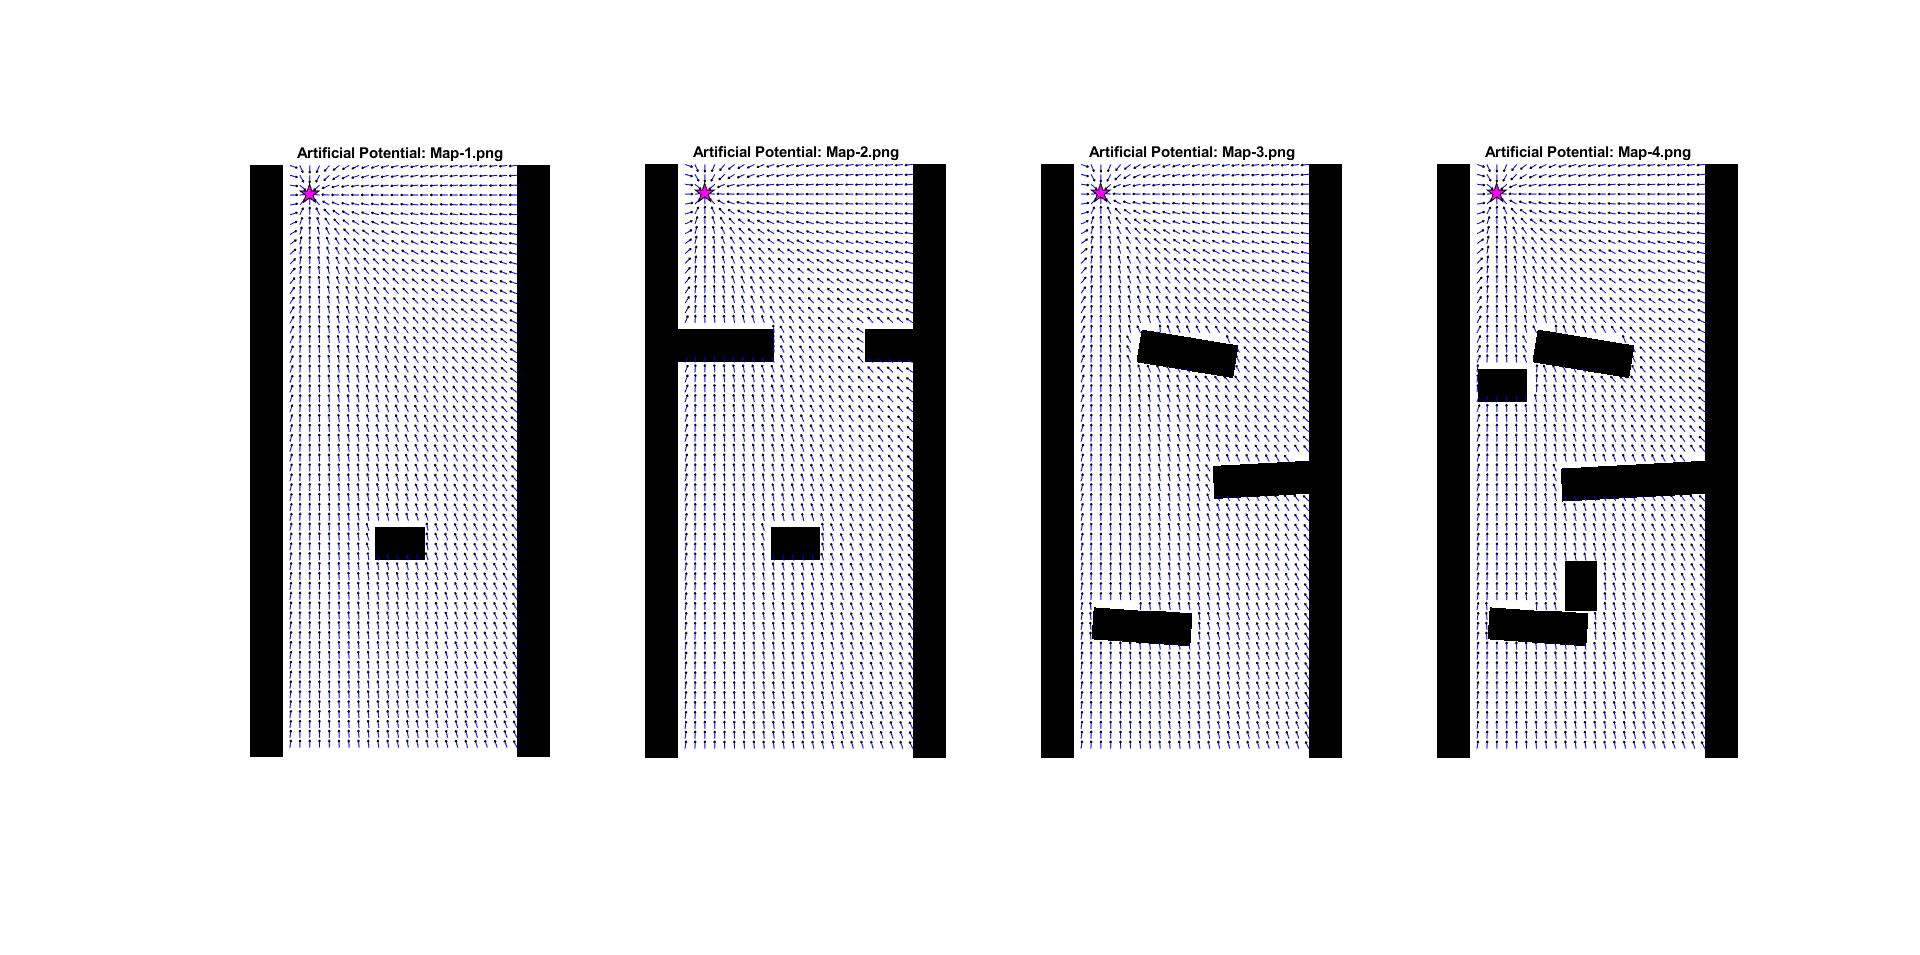
From this figure, the weakness of the artificial potential method becomes apparent: the 'local minimum' problem. This causes the robot to get stuck in places were the minimum potential does not result in a path towards the goal. There are methods to try and deal with them, but this is a fundamental problem with the technique.
For the implementation, not [math]\displaystyle{ U }[/math] is used but [math]\displaystyle{ F }[/math] to drive the robot into the direction of the potential: The attractive potential field function is described by:
[math]\displaystyle{ F_{\text{att}} = - \nabla [U_{\text{att}}(X)] = - k \rho (X, X_g) }[/math]
The repulsive force field is described by:
[math]\displaystyle{ F_{\text{rep}} = \nabla [U_{\text{rep}}(X)] }[/math]
[math]\displaystyle{ F_{\text{rep}}(X) = \begin{cases} \eta \left( \frac{1}{\rho(X, X_0)} - \frac{1}{\rho_0} \right) \frac{1}{\rho^2(X, X_0)} \hat{\rho}(X, X_0) & \text{if } \rho(X, X_0) \leq \rho_0 \\ 0 & \text{if } \rho(X, X_0) \gt \rho_0 \end{cases} }[/math]
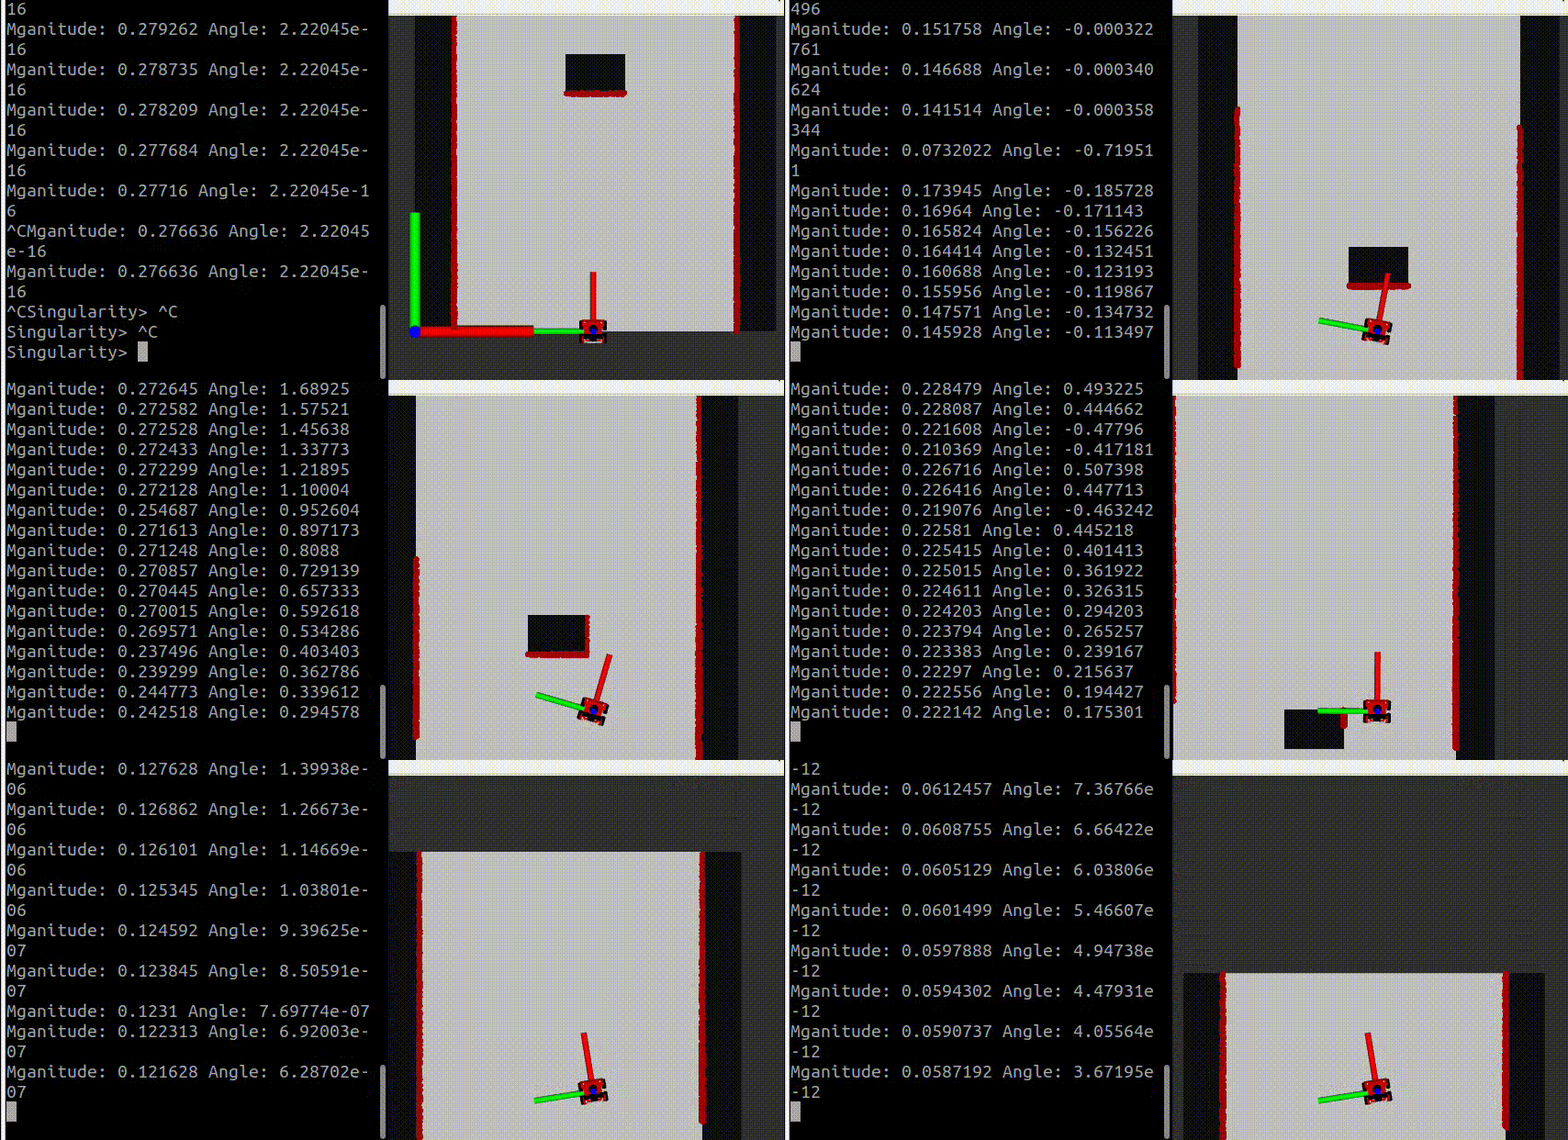
The added problem is that the robot cannot drive in any direction at any time. Therefore we have programmed it such that it rotates towards the direction before driving it with the force amplitude calculated.
In the figures bellow it can be seen how the artificial potential field method performed on the given maps.
Answers to Questions Artificial Potential Field
- What are the advantages and disadvantages of your solutions?
Advantages:
- Simplicity in implementation and understanding.
- Effective for basic obstacle avoidance and goal seeking.
Disadvantages:
- Susceptible to local minima, where the robot can get stuck.
- Not effective in highly dynamic or complex environments.
- What are possible scenarios which can result in failures (crashes, movements in the wrong direction, ...) for each implementation?
- For example, set the target position in an obstacle and let the robot try to get to the target; what happens? The robot may get stuck or oscillate around the obstacle.
- Another example: Narrow passages can cause the robot to get stuck due to strong repulsive forces from both sides.
- How would you prevent these scenarios from happening?
Possible solutions include:
- Implementing a path planner that re-evaluates the route if the robot gets stuck.
- Using a combination of potential fields and other algorithms like A* or Dijkstra’s algorithm for global path planning.
- Introducing randomness or perturbations in the path to escape local minima.
- For the final challenge, you will have to link local and global navigation. The global planner will provide a list of (x, y) (or (x, y, θ) ) positions to visit. How could these two algorithms be combined?
The combination could be implemented as follows:
- The global planner (e.g., A* algorithm) calculates a rough path from the start to the goal.
- The local planner (artificial potential fields) is used to avoid obstacles and refine the path by guiding the robot between the waypoints provided by the global planner.
- This hybrid approach ensures that the robot follows an efficient path while dynamically avoiding unforeseen obstacles.
Vector Field Histogram
Vector Field Histograms is a method to locally navigate through a space. It uses a map matrix and a polar histogram to determine where the robot can move to get to the goal. The map matrix stores cells which say that they are either occupied or not. The value in those squares then indicate the certainty that the cell is an obstacle. This map moves with the robot as an active window, where the cells in the map matrix are constantly updated just like the polar histogram which is based on the map matrix. Using the laser data of the robot, the height of the bins of the polar is determined and it is smoothed. Finally, a valley between the curves is chosen to move towards to.
Summarizing, for vector field histograms, 2 major components had to be created. Firstly, the translation from the laser data to a map that contains the coordinates of the obstacles together with a certainty value and a polar histogram, from which a minima should be chosen as direction to continue moving. These components will be explained now. Note that the x, y and angle of the robot are kept track of globally.
Obstacle map
The obstacle map is created by defining a matrix OccupancyGridMap with the height and width of the active window. Since each run items more in the map, we clear the map at the beginning of the run. Then, we look at the laser data and compute the coordinates of the obstacle using the distance retrieved from the laser data and the angle we globally keep track of.
[math]\displaystyle{ x = \frac{\sin(\theta) \cdot laser\_data[i]}{CELL\_SIZE} }[/math]
[math]\displaystyle{ y = \frac{\cos(\theta) \cdot laser\_data[i]}{CELL\_SIZE} }[/math]
Using these coordinates, in the map, the distance of the robot to the wall is put to indicate the risk factor. This value is then normalized to be in range [1,10] . This is then visualized as the following:
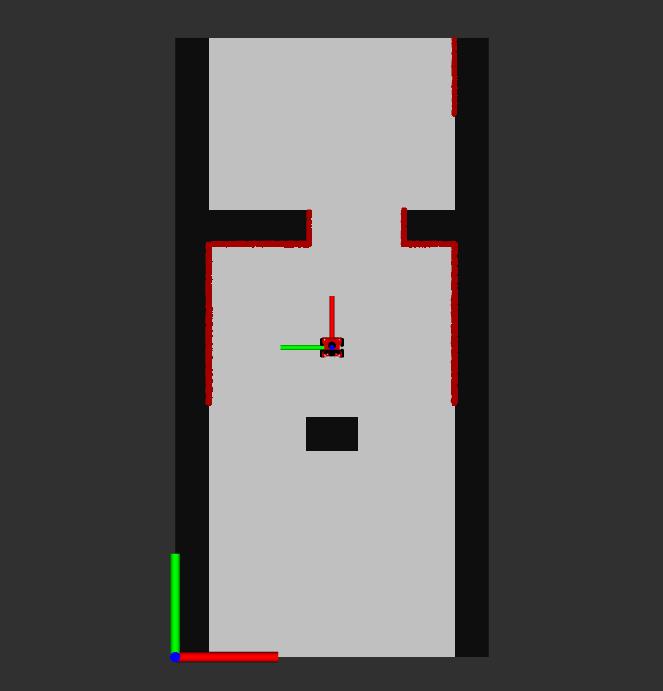
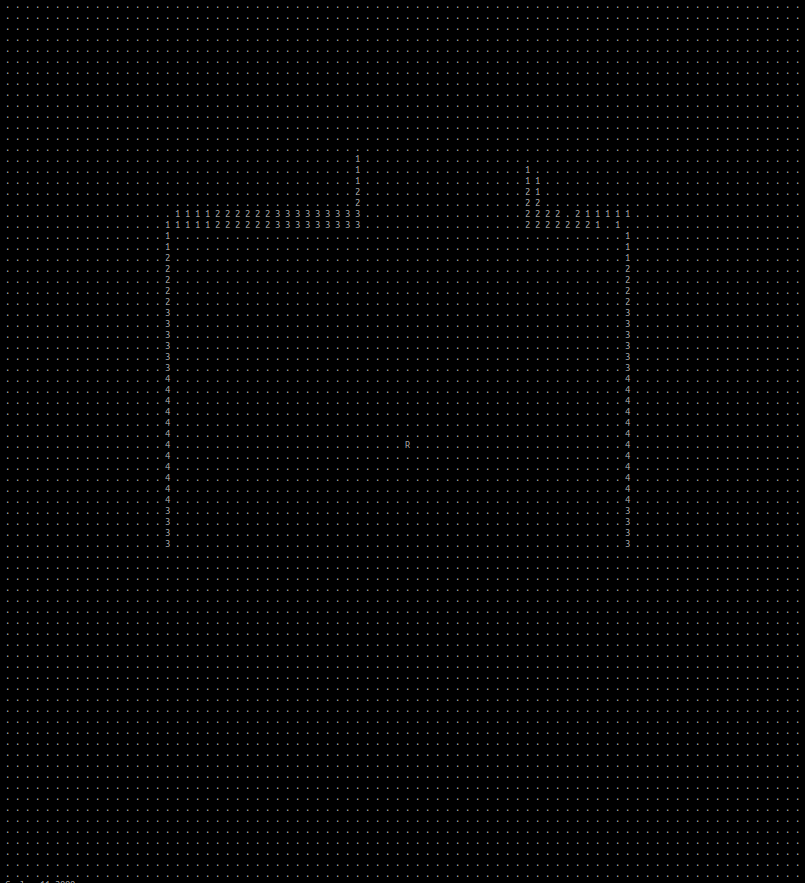
The robots size is kept into account in this distance aswell. This is done by dilating the walls in the sensor map to the robot width such that it cannot bump into the walls.
Polar Histogram
In order to create the polar historam, the article 'IEEE Journal of Robotics and Automation Vol 7, No 3, June 1991, pp. 278-288' is used, further refered as [1]. The polar histrogram is made, using the histrogram grid from the previous paragraph. An active window is chosen, with a certain width [math]\displaystyle{ w_d }[/math]. We assume a rectangular grid, hence a [math]\displaystyle{ w_d }[/math] x [math]\displaystyle{ w_d }[/math] grid. Also, it is assumed that the robot is exactly in the middel of this active grid. In order to make the polar histogram, the follow parameters are used:
[math]\displaystyle{ a, b }[/math], which are positive normalizing constants;
[math]\displaystyle{ c_{i,j}^* }[/math], which is the certainty value of cell [math]\displaystyle{ i, j }[/math];
[math]\displaystyle{ d_{i,j} }[/math], which is the distance from the robot to cell [math]\displaystyle{ i, j }[/math];
[math]\displaystyle{ m_{i,j} = (c_{i,j}^*)^2(a-bd_{i,j}) }[/math], which is the magnitude of the obstacle vector at cell [math]\displaystyle{ i, j }[/math];
[math]\displaystyle{ x_0, y_0 }[/math], which are the coordinates of the robot;
[math]\displaystyle{ x_i, y_i }[/math], which are the coordinates of cell [math]\displaystyle{ i, j }[/math];
[math]\displaystyle{ \beta_{i,j} = atan(y_0 - y_i / x_0 - x_i) }[/math], which is the angle between the robot and cell [math]\displaystyle{ i, j }[/math];
Secondly, a vector is made which stores NUM_BINS amount of items. The value of NUM_BINS is determined by size of angles. In other words, if the entire 360 degrees is divides into increments of 5 degrees, NUM_BINS would be 72. In this vector, the first element corresponds to 0 to 5 degrees, the second element 5 to 10 degrees, and so on. The magnitude of each cell is added to the correct index of the vector. To determine the correct index, the relation
[math]\displaystyle{ k = int(\beta_{i,j}/\alpha) }[/math]
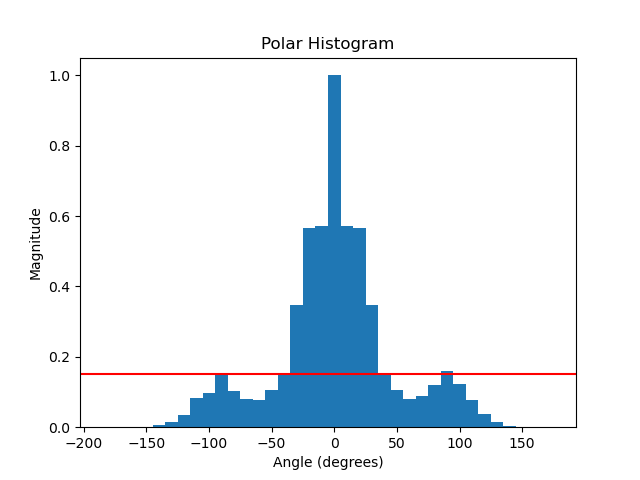
is used. This results in a vector with higher values at the indices corresponding to obstacles in that direction. Afterwards, a smoother function is used, since the angle segregation imply some false obstacle-free directions. At last, the vector is normalized to a value of 1. An example of a polar histogram in a small corridor with an obstacle in front of the robot is shown in the figure below.
Once the polar histogram is made, it is possible to determine the optimal steering angle. To do so, multiple steps need to be done. The algorithm does this in the following sequence:
1) Determine the valleys which are bellow a certain threshold. This threshold is introduced in [1], in order to avoid steering towards small corridors. A valley is a 'range' between objects. By looking at the figure below, the possible valleys are (-80, -40), (40, 80) and (100, -100) (with wrapping). Note: in the application we used 0 to 360 degrees.
2) Determine the valleys which is closest to the target goal. For example, is the targer angle is -60, the valley (-80, -40) would be chosen, as the targer lies in this valley. If the targer is 30, the valley (40, 80) is chosen, as the border of 40 is closest to this target angle.
3) From the chosen valley, determine the best angle. If the targer is within the valley, return the target. If the target is not within the valley, chose an angle which is as close as possible to the target without driving into a wall. Here, a distinct in made between wide and narrow valleys. A wide valley is has a certain width of s_max. If the optimal valley exceeds this width, and the target angle is not in the valley, the new steering angle will be determined as [math]\displaystyle{ \theta = (k_n + s_max) / 2 }[/math]. Here, k_n is the border which is closest to the target. This enables the robot to drive close to walls in a wide valley. If the valley is narrow, hence not wider than s_max, the exact middle is chosen as the new steering angle [math]\displaystyle{ \theta }[/math].
videos
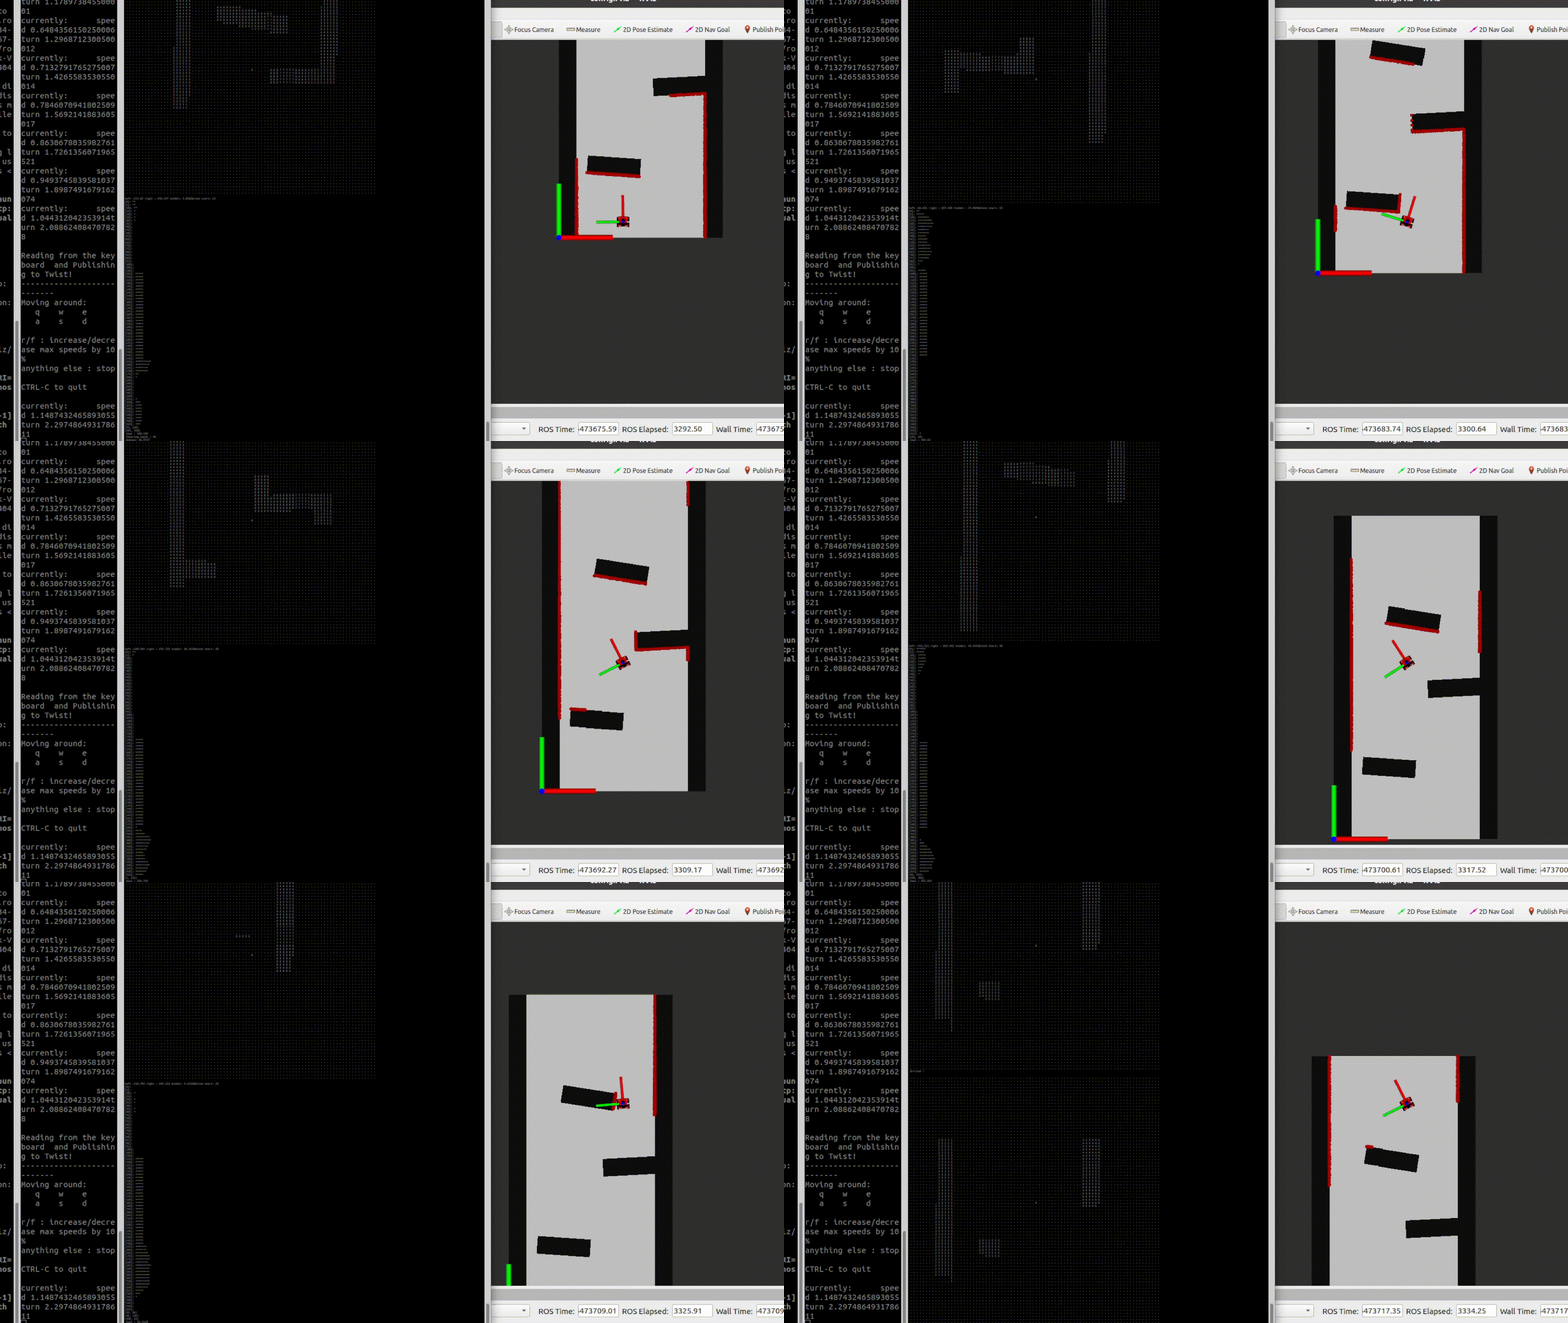
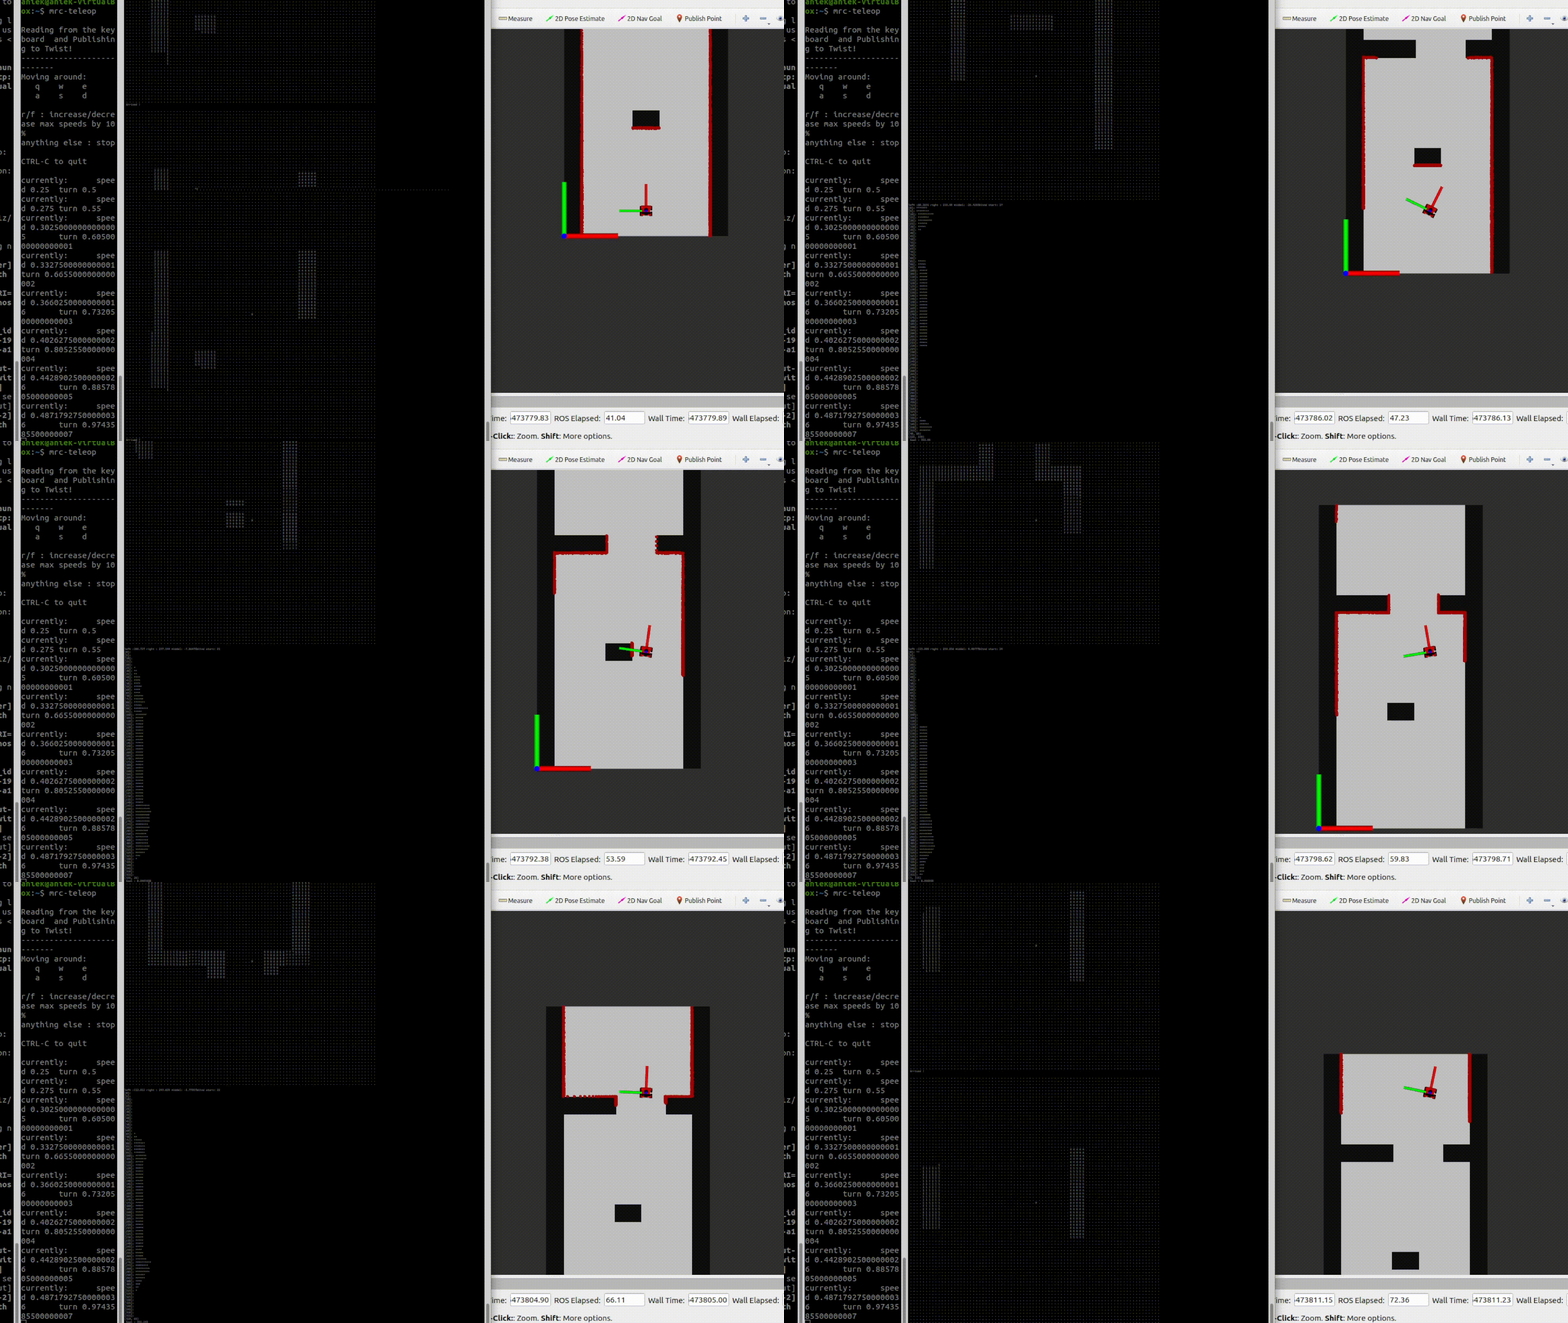
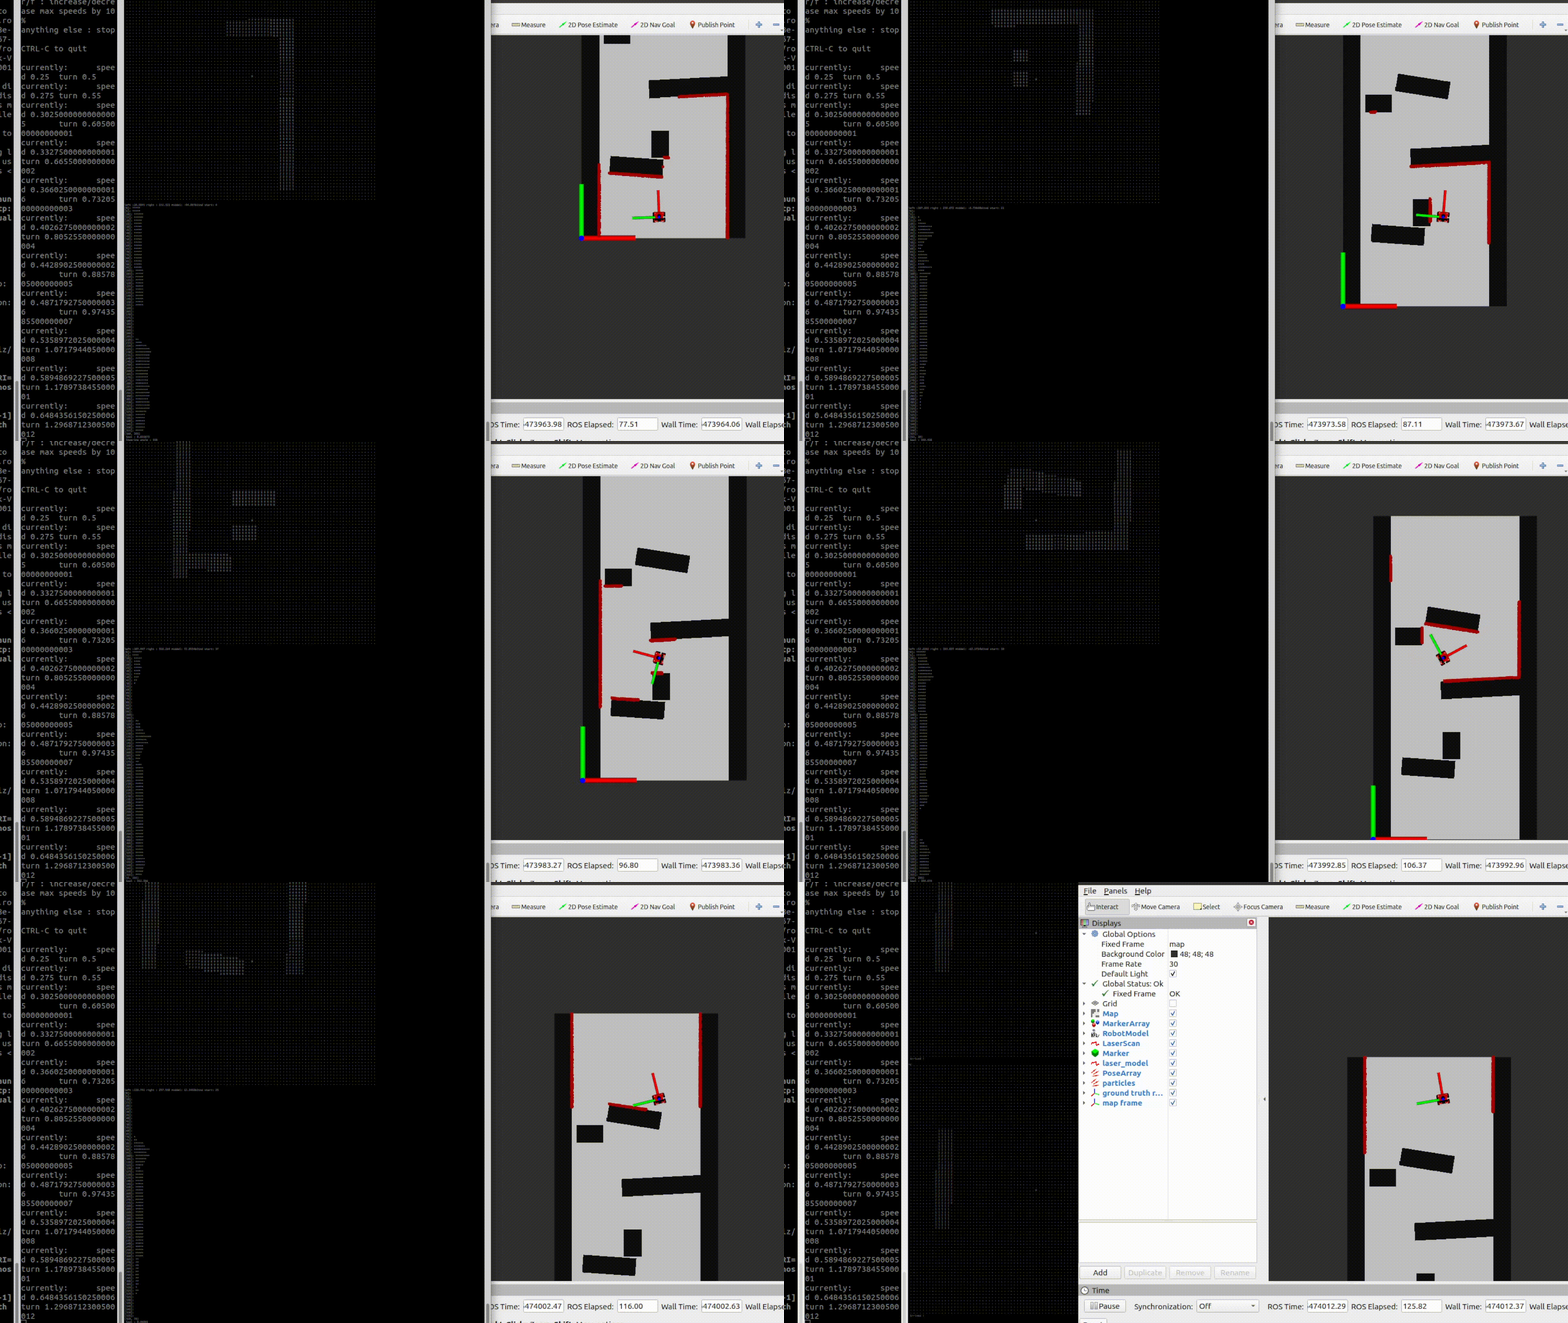
Answers to Questions Vector Field Histogram
- What are the advantages and disadvantages of your solutions?
- Advantages: Our solution is relatively robust and can usually find the route that it should take in an environment. It is intuitive as well, the polar histogram is a logical way to think of obstacles getting in a robots way.
- Disadvantages: Vector Field Histogram has a problem with narrow corridors. This is because the polar histogram can sketch it as if there is no passageway (depending on the bin size of the polar histogram). Another problem we encountered was that the robot could not choose between two valleys and kept switching between those two options.
- What are possible scenarios which can result in failures (crashes, movements in the wrong direction, ...) for each implementation?
- Narrow corridors.
- 2 paths that are equally as good will result in the robot not being able to decide between one of the passages.
- How would you prevent these scenarios from happening?
- For narrow corridors, we could introduce more bins for the polar histogram such that the map is more refined and thus can spot smaller corridors.
- Hysteresis could be introduced to fix the 2nd problem. Another implementation could be to introduce a cost function that not only takes the goal position into account but also the closest angle and the previous angle we have chosen.
- For the final challenge, you will have to link local and global navigation. The global planner will provide a list of (x, y) (or (x, y, θ) ) positions to visit. How could these two algorithms be combined?
- For our current implementation, we can give the robot a goal position towards which it will drive. These points for the robot to drive to are the nodes provided by the A* algorithm. These coordinates will serially driven towards. Once the robot cannot find a path for an amount of time or it discovers no path towards the node, it should consult the global planner again. The global planner should remove the node from the graph and find another path with the A* algorithm again, for the robot to follow. This way, the global path gets edited based on the local planners information and will ultimately get towards the goal.
- How could finding the shortest path through the maze using the A* algorithm be made more efficient by placing the nodes differently? Sketch the small maze with the proposed nodes and the connections between them. Why would this be more efficient?
- Instead of placing nodes on each cell, it would be more efficient to place nodes only
- Would implementing PRM in a map like the maze be efficient?
- The PRM places random vertices on the map
- What would change if the map suddenly changes (e.g. the map gets updated)?
- How did you connect the local and global planner?
- Test the combination of your local and global planner for a longer period of time on the real robot. What do you see that happens in terms of the calculated position of the robot? What is a way to solve this?
- Run the A* algorithm using the gridmap (with the provided nodelist) and using the PRM. What do you observe? Comment on the advantage of using PRM in an open space.
Localization
0. Assignment introduction
0.1 Explore the code framework
- How is the code structured?
- What is the difference between the ParticleFilter and ParticleFilterBase classes, and how are they related to each other?
- How are the ParticleFilter and Particle class related to each other?
- Both the ParticleFilterBase and Particle classes implement a propagation method. What is the difference between the methods?
1. Assignments for the first week
1.1 Initialize the Particle Filter
- What are the advantages/disadvantages of using the first constructor, what are the advantages/disadvantages of the second one?
- In which cases would we use either of them?
- Add a screenshot of rviz to show that the code is working
1.2 Calculate the pose estimate
- Interpret the resulting filter average. What does it resemble?
- Is the estimated robot pose correct? Why?
- Imagine a case in which the filter average is inadequate for determining the robot position.
- Add a screenshot of rviz to show that the code is working
1.3 Propagate the particles with odometry
- Why do we need to inject noise into the propagation when the received odometry infromation already has an unkown noise component?
- What happens when we stop here, and do not incorporate a correction step?
- Add a screenrecodring of rviz while driving to show that the code is working
2. Assignment for the second week
2.1 Correct the particles with LiDAR
- What does each of the component of the measurement model represent, and why is each necessary?
- With each particle having N >> 1 rays, and each likelihood being ∈ [0,1] , where could you see an issue given our current implementation of the likelihood computation?
2.2 Re-sample the particles
- 'What are the benefits and disadvantages of both the multinomial resampling and the stratified resampling?
- With each particle having N >> 1 rays, and each likelihood being ∈ [0, 1], where could you see an issue given our
current implementation of the likelihood computation?
2.3 Test on the physical setup
System architecture
T.B.C
References
Answers Particle Filter.
- ↑ Matoui, F., Naceur, A. M., & Boussaid, B. (2015). Local minimum solution for the potential field method in multiple robot motion planning task. Conference Paper presented at the 2015 IEEE/ACIS 14th International Conference on Computer and Information Science (ICIS). doi:10.1109/STA.2015.7505223. Retrieved from [ResearchGate](https://www.researchgate.net/publication/307799899).