PRE2017 3 Groep10: Difference between revisions
| (299 intermediate revisions by 5 users not shown) | |||
| Line 1: | Line 1: | ||
__TOC__ | __TOC__ | ||
=Introduction= | =Introduction= | ||
Nowadays, already 43% of the world’s population is connected to the internet and online shopping is becoming increasingly popular <ref>https://www.statista.com/statistics/534123/e-commerce-share-of-retail-sales-worldwide/</ref> <ref>https://www.weforum.org/agenda/2016/01/a-brief-guide-to-the-technologies-changing-world/</ref>. Since articles bought online have to be delivered to the requested address, parcel delivery is becoming more and more important in daily life. In 2010 already 90 million packages were deliverd in the Netherlands, in 2014 this number more than doubled to 190 million<ref>https://nos.nl/artikel/2072466-pakketbezorging-met-busjes-door-snelle-groei-niet-vol-te-houden.html</ref>. If the increasing trend continues, then in 2020 there will be 280 million packages to be delivered. This big demand for parcel delivery causes increasingly difficult last mile logistics for the parcel deliverers <ref>https://www.sciencedirect.com/science/article/pii/S235214651400297X/</ref>.To keep up with the huge increase of online shopping and to meet the wishes of the user, delivery companies are coming up with more and more creative ways of delivering packages. A good example of such a company is Amazon, which announced for example a key and a locker that makes it possible to deliver packages at the home of the customers when they are not there at the moment <ref>https://www.recode.net/2017/10/25/16538828/amazon-key-in-home-delivery-prime-camera-lock/</ref> <ref>https://www.amazon.com/b?ie=UTF8&node=6442600011/</ref>. | |||
Nowadays parcels are delivered one by one by people, however, with drones becoming more sophisticated, drones might be able to improve this process. This | Nowadays parcels are delivered one by one by people, however, with drones becoming more sophisticated, drones might be able to improve this process in multiple ways. This project focuses on three of these possible implementations. All considered applications are ideas Amazon is currently investigating and will possibly be used by Amazon in the future. The first method is by using warehouses which house drones, called beehives <ref>http://www.newsweek.com/amazon-drone-tower-patent-628713</ref>. These drones then do the parcel delivery directly from the warehouse to the buyer. The second method is to drive a truck to a certain location, from where the drones will deliver the parcels to the buyer <ref>https://www.digitaltrends.com/cool-tech/amazon-drone-patent-save-battery-power</ref>. And the third method is to have a 'flying warehouse', for instance a zeppelin, hang in the air, from where the drones can deliver parcels to the buyer <ref>https://techcrunch.com/2016/12/28/amazon-patents-show-flying-warehouses-that-send-delivery-drones-to-your-door</ref>. | ||
In this project it will be examined whether and in which areas the aforementioned three methods are an improvement compared to the current delivery method. Therefore the advantages and disadvantages of the methods are investigated and compared with each other. Also the users should be incorporated, their needs and desires are vital in deciding if and how drones should be implemented in parcel delivery. These will be visualized based on a survey. | |||
=Problem statement and objectives= | =Problem statement and objectives= | ||
| Line 18: | Line 17: | ||
The objective of this project is to make an analysis of the current parcel delivery method and several new methods of parcel delivery using drones. The analyses of the delivery methods using drones to the current method are then compared to see what the advantages and disadvantages of each method is. With the results of these comparisons and the results of the survey it can be determined if and how drones should be implemented in parcel delivery. | The objective of this project is to make an analysis of the current parcel delivery method and several new methods of parcel delivery using drones. The analyses of the delivery methods using drones to the current method are then compared to see what the advantages and disadvantages of each method is. With the results of these comparisons and the results of the survey it can be determined if and how drones should be implemented in parcel delivery. | ||
=Approach, milestones and deliverables= | |||
==Approach== | |||
For this project the work was split in three parts, the literature study, the survey and the models. | |||
The literature study was performed to learn more about the state of the art of drones. This gave us a good basis from which we could start our analysis. | |||
The survey was done to find out how users think about the current parcel delivery system, where they would like to see improvements and which parts of the delivery system are annoying to them. This helped us in determining which parts of the delivery system as currently used can be improved upon. | |||
The different delivery methods were modeled to get a good impression of the advantages and disadvantages of these systems. By then comparing these (dis)advantages with the preferences of the users the best solution was determined. | |||
==Milestones== | |||
Several milestones were defined to measure our progress during the project. | |||
For the literature, the goal is to have at least 25 articles studied and summarised. | |||
For the survey the goal is to have at least 75 surveys filled out. | |||
For the models, the goal is to be able to have absolute numbers for amongst others the time-gain and costs. | |||
The final milestone is to make a relevant comparison between the results of the survey and the outcome of the model. | |||
==Deliverable== | |||
Our deliverable is a report in which all our findings can be found, as well as the results from the survey and the models. With these results a final recommendation is given based on a decision matrix that has been constructed. | |||
=Planning= | |||
- Pam: responsible for the survey and the model of the Zeppelin warehouse | |||
- Thibeau: responsible for model of truck-drone delivery | |||
- Marc: responsible for model of beehive system | |||
- Nol: responsible for analysis of current system | |||
- David: responsible for the wiki and the model of the zeppelin warehouse | |||
=Stakeholders= | =Stakeholders= | ||
| Line 47: | Line 83: | ||
The enterprises which are affected by the implementation of drones are the parcel delivery services. For these companies it is important that deliveries are quick, so that they can deliver more packages per day. Next to that cheap delivery is important while still keeping the packages safe and undamaged. | The enterprises which are affected by the implementation of drones are the parcel delivery services. For these companies it is important that deliveries are quick, so that they can deliver more packages per day. Next to that cheap delivery is important while still keeping the packages safe and undamaged. | ||
Using the current delivery methods (trucks, bicycles etc.) companies cannot keep up with the amount of packages which have to be delivered on a daily basis | Using the current delivery methods (trucks, bicycles etc.) companies cannot keep up with the amount of packages which have to be delivered on a daily basis <ref>https://nos.nl/artikel/2072466-pakketbezorging-met-busjes-door-snelle-groei-niet-vol-te-houden.html</ref>. which can also be concluded from their descending delivery quality graph shown in Figure 5.3.1 [[File:DeliveryQualityPostNL.JPG||thumb|100px|Figure 5.3.1 Delivery quality taken from PostNL's annual report]]. | ||
Drones could provide a new way of parcel delivery, which can help companies like PostNL deliver their packages faster and cheaper. | |||
Amazon is one company in particular that stands out since it is web shop that is already making steps in the direction of delivery but mainly in the United States. In the Netherlands there is a company that is quite like Amazon and might also be very interested in the idea of Amazon. The company is Bol.com which just like Amazon started as a book seller and is now one of the biggest web shops in the Netherlands. To investigate the parcel delivery of Bol.com, the main stakeholder that is important, is PostNL since that is the company that deals with delivery of packages. | |||
It is already said that drone delivery might be a solution to the huge demand of package deliveries, but to come to quantitative conclusions more information about the need for fast parcel delivery system is needed. This information can be distracted from the following links: <ref>https://www.postnl.nl/en/about-postnl/about-us/annual-review-2016/?pst=sp-pnl-pos-enabout-postnl-banner-building_our_futureannual_review_</ref><ref>https://www.postnl.nl/en/Images/annual-report-2017_tcm9-115056.pdf?v=8c27b618066baa7b818fdb4505df6048</ref> and is structured in Figure5.3.2 | |||
[[File:Volume development2.JPG|thumb|center|700px|Figure5.3.2 Volume development taken from PostNL's annual report]] | |||
From the graphs it can be concluded that the parcel delivery systems needs to be optimized in order cope with the stress and other problems that come with the current delivery system. | |||
=Assumptions= | |||
Currently the state of art of parcel delivery drones is all in design and testing phases. Therefor direct research on the subject is quite difficult since the information available sometimes correlates and other times proposes the opposite of one and other. To be able to continue this research, a couple of assumptions have to be made. These assumptions are based on scientific research and will be used baseline for the project. Almost every assumptions will be substantiated with articles found online. | |||
[[Assumptions on parcel delivery drones]] | |||
=Delivery Drones= | |||
Depending on the circumstances and needs of the enterprise and customers there are several ways to do parcel delivery's by flying drones. In this chapter an analysis will be made on the advantages and disadvantages of the proposed options. The choice of delivery system and its matching drone will be further analyzed in later chapters and a concept of a possible delivery system will be proposed. | |||
==Single rotor== | |||
[[File:SingleRotor.jpg|thumb|center|200px|Figure 7.1.1A single rotor drone is similar to a helikopter<ref>https://www.theelitedrone.com/best-rc-helicopter-for-beginners/</ref>]] | |||
The look of a drone that only has a single rotor is most easily described as a normal helicopter containing a pilot. This implementation uses one big rotor to travel vertically and also horizontally. The use of only one rotor will impact its power and maneuverability since there is only one rotor that needs to do all the work. Therefor this implementation will only be able to lift relatively light loads and the battery life will be low. Another downside of a single rotor is that the rotor needs to be pretty big which makes it mobility very low and not suitable for landing near a house on the street. | |||
The price of a professional single rotor helicopter is near €600,-<ref>https://www.conrad.nl/nl/thunder-tiger-raptor-e550-rc-helikopter-arf-1539420.html?WT.mc_id=gshop&WT.srch=1&gclid=Cj0KCQjwv73VBRCdARIsAOnG8u2mL4wNU1QzMgl0G_bobrvY0-qn8ADEWfr6IPo6QgLRdQGZRDXWxMIaAlcEEALw_wcB&insert=8J&tid=951383695_45708089245_pla-370059029402_pla-1539420</ref> | |||
== | ==Multi rotor == | ||
[[File:MuliRotor.jpg|thumb|center|200px|Figure 7.2.1A Multi rotor drone <ref>https://www.amazon.com/MC6-1600-waterproof-commercial-Aircraft-Accessories/dp/B075V5J3PV</ref>]] | |||
The most well-known drone for hobbyist and people with a little bit general aviation knowledge. Multi rotor drones are known for their stability and safety. The multiple rotors make it possible to keep the drone very stable and with the smaller blades and often applied “mudguards “ makes it also very safe for the customers and people around the delivery point. | |||
== | A down side of multiple rotors that have a relatively small diameter also drain a lot of battery if you want to enable a sufficient large working area for the drone. | ||
The costs of a Multirotor will be around €3000,- <ref>https://www.amazon.com/DJI-Matrice-100-QUADCOPTER-DEVELOPERS/dp/B011CE6U7O/ref=as_li_ss_tl?linkCode=sl1&slotNum=1&linkId=ce6829c60c2f03c344558960805bac8d&keywords=dji+matrice+100&imprToken=MZKwg5gM67tUfYwP-sEbLQ&tag=dglobe_guide-20&ie=UTF8&qid=1509763661&sr=8-2 </ref> | |||
<ref>https://www.amazon.com/YUNEEC-YUNH920US-Tornado-Hexa-Copter-Transmitter/dp/B017P0EAZI/ref=as_li_ss_tl?linkCode=sl1&slotNum=0&linkId=3fb48db54f6ce1e5ac0f990dd031cbe2&keywords=yuneec+tornado+h920&imprToken=MZKwg5gM67tUfYwP-sEbLQ&tag=dglobe_guide-20&ie=UTF8&qid=1509764248&sr=8-1</ref> | |||
- | ==Fixed Wing/Glider== | ||
[[File:E-flite Carbon-Z Cessna 150 RC vliegtuig BNF 2125 mm.jpg|thumb|center|200px|Figure 7.3.1 E-flite Carbon-Z Cessna 150 RC vliegtuig BNF 2125 mm<ref>https://www.horizonhobby.com/product/airplanes/airplanes-14501--1/bind-n-fly/carbon-z-cessna-150-aerobat-bnf-basic-efl1450</ref>]] | |||
Fixed wing gliders are more known for its application in the military due to his very high distance range and low energy use but it can still have its place in the parcel delivery industry. Another few advantages of a glider drone is that it travels faster than the multirotor drone variations where the rotors are direction vertically. Hobby remote controlled airplanes can already reach speeds of around 140 km/h. It is however limited by the package size and mass since the size of the package will determine the shape of the plane and maybe make it less aerodynamic. This can be remedied by placing the package internal in the drone. In comparison with vertical multirotor drones, are fixed wing drones capable in less weather situations(manned helicopters are capable to fly with wind power 11 <ref>https://www.trouw.nl/home/gelukkig-vliegen-helikopters-nog-tot-windkracht-11~ad597fb6/</ref>). And because it can glide more to lift off are possible for the drone such as catapulting. The reason that is a plus point is because it will save a lot of battery if the drone won’t have to use power to lift from the ground. | |||
The biggest problem with glider drones is that they can’t fly straight vertically to land. This makes it harder to implement a glider drone for parcel delivery tasks in busy city’s. Also the safety of these kind of drones will be a problem. With speeds of 140 km/h the plane can cause serious damage to humans, cars and buildings which makes this type of drone very dangerous. | |||
The costs of an Fixed wing drone will be around a professional well known RC Cessna 150 of €530,- <ref>https://www.conrad.nl/nl/e-flite-carbon-z-cessna-150-rc-vliegtuig-bnf-2125-mm-1543382.html?WT.mc_id=gshop&WT.srch=1&gclid=CjwKCAjw4sLVBRAlEiwASblR-2csYNgd2NgclwwR0-MuCpH3FQL8EHyxMVCKVRLJhFaf9ILR9Q-kQRoCl1wQAvD_BwE&insert=8J&tid=951383695_45708089245_pla-562391731912_pla-1543382</ref> | |||
- | ==Fixed wing hybrids== | ||
[[File:AmazonHybridDrone.jpg|thumb|center|250px|Figure 7.4.1Amazon Prime air delivery hybrid drone<ref>https://www.amazon.com/Amazon-Prime-Air/b?ie=UTF8&node=8037720011</ref>]] | |||
- | <ref>https://www.theverge.com/2017/9/13/16299448/drones-blood-rural-medicine-diagnostics-tests-future-rural-medicine</ref> | ||
This type of drone is already in a very high stage of development by several companies including Amazon. This type of drone mixes the best of multiple worlds. It can glide in the sky and its lift off can be aided by a catapult which will guarantee better battery life and speed. It can also float in the air stationary which makes it much more applicable for delivering parcels. The speed will be comparable to the glider drone when it flies horizontally. The load will be sufficient enough, knowing that Amazon is already marketing it for the use of 5 pound parcels. Its ability to switch to “helicopter” mode makes it also a lot safer and when looking at the design Amazon already uses it can be stated that the rotors won’t cause harm. | |||
Costs about this drone are unknown but it is very certain that this type will be the most expensive of all types. | |||
- | ==Zeppelins== | ||
[[File:Amazon-AirZeppelin.jpg|thumb|center|250px|Figure 7.5.1 Amazon Prime air delivery zeppelin<ref>http://www.dailymail.co.uk/sciencetech/article-4073250/Amazon-s-flying-factories-Patent-suggests-firm-use-self-driving-AIRSHIPS-launch-delivery-drones.html</ref>]] | |||
It is an Idea to use zeppelins to deliver drones. Zeppelins have the ability to lift of easily while having low power usage which will make the battery life longer. The drawback that comes with the low power use is a very slow locomotion. And with that comes that because the device is relying on lightweight gas the zeppelin, depending on its size, is very susceptible to weather conditions due to its relatively large surface area and light weight. It is debatable whether zeppelins are safer then multi rotor drones since the likely hood of failing is bigger but when it fails it is not a loose projectile but falls a lot slower which gives less direct human injuries but probably a lot more traffic accidents. The reason for more failure is mainly because of the size of the device which makes it susceptible to vandalism and hard to reach places. | |||
The costs of the zeppelin depend on the gas used and the preferred size that is going to be used. In terms of technology the zeppelin is probably the cheapest because the battery will not have to be high level. The size of a zeppelin can be of use when taking in consideration to implement solar cells. This will make the zeppelin extremely power efficient. | |||
= | ==Limitations of the drone’s flying radius== | ||
[[ | [[File:droneChargingStation.jpg|thumb|center|200px|Figure 7.6.1 A design of charging stations on lampposts <ref>https://www.popsci.com/amazon-patent-puts-drones-on-streetlight-recharging-stations</ref>.]] | ||
It is important to look into the possibilities of the delivery drones in terms of reach. To be able to analyse the situation, the Amazon prima air delivery drone is used. In their current research status, these drones can cover a total distance of 32 kilometres. This means that the drones can fly within a radius of 16 km from the distribution center on a full battery. | |||
It is possible to extend the reach of a drone by placing charging stations on objects like bus stations, street signs or lampposts. The latter application is already thought of by Amazon, see figure 7.6.1 By applying this option, the distance one drone can cover will increase with 200% since the first time the drone can fly straight for 32 km, before fully charging and then cover another 16km so it can still return to the charging pad. This would mean one distribution center that deploys the drones can cover up a radius of 48 km and therefor a surface of 7234 km2. | |||
1 | |||
=Current Delivery System= | |||
=Current Delivery | For the current delivery systems the trivial method of parcel delivery trucks is used. These trucks start from distribution centers that are currently scattered by PostNL. The locations are according to the website of PostNL<ref>https://www.postnl.nl/klantenservice/vragen/locaties-brievenbussen/waar-staan-de-sorteercentra-van-postnl.html</ref> placed in or near the cities: | ||
For the current delivery systems the trivial method of parcel delivery trucks is used. These trucks start from distribution centers that are currently scattered by PostNL. The locations are according to the website of PostNL | |||
*Amsterdam (postcodegebied 1000-2199) PostNL Sorteercentrum, Liniepad, Halfweg. This is very west from Amsterdam close to Harlem | *Amsterdam (postcodegebied 1000-2199) PostNL Sorteercentrum, Liniepad, Halfweg. This is very west from Amsterdam close to Harlem | ||
*Den Haag (postcodegebied 2200-2899) Forepark | *Den Haag (postcodegebied 2200-2899) Forepark | ||
| Line 103: | Line 147: | ||
*Den Bosch (postcodegebied 5000-6499)De Steenbok 2, 5215 ME | *Den Bosch (postcodegebied 5000-6499)De Steenbok 2, 5215 ME | ||
*Zwolle (postcodegebied 7000-9999)Anthony Fokkerstraat 2, 8013 NS | *Zwolle (postcodegebied 7000-9999)Anthony Fokkerstraat 2, 8013 NS | ||
The delivery process can be summarized in the following steps: | |||
# An order on a web shop like Bol.com is made | |||
# From the web shops the package gets send stockroom to a distribution centre | |||
# The parcel is processed in that distribution centre | |||
# The parcel is send to a post office near clients home or directly to the clients home | |||
In this delivery process the first three steps will not be innovated in this project., but instead the last step will be optimized by delivery drones. | |||
In order the get a analysis on how much time a parcel delivery truck takes when delivering a package, a time delivery interval should be derived showing both extremes in time. This way a quantitative conclusion can be drawn on the time efficiency of delivery trucks | == Quick clarifying analysation== | ||
In order the get a quick analysis on how much time a parcel delivery truck takes when delivering a package, a time delivery interval should be derived showing both extremes in time. This way a quantitative conclusion can be drawn on the time efficiency of delivery trucks. The average work radius of a delivery truck is approximated to 48 km. This approximation is based on the location, amount and distribution of distribution centers. When taking into account that the surface of the Netherlands is 42.000 km2 and there are 6 distribution centres so each centre will have a working radius of (sqrt(7000/pi=) 47.2 km. This radius does not seem to take into account that some distribution centres are located closely together and others are very far from others but it is an average and it seems reasonable since at 48 km the delivery trucks radius don't overlap in the country but do overlap a bit in the high population dense cities where it is needed due to high chance traffic jams and high traffic density. | |||
From the approximation of 48km it can be calculated what the time efficiency of the current delivery system at its fastest by checking the travel time of 2 cities of extremes. The two extremes depend highly on the population density and the traffic that correlates with it. To see which city is the busiest and which is the least busiest, Figure 8.1.1 and 8.1.2 show the traffic in the rush hours. | |||
{| | {| | ||
|- | |- | ||
| [[File:anwb MorningRushHour. | | [[File:anwb MorningRushHour.jpg|thumb|none|alt=ALT|400px|Figure 8.1.1 Traffic morning rush hour (6.30-9.30)<ref name=anwb>https://www.anwb.nl/verkeer/nederland/verkeersinformatie/dagelijkse-drukke-trajecten</ref>]] | ||
| [[File:anwb EveningRushHour. | | [[File:anwb EveningRushHour.jpg|thumb|none|alt=ALT|400px|Figure 8.1.2 Traffic Evening rush hour (15.30-19.00)<ref name=anwb/>]] | ||
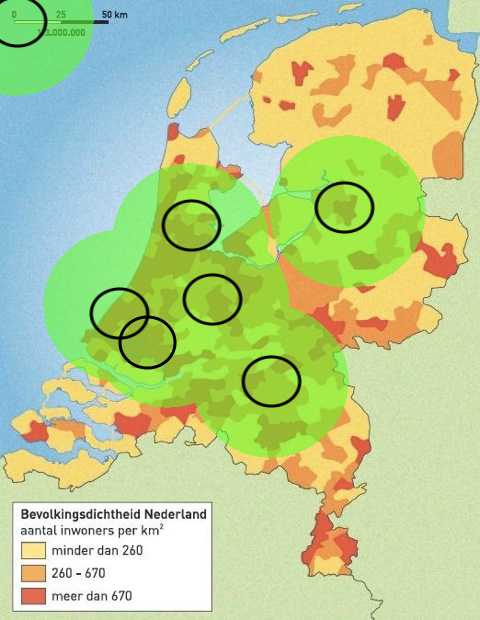
| [[File: PostNLcurrently48Radius.png|thumb|none|alt=ALT|400px|Figure 8.1.3 Population density plus a 48 km radius from the current distribution centres]] | |||
|} | |} | ||
From these maps it can be | From these maps it can be concluded that Zwolle is the least busiest traffic city. For the busiest cities it is a little bit harder to point out the busiest city but it looks like Rotterdam is the busiest when morning and evening rush hour are both taken into consideration. | ||
From Rotterdam a circle of approximately 48 can be drawn and from that a location can be chosen where the parcel delivery truck has to deliver. From the traffic rush hour maps it seems that in the direction of Utrecht the most traffic jams takes place. Selecting a location in that direction will lead to the extreme where the delivery truck needs the most time. | From Rotterdam a circle of approximately 48 can be drawn and from that a location can be chosen where the parcel delivery truck has to deliver. From the traffic rush hour maps it seems that in the direction of Utrecht the most traffic jams takes place. Selecting a location in that direction will lead to the extreme where the delivery truck needs the most time. | ||
Before proceeding the analysis, a few important notices should be made. The first notice is that the delivery centers are placed very concentrated in area's where a lot of traffic jams take place. This is a very strategically way to deal with the demands in very population dense area's, see Figure 8.1.3. A second notice is that Bol.com and PostNL will not give information about the division of parcel delivery's per distribution center so an educated guess should be made determining which distribution center delivers where. The third notice is that because the distribution centers are placed in the strategic way it is done now, analysing an extreme where the truck has to delivery a package exactly 48 km in the direction of a high potential traffic jam is not possible. The reason for this is that the location from a distribution centre can be done by an other distribution centre. So choosing Rotterdam as leaving point for a delivery in the direction of the Randstad will probably will not be the best choice for analysation. Hence another reasoning for a different city should be made. And a fourth notice is that Google maps doesn't include the average of traffic jams but instead takes the current traffic jam situation. Therefore two options can be taken; one is just taking "snapshot" of the travel distance Google maps gives or two, take a constant delay time that is incorporated in the travel time to a location. This delay time can be modelled by setting the average time over the whole travel distance to a constant. This time constant can be approximated by taking in account the average speed a truck drives in cities, suburbs, the country, village streets and the highways. It can be stated that on the types: city, suburbs, country and village streets the average speed a truck drives is 50 km/h which keeps in mind that these types are built-up area. For the highways the maximum speed of 130 km/h can be used but during traffic jams can come down to 50km/h.<ref>https://nl.wikipedia.org/wiki/File_(verkeer)</ref> It depends highly on the distance on what the average speed should be since if the road contains mostly high ways the average would be higher than a road that goes through the city most of the time. | |||
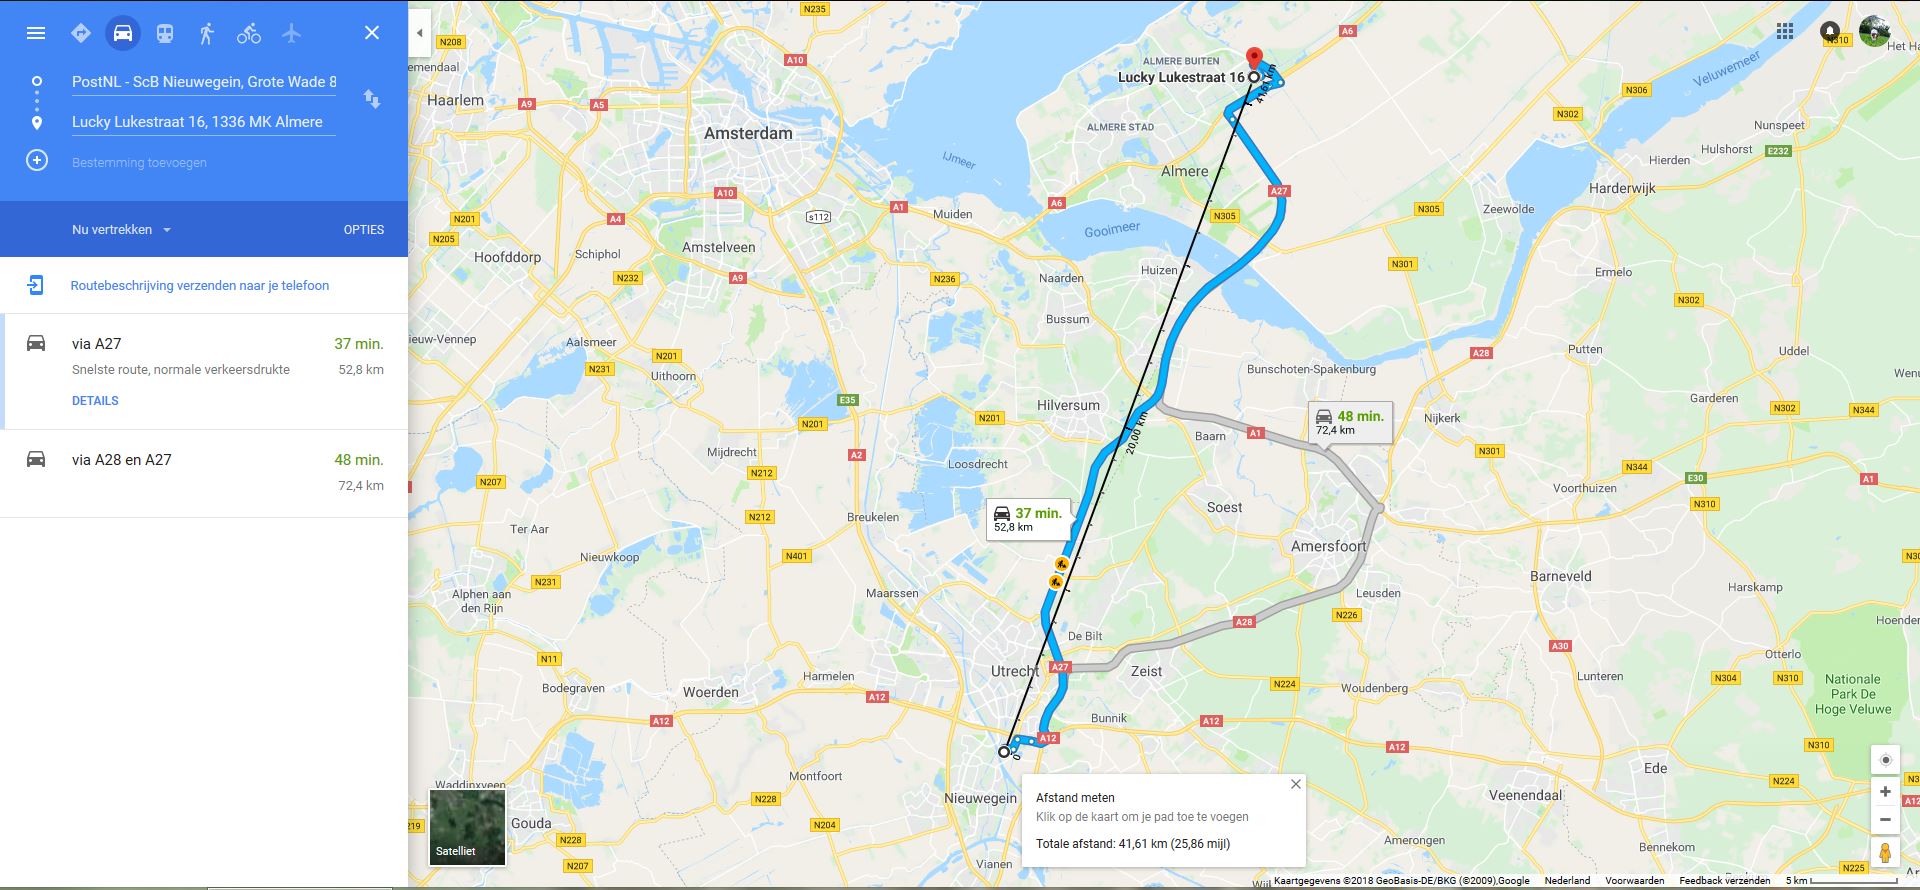
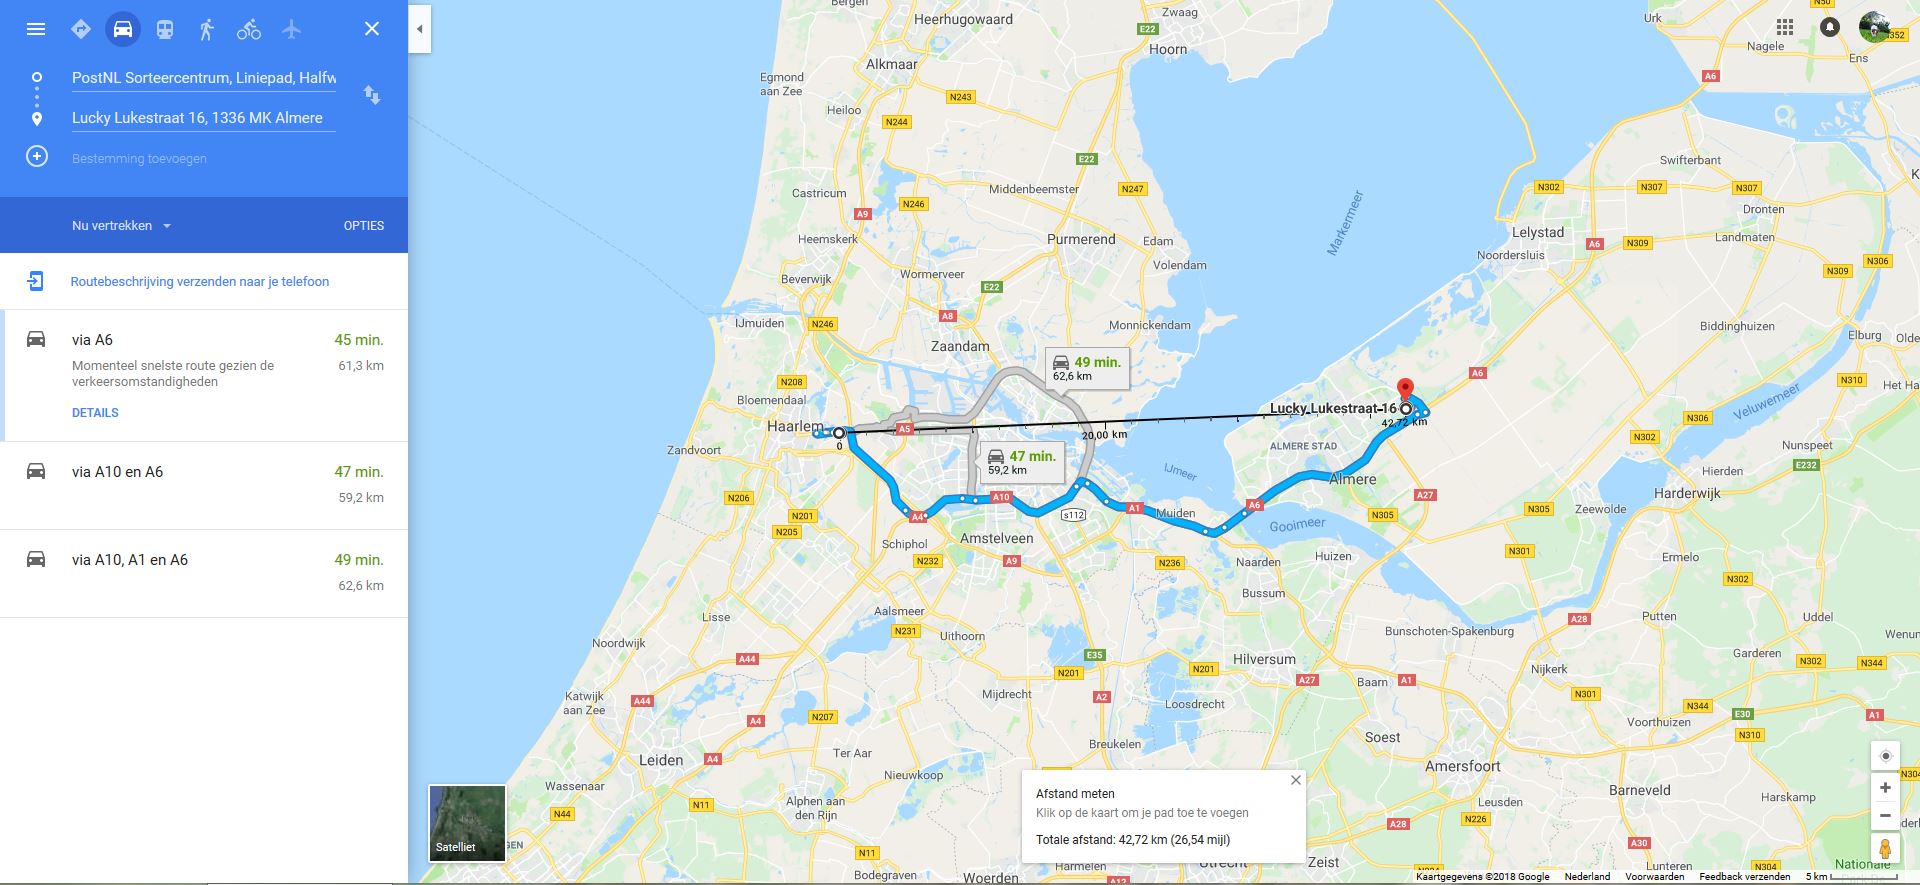
The best choice for getting a result where the an extreme can be derived is when the distribution center in Nieuwegein delivers a parcel to a location near Almere. The reason for this is as follow: If busiest city Rotterdam was chosen and the truck needed to deliver in Utrecht it will not give a representational travel time since the delivery also could have been made by approximately 4 other distribution centers; Amsterdam, Den Haag, Nieuwegein and even Den Bosch. Its seems assumable that a parcel delivery suffers the most from traffic jams if the delivery location is in the north east direction with respect to Amsterdam, Den Haag, Rotterdam and nieuwegein together. The reason for north east is because towards the south the traffic jams are less long and concentrated or it is unclear which distribution center should do the delivery. Therefore it seems reasonable to disregard Rotterdam and Den haag as potential example for a worst case delivery scenario and thus Amsterdam and Nieuwegein Remain. | |||
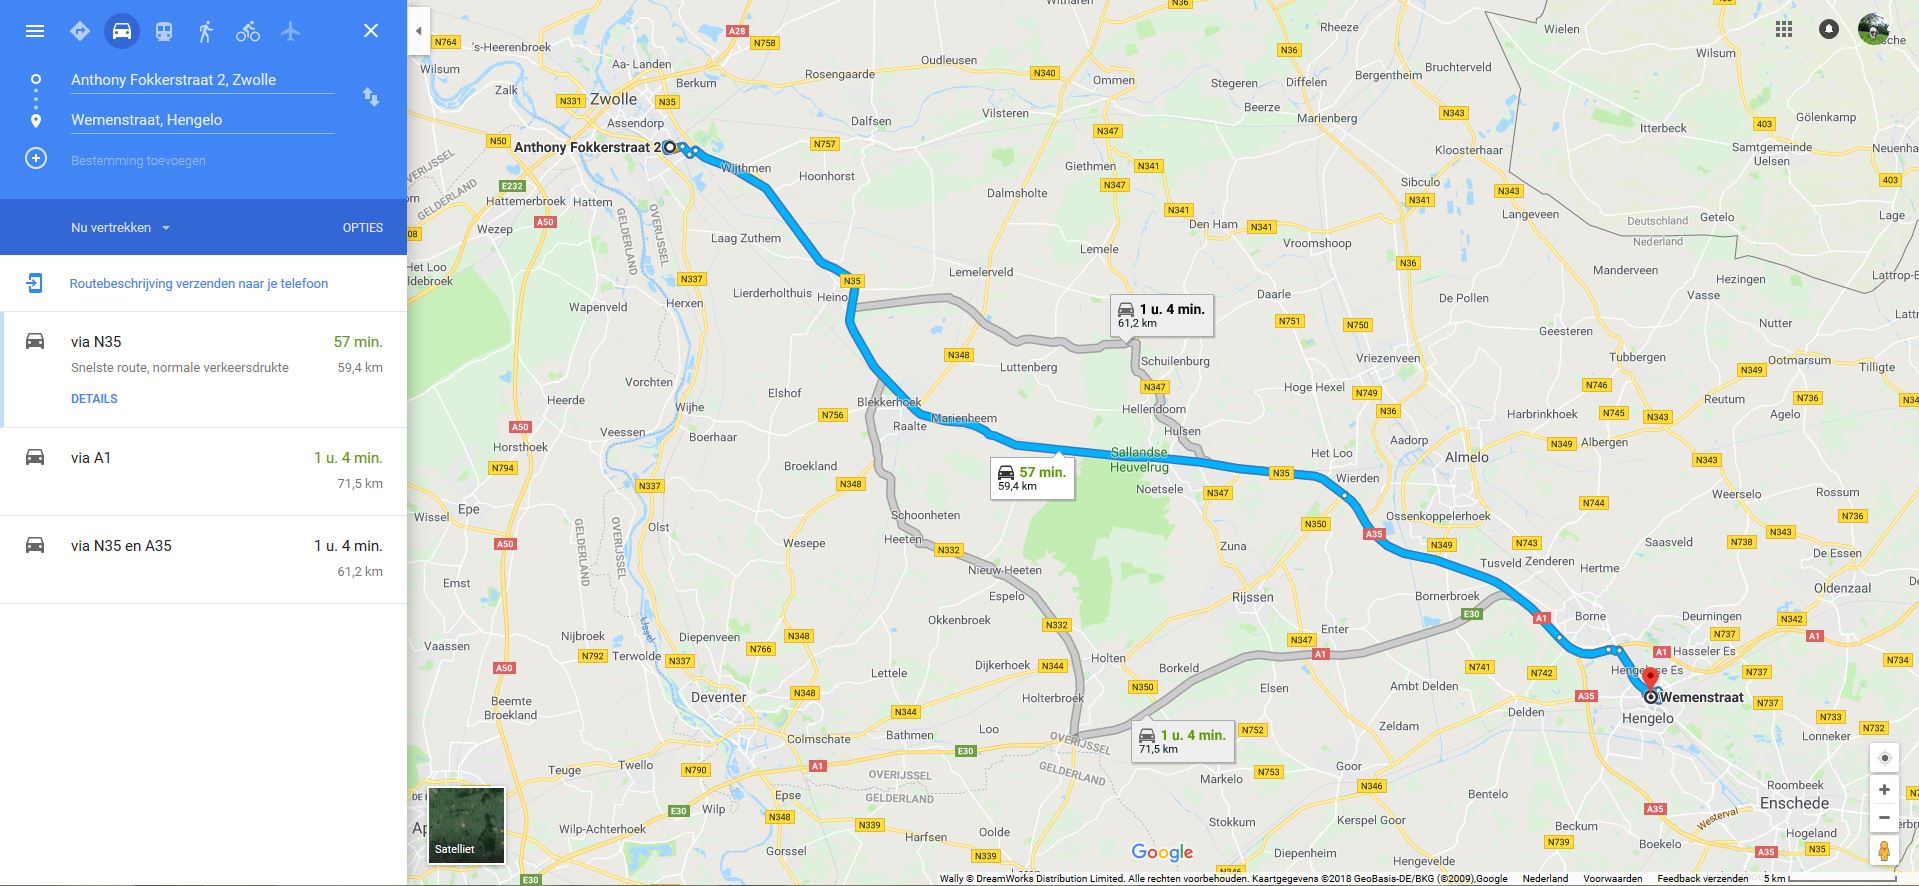
In Figure 8.1.4 and 8.1.5 circles are drawn that are exactly 48 km To select a delivery location that is exactly 48km crow flies is hard so we approximate by selecting a street that is near the edge of the 48 km circle. From Figure 8.1.5 it seems more reasonable that PostNL chooses Nieuwegein as distribution center that needs to deliver at Almere since the road seems more as the crow flies and Amsterdam is at its own a very busy city where the traffic is horrible so if the distribution centre of Amsterdam needs to deliver to a location near Almere it will probably be very ineffective. The delivery coming from Zwolle is directed to a street in the south of the city to come close to the 48km radius but letting the delivery. The choice for Hengelo is semi random. It didn’t really matter what city but to delegate the fare corner of the Netherlands a residential street in Hengelo was chosen. | |||
{| | {| | ||
|- | |- | ||
[[File: | [[File: Selecting48kmfromZwolle.JPG|thumb|none|alt=ALT|400px|Figure 8.1.4 Radius analysis 1. A 48 Km radius around the distribution centre in Zwolle <ref name=freeamptools>https://www.freemaptools.com/radius-around-point.htm</ref>]] | ||
| [[File:DroneVsTruck.JPG|thumb|none|alt=ALT|400px|Traveled road of a truck vs a drone's straight line for Nieuwegein]] | | [[File:AmsterdamOrUtrecht.JPG.JPG|thumb|right|alt=ALT|200px|Figure 8.1.5 Radius analysis 2. A 48 Km radius around the distribution centres in Amsterdam near Haarlem and Nieuwegein <ref name=freeamptools/>]] | ||
| [[File:DroneVsTruckAmsterdam.JPG|thumb|none|alt=ALT|400px|Traveled road of a truck vs a drone's straight line for Amsterdam]] | |} | ||
{| | |||
|- | |||
| [[File:AfstandDroneVsTruckZwolle0949.JPG|thumb|none|alt=ALT|400px|Figure 8.1.6Travel time analysis 1. Traveled road of a truck vs a drone's straight line for a delivery from Zwolle to Hengelo]] | |||
| [[File:DroneVsTruck.JPG|thumb|none|alt=ALT|400px|Figure 8.1.7 Travel time analysis 2. Traveled road of a truck vs a drone's straight line for Nieuwegein]] | |||
| [[File:DroneVsTruckAmsterdam.JPG|thumb|none|alt=ALT|400px|Figure 8.1.8Travel time analysis 3. Traveled road of a truck vs a drone's straight line for Amsterdam]] | |||
|} | |} | ||
Figure 8.1.7 and 8.1.8 show the disadvantage of letting the truck leave from Amsterdam where not only the road is meandering but it also have to go through the busy streets of Amsterdam, And it is also approximately 10km longer in terms of the travel distance but also 1 km longer in a straight line. So in that case it can be concluded that the extreme we chose to compare is suitable. | |||
The pictures are taken during non rush hours so to incorporate the traffic jams the average is taken of the travel time calculated by Google Maps and the travel time if the whole road was driven with a speed of 50 km/h. With that the following data is received. | The pictures are taken during non rush hours so to incorporate the traffic jams the average is taken of the travel time calculated by Google Maps and the travel time if the whole road was driven with a speed of 50 km/h. With that the following data is received. | ||
{| class="wikitable" | {| class="wikitable" | ||
! | ! | ||
! Truck | ! Truck from Zwolle to Hengelo | ||
! | ! Truck from Nieuwegein to Almere | ||
! Truck from Amsterdam to Almere | |||
|- | |- | ||
| Travel time when | | Travel time in minutes when | ||
traffic jam is | traffic jam is | ||
accounted for | accounted for | ||
| 50 | | 71 | ||
| | |50 | ||
|74 | |||
|- | |- | ||
| Travel time calculated | | Travel time in minutes calculated | ||
by Google Maps | by Google Maps | ||
| 57 | |||
| 37 | | 37 | ||
| | |45 | ||
| | |- | ||
| | |||
|} | |||
==Conclusions and discussion from the quick analysis== | |||
For the calculated travel time it seems that the method where the traffic jam is accounted for by setting the average speed to 50 km/h this is more suitable for rural areas then for high populated cities but it is still quite off. A difference of 10 to 20 minutes is observed between the calculated traffic time by Google and the travel time by setting the average speed to 50 km/h. This goes against the expectations. From this we can conclude that the average speed a truck drives is wrongly approximated. It should be said that since the Google maps snapshots were taken during non-rush hours it a time difference was expected between the calculated travel time and the travel time where traffic jams would be accounted for. So in that sense an average speed of 50 during rush hours is not farfetched, but assuming that delivery trucks only deliver at rush hours is. So to make a recommendation for the average travel speed, looking at the travel times could help to give a better average travel speed by taking the max average speed calculated by google and average it with 50 km/h. The max average speed calculated by Google in the three scenarios was 85km/h so a good approximation for the average speed will be 68 km/h. It was also expected that the travel time in rural areas would be much faster but it seems in the same range as for high populated areas. The reason for this is unknown. It could be that the snapshots were taken on unfortunate moments or that the infrastructure is much better in the high populated areas. Nevertheless it is still advised to take a higher travel time into account in highly populated areas since in practise these areas are inherent with traffic jams and the pictures showing the traffic morning and evening rush hour back this up as well. Hence it is advised to account an average speed of 68 km/h for highly populated areas and 85 km/h for rural areas. | |||
From this quick analysis some new insight have been obtained that can help making a decision matrix for the recommendation. From the rush hour and the population maps the statement can be drawn that a high population means a lot of traffic and a lot of traffic will omit CO2 a lot. In conclusion, the aspects: traffic fluency and pollution are dependent on the population density | |||
A discussion point of the analysis is the following: Delivering just 1 parcel is not representable since it is possible for one delivery van to deliver 80 parcels a day <ref>https://www.omroepwest.nl/nieuws/3313393/Tachtig-tot-110-pakketten-per-bus-bezorgers-hebben-het-druk-vlak-voor-Kerstmis </ref>. But this analysis is mainly done to get some insight of distribution centres, distribution of delivery trucks and dependency on traffic and population. This information can then later be used for the decision matrix or smaller aspects of other drone delivery systems like the truck done solution where only the travel time of the truck by highway is of much importance. More insight of the time used by a delivery truck in the city is elaborated in the Beehive method. | |||
==CO2 Pollution== | |||
PostNL is aware that a logistic sector contributes greatly to the negative impact to the environment and that intervention to that contribution benefits the company itself as well since every company has to pay CO2 taxes. PostNL is already using the population density of the Netherlands in its advantage by putting bicycle delivery in operation but this might affect other aspects of the delivery process. Think about delivery speed and capacity of the deliverer. PostNL has since now, its primary focus already on making small delivery trucks more sustainable and they have monitored this by taking the CO2 efficiency index as its environmental performance indicator. | |||
The most CO2 efficiency index improvements to the small delivery trucks were made by making the truck run on biogas. Which is in theory a good step but first of all should not be considered as the all remedy solution since bio gas has its downsides <ref>https://pubs.acs.org/doi/pdf/10.1021/ef800806g</ref>. The biggest problem that arises with biomass is the land that it uses, which will conflict the demand for food. Secondly most claims about how biomass is green is very questionable since a large percentage of the biomass the Netherlands use, is shipped out of the United States. In that case a lot of fossil fuel is used to create the biomass from forests and a lot is used to ship it <ref>https://www.youtube.com/watch?v=xW-VLPyxqAM</ref>. | |||
==Parcel delivery costs== | |||
===Enterprise=== | |||
In the last year the total operating expenses increased by €135.000.000,- in comparison to 2016, see Figure 8.4.1.1. The total operation expenses consists of imprimis the cost of materials which are things like carton boxes and digital signature devices; secondly the work contracted out and other external expenses which are money that is spend on Acquisitions, thirdly the salaries, pensions and social security contributions, this speaks for itself; fourthly the Depreciation, amortisation and impairments which can be seen as the value of the company and the fifth thing is other operating expenses can be things like start-up problems , incidentals and other things which can correlate to the volume and revenue within the segment. | |||
[[File:ParcelOperatingExpenses.JPG|thumb|center|alt=ALT|400px|Figure 8.4.1.1]] | |||
For our problem statement somewhat all aspects can be effected by the use of drones. The cost of materials will probably rise due to the drone costs. | |||
The work contracted out and other external expenses will possibly change since the need for transport services and transport related services will differ. If vehicle maintenance is taken into account. Vehicle maintenance will be less since the delivery trucks will not travel as much anymore and therefore the vehicle will wear down slower. External expenses like distribution, assembly and online platform companies will probably stay somewhat the same. The need for companies with drone knowledge will be rise, hence in that sense the external expenses will differ and probably rise but this will be compensated in other segments | |||
The salaries, pensions and social security contributions will definitely lower with the implementation of drones since the whole use of an employee is taken out in the delivery process. | |||
[[File:LabourForce.JPG|thumb|center|alt=ALT|700px|Figure8.4.1.2]] | |||
In Figure 8.4.1.2 the labour force of PostNL is shown, it is visible that there is a rise that occurred for the headcount in the parcel delivery department. This is probably due to the rising command in parcel deliveries shown earlier in the stakeholder chapter. | |||
If PostNL is implementing the drone delivery methods that are treated in this wiki, it will be the first logistic company that uses drones, making PostNL technological advanced in comparison to others. This will be an advantage in terms of depreciation, making PostNL more valuable in the logistic market. | |||
===User=== | |||
The price for the user is important. If drone delivery systems work technically and legally but the delivery itself is more expensive then truck delivery systems than chances of failing are high. The following graph is an approximation of what drone delivery is expected to cost, it also shows the current costs in the United states. Note that this approximation is done for a Beehive kind of system and the prices are in dollars. | |||
[[File:UserCosts.png|thumb|center|alt=ALT|400px|Figure 8.4.2.1]] | |||
From Figure 8.4.2.1 it can be concluded that a drone delivery is much cheaper and thus it can be promised to both the enterprise and the user that a Drone delivery system will pay of. | |||
=Survey= | |||
It is very important to include the opinions of the users with regard to the delivery system since these are the stakeholders who make use of the service. To include their interests, a survey was conducted. The purpose of this survey was to provide a clear view of their perspective on the current delivery method and a delivery method where drones are involved. | |||
===Research group=== | |||
The survey is aimed at the Dutch population aged 12 and older. According to the CBS, 12 years is the age from where packets are ordered online. As general personal information asked about gender and age. | |||
===Measuring instruments and procedure==== | |||
A questionnaire of 13 questions has been developed via the website www.enquetesmaken.com (see this link: https://www.enquetesmaken.com/s/721f1a5 ). The questions relates to different ones sub-areas, namely: personal details, social environment, online ordering, the current delivery method and the implementation of drones in the delivery system. The questions about the sub area current delivery method are not answered by people who indicated never to order packages online. The question about why people do not use the service to order online packages is not answered by the people who use it. The online surveys were sent in early March via social media and Whatsapp. | |||
===Analysis=== | |||
The survey forms are digitally processed with the website www.enquetesmaken.com. The research focuses on the total results for the Netherlands. A distinction has been made between gender and age. The results showed that the vast majority of respondents belongs to the same age group. This has to be taken into account while drawing a conclusion. | |||
The rough age data are classified according to the following age groups: | |||
* 12 to 19 years; | |||
* 20 to 29 years; | |||
* 30 to 39 years; | |||
* 40 to 49 years; | |||
* 50 to 59 years; | |||
* 60 years and older | |||
===Results=== | |||
The survey was completed by 64 respondents, of which 55% male and 45% female. 17% of the respondents are in the age category 12 to 19 years, 72% in the age range 20 to 29 year, 2% in the age group 30 to 39 years, 2% in the age group 40 to 49 years, 5% in the age group 50 to 59 years and 3% in the age group 60 years and older. In the extensive result description below all results are mentioned. All results are visible via the following link: https://www.enquetesmaken.com/?url=results&c=721f1a5-da3c741&uid=1206625&status=1&language=1&hl=0&datum_einschraenken=0&dateRange=&fid=12132120&ftid=28719153&ftid_wert=0#E12132120. | |||
===Social environment=== | |||
===Education=== | |||
{| | |||
|- | |||
| [[File:USErobotsfiguur1.png|thumb|none|alt=ALT|400px|Figure 9.1: The highest level of education]] | |||
| [[File:USErobotsfiguur2.png|thumb|none|alt=ALT|400px|Figure 9.2: The highest level of education of the male respondents]] | |||
| [[File:USErobotsfiguur2.png|thumb|none|alt=ALT|400px|Figure 9.2: The highest level of education of the male respondents]] | |||
|} | |||
The highest level of education has been asked. | |||
Results (figure 9.1) have shown that over 46 percent of the group stated to have VWO and 0 percent stated to have MAVO as their highest obtained degree. Also the results are given by gender (figure 9.2 for men and 9.3 for women). For men it is remarkable that there are filled out five other forms of education. The explanation for this is that these are educations in Belgium. | |||
===Living environment=== | |||
{| | |||
|- | |||
| [[File:USErobotsfiguur4.png|thumb|none|alt=ALT|400px|Figure 9.4: The kind of the environment where the respondents lives]] | |||
| [[File:USErobotsfiguur5.png|thumb|none|alt=ALT|400px|Figure 9.5: The kind of the environment where the male respondents lives]] | |||
| [[File:USErobotsfiguur6.png|thumb|none|alt=ALT|400px|Figure 9.6: The kind of the environment where the female respondent lives]] | |||
|} | |||
There has been asked in what kind of environment the respondent lives. | |||
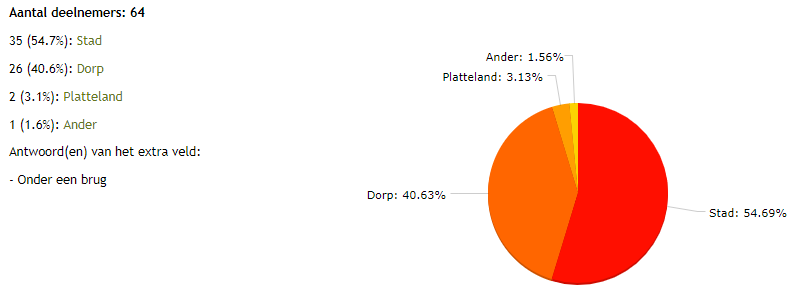
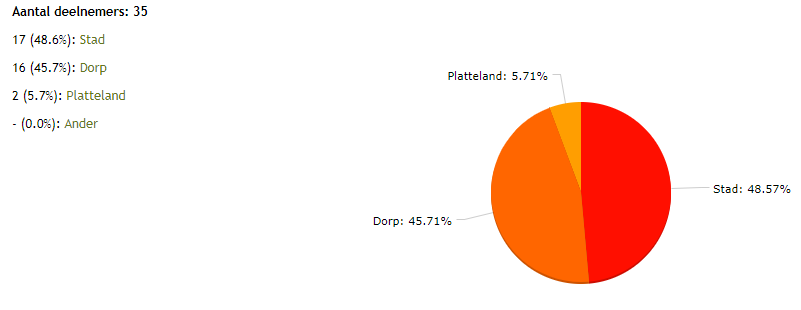
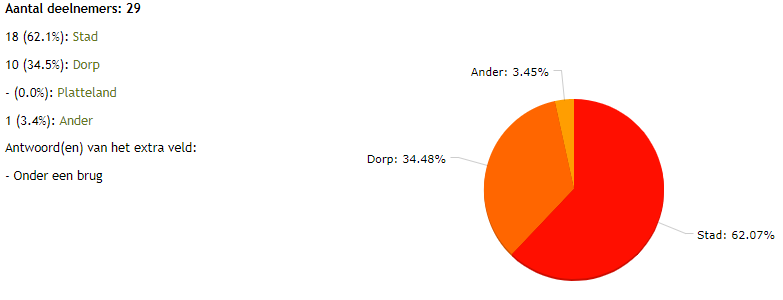
See figure 9.4 for the results. Just over the half (54.69%) of the respondents stated to live in the city. Furthermore one respondent stated to live under a bridge. Because the truth of this is being seriously questioned, the other answers of this respondent have also been examined. Because these are also not reliable this must be taken into account when drawing conclusions. This respondent stated to be a woman of 60 years and older. In figure 9.4 and 9.5 the results are given by gender. | |||
{| | |||
|- | |||
| [[File:USErobotsfiguur7.png|thumb|none|alt=ALT|400px|Figure 9.7: The type of house where the respondents lives]] | |||
| [[File:USErobotsfiguur8.png|thumb|none|alt=ALT|400px|Figure 9.8: The type of house where the male respondents lives]] | |||
| [[File:USErobotsfiguur9.png|thumb|none|alt=ALT|400px|Figure 9.9: The type of house where the female respondents lives]] | |||
|} | |||
There also has been asked in what type of house the respondent lives. | |||
From figure 9.7 it can be concluded that many answers have been filled in in the additional field. The respondent whose answers are questioned is again confirmed here with the answer 'cardboard box'. Furthermore, the same answers have been entered several times. This brings us to 8 different types of houses: flat, detached house, semi-detached, terraced house, retirement home, apartment, student house, mansion. In figure 9.4 and 9.5 the results are given by gender. | |||
===Online ordering=== | |||
There has been asked if the respondent makes use of the availability to order packages online. | |||
[[File:USErobotsfiguur10.png|thumb|none|alt=ALT|400px|Figure 9.10: Does the respondent make use of the availability to order packages online?]] | |||
From the above illustration it can be concluded that the vast majority (92.19%) make use of this opportunity. Of the 35 male respondents, 94.3% (33 respondents) makes use of this service. Of the 29 female respondents, 89.7% (26 respondents) makes use of this service. | |||
There has been asked about the reasons of the respondents to not order packages online (respondents whose answer was yes in the previous question, were requested to answer ‘inapplicable’ to this question). | |||
{| | |||
|- | |||
| [[File:USErobotsfiguur11.png|thumb|none|alt=ALT|400px|Figure 9.11: What are the reasons that the respondents do not order packages online?]] | |||
| [[File:USErobotsfiguur12.png|thumb|none|alt=ALT|400px|Figure 9.12: What are the reasons that the respondents do not order packages online?]] | |||
|} | |||
It is striking that only 62 respondents answered this question (figure 9.11). This means that there are quitted two respondents with the survey so far. The respondents were able to give multiple answers to this question. When filtering on the answers of the respondents who indicated that they did not make use of the service in the previous question, the figure 9.12 is displayed. This illustration does not match the preceding illustration. This means that respondents who do make use of the online ordering service have also answered this question. Because they were not supposed to answer this question, their answers are not taken into consideration in the conclusion and the above illustration is assumed. From this it can be concluded that the respondents mainly do not order online for two reasons: they would rather be able to asses/see/touch the product in reality (60%) and they think it is annoying that you have to be at home at time of delivery (80%). | |||
{| | |||
|- | |||
| [[File:USErobotsfiguur13.png|thumb|none|alt=ALT|400px|Figure 9.13: What are the reasons that the male respondents do not order packages online?]] | |||
| [[File:USErobotsfiguur14.png|thumb|none|alt=ALT|400px|Figure 9.14: What are the reasons that the female respondents do not order packages online?]] | |||
|} | |||
Above (figure 9.13 and 9.14) the results are given by gender. Both men indicated to be irritated by the fact that you have to be at home at time of delivery. The main reasons for the women are the facts that they want to be able to asses/see/touch the product in reality (66.7%) and they think it is annoying that you have to be at home at time of delivery (66.7%). | |||
{| | |||
|- | |||
| [[File:USErobotsfiguur15.png|thumb|none|alt=ALT|400px|Figure 9.15: The day on which the respondents order a package online]] | |||
| [[File:USErobotsfiguur16.png|thumb|none|alt=ALT|400px|Figure 9.16: The day on which the respondents order a package online (answered by the respondents who make not use of the online order service)]] | |||
|} | |||
There has been asked on which day the respondent usually orders a package online. | |||
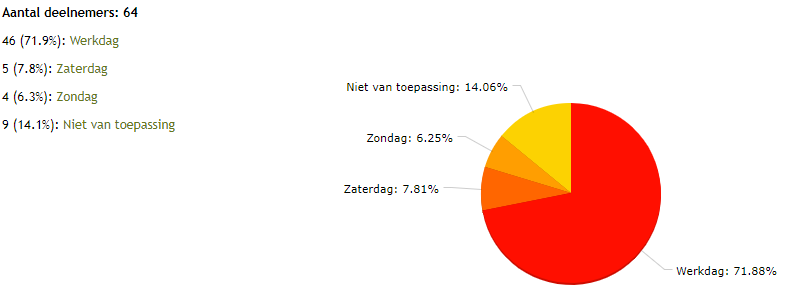
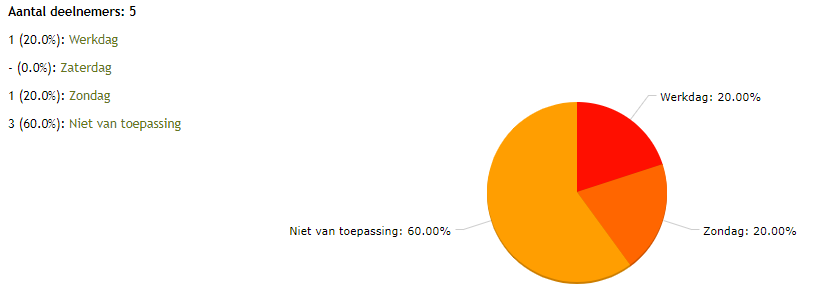
It is striking that this question has again 64 respondents (figure 9.15). It seems like the two respondents who did not answer the previous question have answered this question again. This question is considered to be answered only by the respondents who have indicated that the make use of the online order service. However, when the answers of the respondents who do not use this service are filtered, the figure 9.16 is displayed. 60 percent followed the instructions from the survey and answered ‘not applicable’ , but the other two respondents did answer this question. These answers are not taken into consideration; only the answers of the respondents who stated to make use of the online order service are taken into account (these are 59 respondents). This gives the following results: working day (45 respondents: 76.27%) , Saturday (5 respondents: 8.48%, Sunday (3 respondents: 5.08%), not applicable (9 respondents: 15.25%). Here it is striking that there are 6 respondents who make use of the service and do answer ‘not applicable’ to this question. When a distinction has been made between gender, there were 26 (78.8%) male respondents who order a package online on a working day, 3 (9.1%) respondents on a Saturday, 0 respondents on a Sunday and 4 (12.1%) respondents answered ‘not applicable’. When looking at the female respondents, there were 19 (73.1%) respondents who order their packages on a working day, 2 (7.7%) respondents on a Saturday, 3 (11.5%) respondents on a Sunday and 2 (7.7%) respondents answered ‘not applicable’. | |||
{| | |||
|- | |||
| [[File:USErobotsfiguur.png|thumb|none|alt=ALT|400px|Figure 9.17: The part of the day the respondents mainly order a package online]] | |||
| [[File:USErobotsfiguur18.png|thumb|none|alt=ALT|400px|Figure 9.18: The part of the day the respondents mainly order a package online (answered by the respondents who do not make use of the online order service)]] | |||
|} | |||
There was asked on which part of the day the respondents mainly order a package online (figure 9.17). | |||
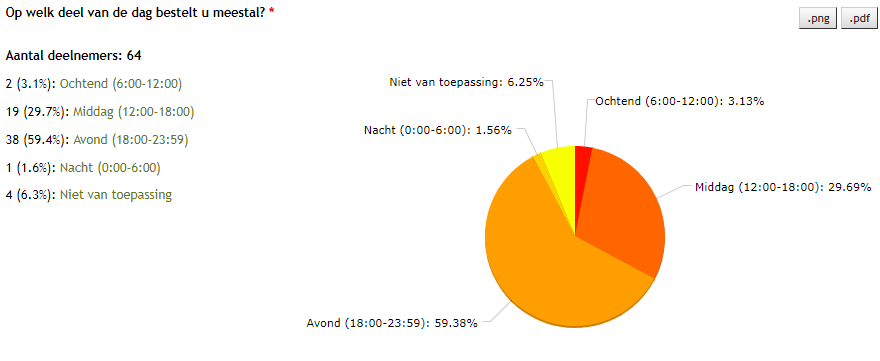
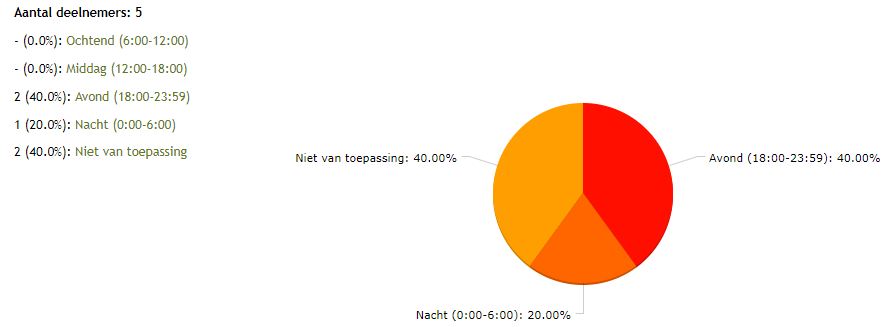
The fact that only respondents who make use of the online order service are deemed to answer the question also applies here. When the results are filtered on the respondents who do not make use of the service, figure 9.18 is given. This illustration shows that there were three respondents who did not follow the instructions of the survey. These answers are therefore not taken into account in the conclusion. This gives the following results: morning (2 respondents: 3.39%), afternoon (19 respondents: 32.20%), evening (36 respondents: 61.02%), night (0 respondents), not applicable (2 respondents: 3.39%). Here the same holds as in the previous question; it is striking that there are 2 respondents who make use of the service and do answer ‘not applicable’ to this question. When a distinction between gender is made, the following results are given (only from the respondents who stated to make use of the online order service): there were 2 (6.1%) male respondents who mainly order their packages in the morning, 9 (27.3%) male respondents in the afternoon, 21 (63.6%) male respondents in the evening, 0 male respondents at night and 1 (3.0%) male respondent answered ‘not applicable’. The following results apply to female respondents: 0 female respondents order their packages in the morning, 10 (38.5%) in the afternoon, 15 (57.7%) in the evening, 0 at night and 1 (3.8%) answered ‘not applicable’. | |||
===Current delivery method=== | |||
{| | |||
|- | |- | ||
| [[File:USErobotsfiguur19.png|thumb|none|alt=ALT|400px|Figure 9.19: The irritation on a scale of 0 to 10 in a number of cases of the respondents.]] | |||
| [[File:USErobotsfiguur20.png|thumb|none|alt=ALT|400px|Figure 9.20: The irritation on a scale of 0 to 10 in a number of cases of the respondents.]] | |||
|} | |||
The respondents were asked to indicate their irritation on a scale of 0 to 10 in a number of cases. | |||
Here the amount of respondents is remarkable again (figure 9.19). There is one respondent who did not give an answer to this question. When the answers of the respondents who do not make use of the online order service are filtered, figure 9.20 is given. From this figure it can be inferred that there again were respondents who answered this questions while they were not supposed to (because they do not make use of the online order service). These answers are not taken into consideration. | |||
===Implementation of drones in the delivery system=== | |||
{| | |||
|- | |||
| [[File:USErobotsfiguur21.png|thumb|none|alt=ALT|400px|Figure 9.21: The irritation on a scale of 0 to 10 in a number of cases of the respondents.]] | |||
| [[File:USErobotsfiguur22.png|thumb|none|alt=ALT|400px|Figure 9.22: The irritation on a scale of 0 to 10 in a number of cases of the respondents.]] | |||
|} | |} | ||
There was asked whether the respondents have a problem with the fact when their packages are delivered by a drone henceforth instead of a human mail deliverer. | |||
Again it is striking that 62 respondents gave an answer to this question (figure 9.21). The vast majority (83.9%) indicates that they have no problems with this change. Furthermore it is remarkable that there are many comments to this question. These comments come almost (81.82%) of all the respondents who make use of the online order service. From the comments it can be concluded that there are still a lot of questions about this situation and that some respondents have doubts about safety. | |||
Delivering packages with drones can potentially change a lot. The respondents were asked to indicate with a number from 0 to 10 for each statement whether this would be an added value for them. | |||
From figure 9.22 it can be seen that the respondents consider the following three cases as the most valuable added value: when their package can be delivered faster, that their package can be delivered at the location of the respondent two hours after ordering and that the delivery costs of the package are lower. Furthermore they see it as the least added value that there is no contact with the human mail deliverer. | |||
There is asked whether the respondents would pay extra money for a human delivery person when the delivery of packages with drones becomes the standard delivery method. | |||
[[File:USErobotsfiguur23.png|thumb|none|alt=ALT|400px|Figure 9.23: The irritation on a scale of 0 to 10 in a number of cases of the respondents. ]] | |||
It is striking that of the 10 respondents who indicated that they had troubles when their packages were delivered by drones, 9 would pay no extra money for a human mail deliverer. | |||
=The beehive= | =The beehive= | ||
[[File:beehive_1.jpg|thumb|400px|The multi-level | [[File:beehive_1.jpg|thumb|400px|Figure 10.1: The multi-level fulfilment centre called the Beehive]] | ||
To be able to deploy delivery drones from distribution centres and warehouses, one must come with a smart design so drone deployment and truck deliveries don’t interfere. Today’s distribution centres and warehouses are typically large-volume single-floor buildings, located at the outer parts of the mayor cities | One of the first methods that will be investigated is the adaption of distribution centres and how it can be used for drone parcel delivery. To be able to deploy delivery drones from distribution centres and warehouses, one must come with a smart design so drone deployment and truck deliveries don’t interfere. Today’s distribution centres and warehouses are typically large-volume single-floor buildings, located at the outer parts of the mayor cities <ref name=beehivepatent/>. But since drones are not restricted to the ground floor, it could efficiently fly from higher levels. Combining this possibility with the distribution centres results in the beehive. | ||
The beehive is a distribution centre for the delivery drones to take off and land. | The beehive is a distribution centre for the delivery drones to take off and land. <ref name=beehivepatent>https://www.theguardian.com/technology/2017/jun/26/amazon-drones-delivery-beehive-patent</ref> The beehive facilities would be mainly build to create space vertically so the footprint of the building is small enough to fit close-by or even within the cities. Building the beehives closer to the cities results into possibilities of items that may be delivered more quickly to the growing population of people that live in the cities, as well as the growing number of people who work in the cities <ref name=beehivepatent/>. | ||
While the ground floor can be used as is done nowadays, docking and deploying delivery trucks, the higher levels can be used to deploy the drones. In this way the drones are already at a higher level in the sky and therefor save time and energy for the since it doesn’t need to ascend much, making it possible to fly further and faster. And by taking off from the higher level, the danger to interfere with pedestrians is minimized.<ref>https://www.theverge.com/2017/6/23/15860668/amazon-drone-delivery-patent-city-centers</ref> | |||
Inside the beehive, automatic robots move around goods and conduct maintenance on the drones. And since the facilities are so high, the delivery drones can easily fly inside as well. Another advantage of the multi-level facility is that the drone activities largely take place at the upper levels, therefor minimizing the noise for surrounding areas <ref>https://www.livescience.com/59617-amazon-patent-for-drone-beehive-airport.html</ref>. | |||
== | The beehives could facilitate a large volume of drones that continuously fly in and out to deliver the packages and recharge at site. Those drones could fulfil thousands of orders a day, depending on the number of drones being used. And to be able to control and oversee the flight operations of the drones the beehive could facilitate a command centre, comparable with a flight control tower at the airport. With the use of this command centre no drone delivery flies unseen or unmanned while the drones itself is autonomous. | ||
==Possibilities and limitations of the Beehive== | |||
As explained above, the beehive adapted distribution centre, placed closed or even within a city. And to understand its possibilities, one must first look back at the drones. Taking in mind that, as explained in the assumptions, the average speed of a delivery drone is 60 km/h, and the maximum range a drone fly and still be able to return is 16 km, the beehive brings the possibility to deliver a packages within 30 minutes after it is ordered. And not only can it deliver in such a high speed, it can target the buyer’s exact location and send the drone over there. And placing such a beehive close or even within a city, bring along the possibility to deliver to every customer within the city in less than 30 minutes. | |||
But keeping in mind that the delivery range for a beehive is 16 km, one beehive can cover up a surface of (π * r2=) 803.84 km2. To cover up the entire Netherlands its surface (42.000 km2), it would take a demand of over 52 distribution centres. Comparing this to the current number of distribution centres of PostNL, which is 6 centres through the entire Netherlands <ref>https://www.postnl.nl/klantenservice/vragen/locaties-brievenbussen/waar-staan-de-sorteercentra-van-postnl.html</ref>, a proposed increase of 875% on distribution centres is necessary. This number of distribution centres would theocratically be the only way to deliver packages with beehives within 30 min. And for every delivery one drone is occupied for a maximum of 90 minutes, taking into account that recharging takes half an hour. | |||
A possible solution for this would be to install wireless charging pads throughout the Netherlands, for example on lampposts. This would increase the distance one drone can cover with 200% since the first time the drone can fly straight for 32 km, before fully charging and then cover another 16km so it can still return to the charging pad. This would mean one distribution centre can cover up a radius of 48 km and therefor a surface of 7234 km2. | A possible solution for this would be to install wireless charging pads throughout the Netherlands, for example on lampposts, as mentioned before and in the assumptions. This would increase the distance one drone can cover with 200% since the first time the drone can fly straight for 32 km, before fully charging and then cover another 16km so it can still return to the charging pad. This would mean that one distribution centre can cover up a radius of 48 km and therefor a surface of 7234 km2. Comparing this with the surface of the Netherlands, about 6 distribution centres could cover up the entire Netherlands, if ideally distributed over the country. In this case a drone maximally takes about 75 minutes for one delivery and another 75 minutes to return and another 30 min to recharge again, resulting in a total time of 180 minutes. It is a possibility to change the battery of the drone once it is back to the beehive, which can save up the last 30 min with just one action. | ||
{| | {| | ||
|- | |- | ||
| [[File:Distributiecentra-postNL.png|thumb|none|alt=ALT|400px|Distribution centres of PostNL spread throughout the Netherlands. Black circles indicate the range of 16 km and the green circles indicate the range of 48 km]] | | [[File:Distributiecentra-postNL.png|thumb|none|alt=ALT|400px|Figure 10.2: Distribution centres of PostNL spread throughout the Netherlands. Black circles indicate the range of 16 km and the green circles indicate the range of 48 km]] | ||
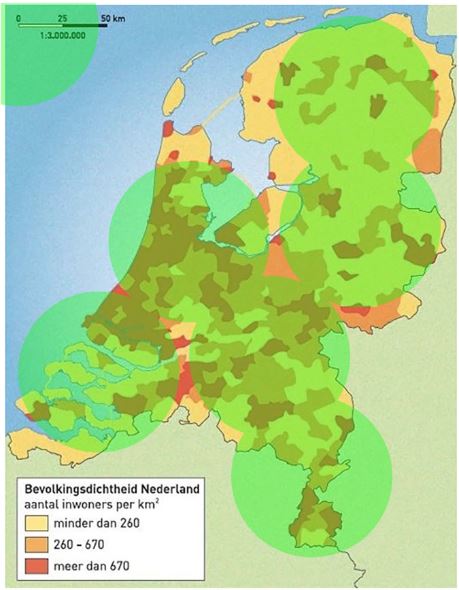
| [[File:Distribution_centres_spread_out.png|thumb|none|alt=ALT|400px|Distribution centres divided with respect to covering the most area]] | | [[File:Distribution_centres_spread_out.png|thumb|none|alt=ALT|400px|Figure 10.3: Distribution centres divided with respect to covering the most area]] | ||
|} | |} | ||
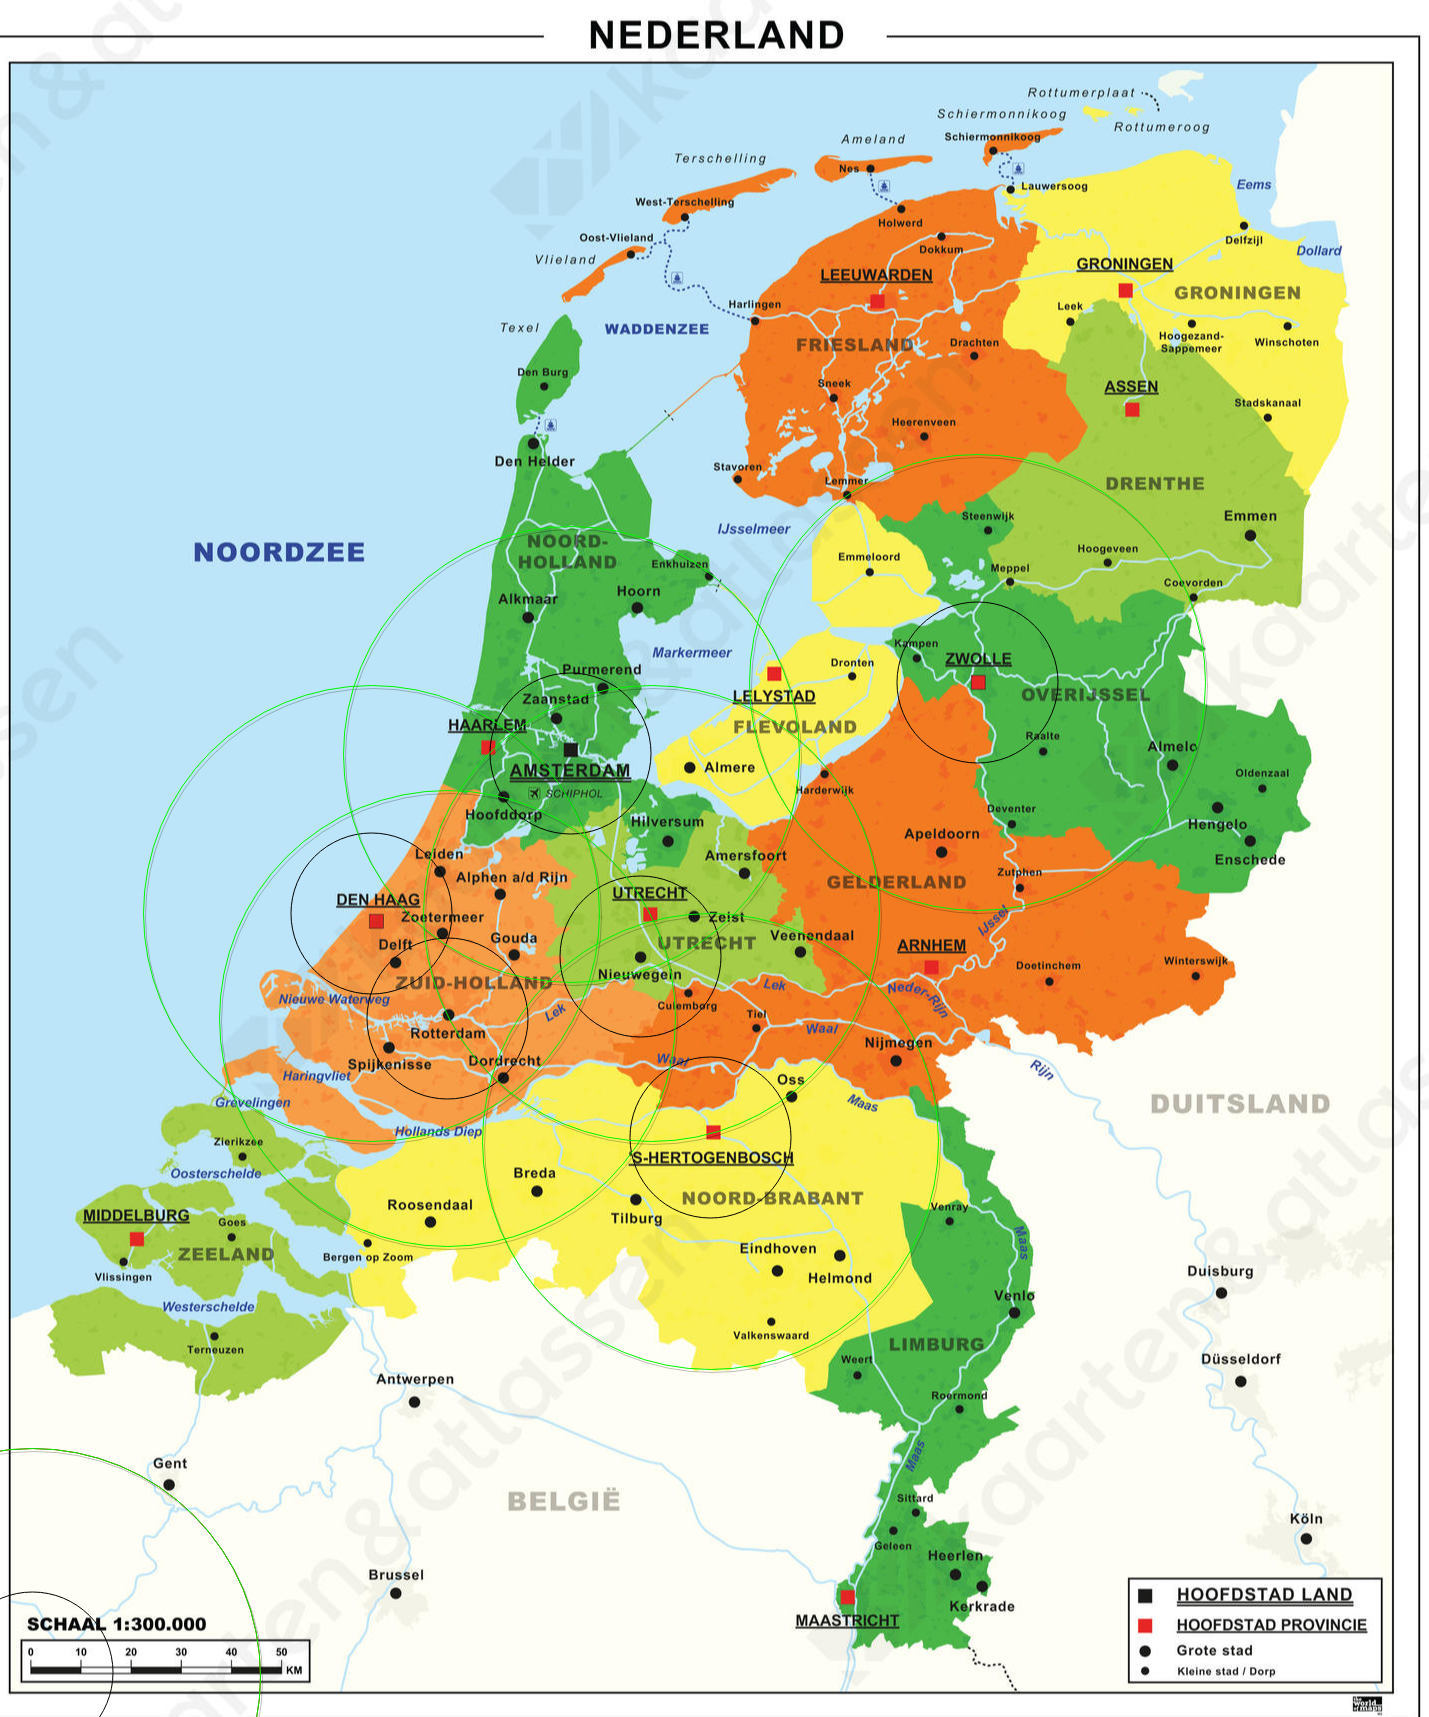
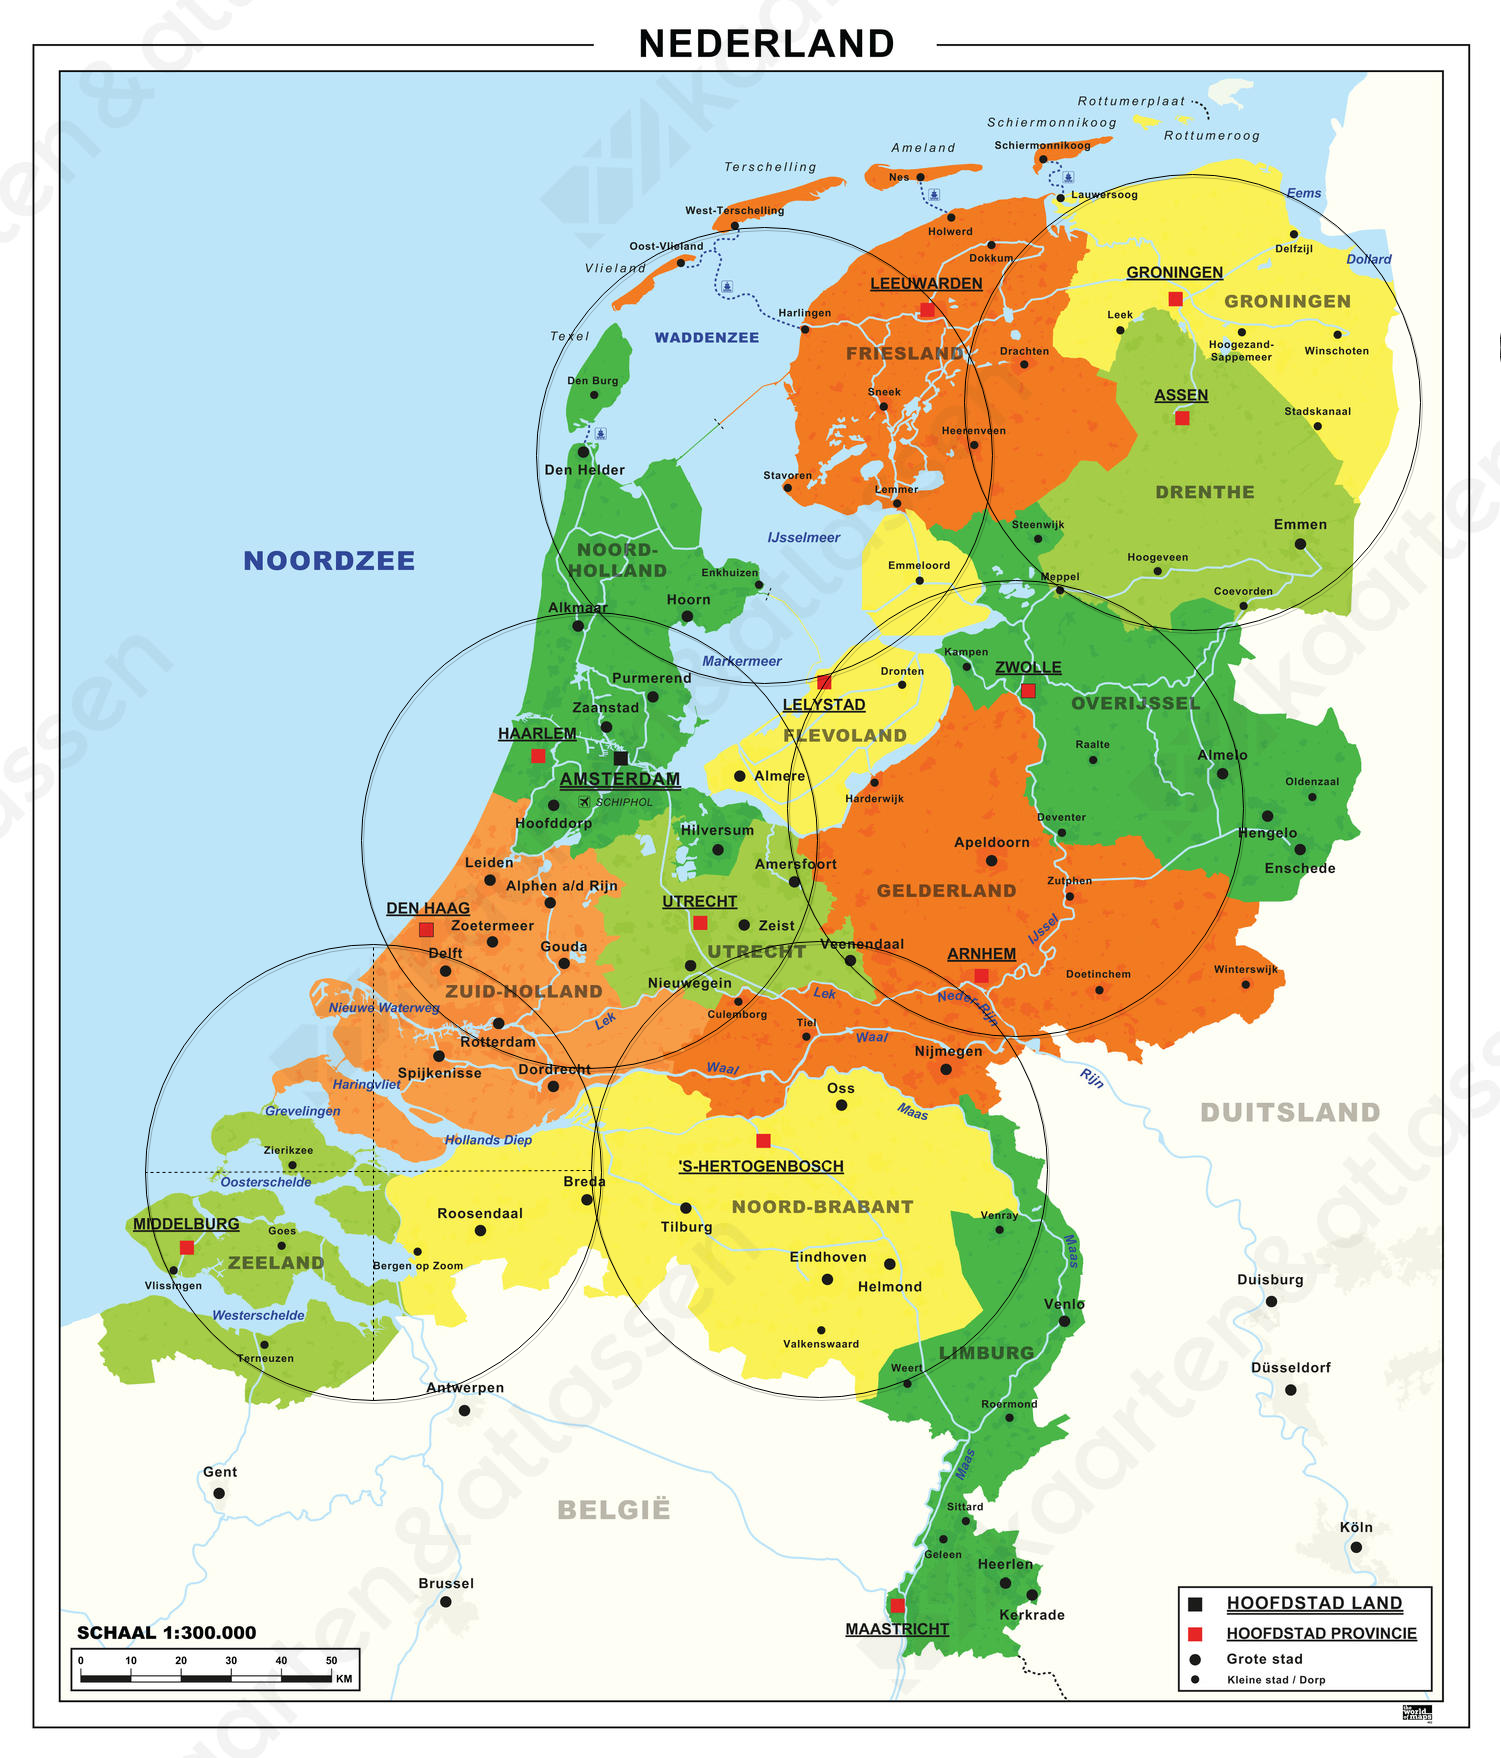
However, the Netherlands is not a perfect shape so the surfaces will not align with 6 beehives. Furthermore the distribution centres out optimally over the Netherlands. Currently the | However, the Netherlands is not a perfect shape so the surfaces will not align with 6 beehives. Furthermore the distribution centres are not spread out optimally over the Netherlands. Currently the longest distance between a distribution centre and a city in the far north is about 140 km. A clear overview of the centres of PostNL throughout the Netherlands can be seen in Figure 10.2 above. Figure 10.3 aside of it shows a favourable distribution of the beehives with respect to covering the most area. Currently, the centre of the Netherlands can be reached quite well with sometimes more than one distribution centre in range. The outer parts of the Netherlands are actually out of reach, even with the solution of wireless charging pads. Even when applying a second charge moment in the flight, extending the range with another 32 km, not every part of the Netherlands can be reached. And due to this extra charge the total flying time increased with 90 minutes and the delivery time is extended to 135 minutes, causing one drone to be occupied for about 5 hours before be ready for the next delivery and thereby completely losing the point of the beehive. | ||
It can be concluded that spreading out 6 beehives throughout the Netherlands is not going to be enough to deliver packages with drones throughout the entire Netherlands within a profitable time. A better implementation for the placements of the beehives would be to look into the population density. To see if PostNL has its distribution centres on favourable places, its warehouses are compared to the population density in the Netherlands. And around these distribution centres, the radius of the drone’s flying distance is drawn, as seen the | It can be concluded that spreading out 6 beehives throughout the Netherlands is not going to be enough to deliver packages with drones throughout the entire Netherlands within a profitable time. A better implementation for the placements of the beehives would be to look into the population density. To see if PostNL has its distribution centres on favourable places, its warehouses are compared to the population density in the Netherlands. And around these distribution centres, the radius of the drone’s flying distance is drawn, as seen the Figure 10.4 below. Figure 10.5 aside of it shows a favourable distribution of the beehives throughout with respect to the population density. A few notions can be made when comparing the distribution of distribution centres of PostNL compared to the distribution with respect to population density: | ||
#Currently the distribution centres seem to mainly cover the most densely populated areas. Therefor leaving out a big part of the Netherlands. | #Currently the distribution centres seem to mainly cover the most densely populated areas. Therefor leaving out a big part of the Netherlands. | ||
| Line 187: | Line 401: | ||
{| | {| | ||
|- | |- | ||
|[[File:PostNLcurrently.png|thumb|none|alt=ALT|400px|Distribution centres of PostNL spread throughout the Netherlands with a 48km action radius and with respect to population density]] | |[[File:PostNLcurrently.png|thumb|none|alt=ALT|400px|Figure 10.4: Distribution centres of PostNL spread throughout the Netherlands with a 48km action radius and with respect to population density]] | ||
|[[File:PostNLDistPlacements.jpg|thumb|none|alt=ALT|400px|Distribution | |[[File:PostNLDistPlacements.jpg|thumb|none|alt=ALT|400px|Figure 10.5: Distribution centres with a 48km action radius divided with respect to population density]] | ||
|} | |} | ||
With this analyses it can be concluded that the beehive is limited through its delivery range and can’t be used to deliver to the entire Netherlands. However, the possibilities it creates when placed close to a mayor city is very profitable. Therefor one must not see the beehive as a solution for the entire country, but as a solution or improvement for the mayor cities. | |||
==Implementation of the beehives== | ==Implementation of the beehives== | ||
First of | [[File:route_af.png|thumb|300px|Figure 10.6: First route from distribution centre to delivery point]] | ||
To analyse the advantages of the beehive compared to the current method, it has to be analysed in a real situation. For this analysis it is chosen to compare a normal distribution centre on the outskirts of a big city to a beehive. And what better city to analyse than Amsterdam. And even though it would be possible to place a beehive on the most ideal location within the city itself, it is chosen to place the beehive on the same location as the current distribution centre to get the most reliable results to compare. build almost in the city itself. | |||
First of all, Amsterdam currently has a delivery of over 40.000 packages a day. And with the current grow of online purchases it is expected to grow over 100.000 packages a day within 10 years. <ref>http://www.logistiek.nl/distributie/nieuws/2016/12/over-10-jaar-per-dag-100-000-pakketten-in-amsterdam-101150392</ref> But according to Amsterdam, the dense populated city can’t facilitate that amount of packages with their already overcrowded traffic. Currently, almost all packages are delivered with a van and a small amount is delivered with motorbikes or bicycles. | |||
To start off, one package has to be delivered directly from the distribution centre to Agnietenkapel, located at Oudezijds Voorburgwal 231, close in the city itself. First of all, the package could be delivered with a van, having two options. First, driving through the city and taking a route of 11.2 km that takes up to 36 minutes or drive around the city taking a route of 20.3 km that takes up to 26 minutes. When delivered with motorbike it takes the route of 11.1 km and about 31 minutes. When delivered with bicycle it takes the route of 10.0 km that takes up to 35 minutes. But when delivering with a drone, it could fly in a straight line, taking a route of 7.2 km. Taken into account that it flies with an average speed of 60 km/ | So let’s compare the possibilities with a normal distribution centre and the beehive. PostNL has its current distribution centre placed at Australiëhavenweg 100, Amsterdam. This location is indicated in Figure 10.6 as starting point of the route, encircled in black. | ||
To start off, one package has to be delivered directly from the distribution centre to Agnietenkapel, located at Oudezijds Voorburgwal 231, close in the city itself. First of all, the package could be delivered with a van, having two options. First, driving through the city and taking a route of 11.2 km that takes up to 36 minutes or drive around the city taking a route of 20.3 km that takes up to 26 minutes. When delivered with motorbike it takes the route of 11.1 km and about 31 minutes. When delivered with bicycle it takes the route of 10.0 km that takes up to 35 minutes. But when delivering with a drone, it could fly in a straight line, taking a route of 7.2 km. Taken into account that it flies with an average speed of 60 km/h, it takes less than 8 minutes to deliver by drone. | |||
[[File:route2_af.png|thumb|left|300px|Figure 10.7: Six deliveries from distribution centre within Amsterdam: blue is car, red is bike]] | |||
But to get a proper comparison between the different transport systems more locations have to be added. There is chosen for a total of 6 locations, randomly chosen among Amsterdam. In the comparison the van is shown as a car, there is the bike, the bicycle and the drone. All carriers can take 6 packages with them, except for the drone. This results in the fact that the drone has to fly back to the distribution centre after every delivery to pick-up a new package. As mention in the assumptions, the action of retrieving a package out of the distribution centre takes about 90 seconds, which have been added in the calculation- each time. Also since the drone is not flying on ground level it has to ascend and land every time, each action taking 30 seconds into account. With this extra restrictions the model is believed to be more reliable and less in favour of the drone delivery. | |||
To calculate the time necessary to deliver packages in Amsterdam, Google Maps is used. The final route for the car is shown in the figure aside, highlighted in blue. The final route for the bicycle is shown in red. The bike mostly rides on the bicycle lanes but sometimes has to drive on the main road, taking more time and some more distance. The drone flies into a straight line each time, with an average flying speed of 60 km/h. The table shows the distance (km) and time (min) covered up until reaching that location. In the end the total covered distance and time are shown as well as the average speed. Take into account that no extra time is charged for the car, bike and bicycle to actually deliver the packages. And even without this extra event the drone is almost 50% faster than the van. And below the top four calculation an implantation of more drones is shown. As seen in the table the total time consumed when using three drones is only 21.5 minutes for 6 deliveries, not taking the last return flight into account. Compared with the truck, this is an improvement of over 500%. Compared to the bike it improves with 475% and with the bicycle 630%. To get a better understanding, the time-distance relations have been plotted in Figure 10.8 aside. | |||
[[File:time_profit.png|thumb|right|350px|Figure 10.8: Delivery times of different services]] | |||
As stated before, currently the model is running from the distribution centre location of Amsterdam as it is currently located. However, with the implementation of the beehive, the distribution centre could be placed even more central in the city being able to deliver packages all over Amsterdam and surrounding within 30 minutes. And this implementation is not only available for Amsterdam but for all major cities. With the use of the beehive, every big city in the Netherlands will be able to order packages that can be delivered within 30 minutes on the exact location necessary. With the transformation of the current distribution centres into beehives almost all big cities fall within the 16 km range. And with only a couple of extra beehives all major cities will be able to order packages with a delivery time below the 30 minutes. | |||
{| style="border: 1px solid black; border-spacing: 0; margin: 1em auto;" | {| style="border: 1px solid black; border-spacing: 0; margin: 1em auto;" | ||
|+ '''Table I''' | |+ '''Table 10.I''' | ||
|- | |- | ||
! style="border: 1px solid black; padding: 5px; background: #efefef;" | Delivery | ! style="border: 1px solid black; padding: 5px; background: #efefef;" | Delivery times of the different delivery services in Amsterdam | ||
|- | |- | ||
| style="border: 1px solid black; padding: 5px;" | | | style="border: 1px solid black; padding: 5px;" | | ||
| Line 453: | Line 678: | ||
|} | |} | ||
|} | |} | ||
==Advantages and disadvantages of the beehive== | |||
Now that the main idea is of the beehive is clear and a comparison is made between the current methods and the method of the beehive, the advantages can be enlisted versus the disadvantages. | |||
===Advantages=== | |||
Let’s look into the advantages at first. To implement the beehive, a distribution centre has to be transformed. The footprint will become smaller and the building will become a multi-level fulfilment centre. In this way it can be located closer or even within the major cities, since the space taken is much smaller. Another advantage is that the current methods doesn’t have to be changed completely, it is just altered. Drones are added for fast deliveries, but have to stay within range, while truck can still be deployed from the beehive to deliver outside this range. Due to the height of the beehive, the drones can fly away from a sufficient altitude preventing noise disruption and dangerous encountering with pedestrians on the ground floor. And since it has so much space on the higher levels, lots of drones can be stored that are either idle or charging. | |||
Furthermore, the traffic jam within the city will decrease since less vans are necessary to deliver the packages. The packages can be delivered within 30 min in a 16 km radius of the beehive, any location necessary. This results in the fact that buyers don’t have to be home but can use GPS to uplink their current location so the drone can deliver at that specific location. The time profit made is between 300% and 600%, depending on the number of deliveries and the number of drones used. And keep in mind that a van would not depart to deliver one packages, while a drone flies straight away. Beside the fact that the deliveries a much quicker, they are also cheaper. A PostNL parcel delivery costs the user about €3.80 <ref>https://www.postnl.nl/tarieven/tarieven-pakketten/Pakket/NL/0-2kg</ref> and a PostNL deliverer costs about €8.57 <ref>https://www.indeed.nl/cmp/Postnl/salaries</ref>. A drone has a one-time investment cost and afterwards only makes costs with charging. Resulting in lower costs for the company and therefor a decrease in the price for the buyer which will probably be about €1 per parcel. | |||
* Smaller footprint for distribution centre | |||
* Closer to the city | |||
* Less traffic jams | |||
* Quick deliveries in overpopulated areas | |||
* A time profit between 300 – 600% on deliveries | |||
[[File:top_10_steden_nederland.JPG|thumb|300px|Figure 10.9: First route from distribution centre to delivery point]] | |||
* Possibility to deliver within 30 minutes | |||
* Cheaper for the buyer | |||
* On time, more profit for the supplier | |||
===Disadvantages=== | |||
Although the beehive offers a lot of promising advantages, there are also some downsides. First of all, to be able to deliver packages within 30 minutes to the 10 major cities of the Netherlands, every city needs its own beehive. These cities have been drawn in Figure 10.9 aside <ref>https://nl.wikipedia.org/wiki/Lijst_van_grootste_gemeenten_in_Nederland</ref>. Taking in account that currently, only 4 of the 10 cities have a distribution centre nearby, 6 completely new distribution centres have to be built. Building such project close-by or within those major cities brings along quite some trouble as well as costs. And all the drones delivering from the beehives have to be accounted for. As stated in the assumptions, 172.000 deliveries have to be made daily with drones. Assuming 67% is ordered in the major cities, about 115.000 deliveries have to be made with only 10 beehive. Assuming one drone can deliver about 4 packages an hour, recharging time takin into account, and the drones fly for about 10 hours a day, so 40 packages a day can be delivered by each drone. This results in a supply of around 3.000 drones in 10 beehives, so 300 per beehive. And since each drone costs €3500, a total of €10.5 million euros has to be invested. | |||
Beside the fact that the implementation of the beehives need a big start-up, the beehive might not be the most attractive building to have around. It is quite high so it can clearly be seen over a large range and it has lots of activity, resulting in distractions and irritations for people in the surroundings. Not even starting about all the flying drones in the air which people might get frustrated about, especially the ones working in high business-towers. And the fauna environment around the beehive might also be supressed by all the flying drones. | |||
* Limited within a range of 16 km | |||
* Large start-up costs | |||
* Building projects bring along trouble | |||
* Distraction for fauna environment | |||
* Distraction for surrounding people | |||
=Truck-drone combination= | =Truck-drone combination= | ||
| Line 459: | Line 716: | ||
== Static deployment == | == Static deployment == | ||
Another important problem is that of the placement of the truck. In this delivery method it is assumed that 1 truck is placed in Eindhoven for all the deliveries at that time. To optimize this placement, different techniques can be used. | Another important problem is that of the placement of the truck. In this delivery method it is assumed that 1 truck is placed in Eindhoven for all the deliveries at that time. To optimize this placement, different techniques can be used.<ref>http://www.geomidpoint.com/calculation.html</ref> | ||
The two most appealing are: | The two most appealing are: | ||
| Line 470: | Line 727: | ||
To compare this method with a traditional parcel delivery, an example scenario is worked out. | To compare this method with a traditional parcel delivery, an '''example scenario''' is worked out. | ||
The distribution company has 10 packets that they have to deliver in the city of Eindhoven. | The distribution company has 10 packets that they have to deliver in the city of Eindhoven. | ||
The locations at which they have to deliver are (random locations) shown in Table I. | The locations at which they have to deliver are (random locations) shown in Table I. | ||
| Line 482: | Line 739: | ||
With this in mind, the shortest route for the traditional delivery can be planned, starting at Kerkdorp Acht. | With this in mind, the shortest route for the traditional delivery can be planned, starting at Kerkdorp Acht. | ||
The travel time from the distribution centre to Kerkdorp Acht is approximately 25 mins. | The travel time from the distribution centre to Kerkdorp Acht is approximately 25 mins. | ||
The delivery route followed from there on is shown in | The delivery route followed from there on to the 9 other destinations is shown in Figure 11.1. | ||
[[File:traject.png|thumb|400px|The delivery traject]] | [[File:traject.png|thumb|400px|Figure 11.1: The delivery traject]] | ||
This accounts for an additional 1h 17mins for the delivery of all 10 packages. | This accounts for an additional 1h 17mins for the delivery of all 10 packages. | ||
In total this results in a delivery-travel time, for the last package, of 1h 42mins. | In total this results in a delivery-travel time, for the last package, of 1h 42mins. | ||
| Line 489: | Line 746: | ||
Now this can be compared with the truck-drone method. | Now this can be compared with the truck-drone method. | ||
First of all, the truck has to drive to the geographic midpoint, this takes approximately 30 mins. | First of all, the truck has to drive from the distribution centre to the geographic midpoint, this takes approximately 30 mins. | ||
From there, the drones will be deployed. | From there, the drones will be deployed. | ||
A deployment strategy for the drones is crucial to optimally use both the resources and the time available. | A deployment strategy for the drones is crucial to optimally use both the resources and the time available. | ||
| Line 542: | Line 799: | ||
Now with a total flight distance of 47410m it is known that a minimum of 2 drones is required to deliver all packets without recharging (assuming a total range of 32km for each drone). | Now with a total flight distance of 47410m it is known that a minimum of 2 drones is required to deliver all packets without recharging (assuming a total range of 32km for each drone). | ||
Table II shows the order of delivery and the (cumulative) time it takes for each delivery. As can be seen, the order of deliveries is based on a decreasing distance towards the destination. In other words, the furthest delivery point will be the destination for the first drone, the second drone will fly towards the second furthest delivery point and so on. The cumulative time is used to | Table II shows the order of delivery and the (cumulative) time it takes for each delivery. As can be seen, the order of deliveries is based on a decreasing distance towards the destination. In other words, the furthest delivery point will be the destination for the first drone, the second drone will fly towards the second furthest delivery point and so on. The cumulative time is used to determine which drone goes to what location. However, important to note is that the cumulative time is not the same as the delivery time, this is because the cumulative time is the time that corresponds with the moment where the drone arrives back at the truck. In other words, the delivery moment is equal to the cumulative time minus the time it took the drone to fly from the destination back to the truck. The maximal final delivery times for the locations are respectively: 1828.8s, 1230.96s, 901.84s, 687.44s, 598.8s, 384.4s and 380.08s.This way it can be seen that a decreasing maximal delivery time is achieved for an increasing number of drones deployed. | ||
{| style="border: 1px solid black; border-spacing: 0; margin: 1em auto;" | {| style="border: 1px solid black; border-spacing: 0; margin: 1em auto;" | ||
|+ '''Table II''' | |+ '''Table II''' | ||
| Line 564: | Line 820: | ||
! Time cumulative (s) | ! Time cumulative (s) | ||
! 6-Drones # | ! 6-Drones # | ||
! Time cumulative (s) | |||
! 7-Drones # | |||
! Time cumulative (s) | |||
! 8-Drones # | |||
! Time cumulative (s) | ! Time cumulative (s) | ||
|- | |- | ||
! Kerkdorp Acht | ! Kerkdorp Acht | ||
| 4751 || 760.16 || 1 || 760.16 || 1 || 760.16 || 1 || 760.16 || 1 || 760.16 || 1 || | | 4751 || 760.16 || 1 || 760.16 || 1 || 760.16 || 1 || 760.16 || 1 || 760.16 || 1 || 760.16 || 1 || 760.16 || 1 || 760.16 | ||
|- | |- | ||
! Berckelbosch | ! Berckelbosch | ||
| 3659 || 585.44 || 2 || 585.44 || 2 || 585.44 || 2 || 585.44 || 2 || 585.44 || 2 || 585.44 | | 3659 || 585.44 || 2 || 585.44 || 2 || 585.44 || 2 || 585.44 || 2 || 585.44 || 2 || 585.44 || 2 || 585.44 || 2 || 585.44 | ||
|- | |- | ||
! Woenselse Heide | ! Woenselse Heide | ||
| 3591 || 574.56 || 2 || 1160 || 3 || 574.56 || 3 || 574.56 || 3 || 574.56 || 3 || 574.56 | | 3591 || 574.56 || 2 || 1160 || 3 || 574.56 || 3 || 574.56 || 3 || 574.56 || 3 || 574.56 || 3 || 574.56 || 3 || 574.56 | ||
|- | |- | ||
! Bennekel-Oost | ! Bennekel-Oost | ||
| 3148 || 503.68 || 1 || 1263.84 || 3 || 1078.24 || 4 || 503.68 || 4 || 503.68 || 4 || 503.68 | | 3148 || 503.68 || 1 || 1263.84 || 3 || 1078.24 || 4 || 503.68 || 4 || 503.68 || 4 || 503.68 || 4 || 503.68 || 4 || 503.68 | ||
|- | |- | ||
! Oude Spoorbaan | ! Oude Spoorbaan | ||
| 2018 || 322.88 || 2 || 1482.88 || 2 || 908.32 || 4 || 826.56 || 5 || 322.88 || 5 || 322.88 | | 2018 || 322.88 || 2 || 1482.88 || 2 || 908.32 || 4 || 826.56 || 5 || 322.88 || 5 || 322.88 || 5 || 322.88 || 5 || 322.88 | ||
|- | |- | ||
! Antony Moddermanstraat 40-54 | ! Antony Moddermanstraat 40-54 | ||
| 1726 || 276.16 || 1 || 1540 || 1 || 1036.32 || 3 || 850.72 || 5 || 599.04 || 6 || 276.16 | | 1726 || 276.16 || 1 || 1540 || 1 || 1036.32 || 3 || 850.72 || 5 || 599.04 || 6 || 276.16 || 6 || 276.16 || 6 || 276.16 | ||
|- | |- | ||
! Mensfort | ! Mensfort | ||
| 1697 || 271.52 || 2 || 1754.4 || 2 || 1179.84 || 2 || 856.96 || 4 || 775.2 || 6 || 547.68 | | 1697 || 271.52 || 2 || 1754.4 || 2 || 1179.84 || 2 || 856.96 || 4 || 775.2 || 6 || 547.68 || 7 || 271.52 || 7 || 271.52 | ||
|- | |- | ||
! Binnenstad | ! Binnenstad | ||
| 1411 || 225.76 || 1 || 1765.76 || 1 || 1262.08 || 1 || | | 1411 || 225.76 || 1 || 1765.76 || 1 || 1262.08 || 1 || 985.92 || 3 || 800.32 || 5 || 548.64 || 7 || 497.28 || 8 || 225.76 | ||
|- | |- | ||
! Philipsdorp | ! Philipsdorp | ||
| 930 || 148.8 || 2 || | | 930 || 148.8 || 2 || 1903.2 || 3 || 1227.04 || 4 || 975.36 || 2 || 734.24 || 4 || 652.48 || 6 || 424.96 || 8 || 374.56 | ||
|- | |- | ||
! Hemelrijken | ! Hemelrijken | ||
| 639 || 102.24 || 1 || 1859 || 2 || | | 639 || 102.24 || 1 || 1859 || 2 || 1282.08 || 3 || 952.96 || 5 || 701.28 || 6 || 649.92 || 5 || 425.12 || 7 || 373.76 | ||
|- | |- | ||
|} | |} | ||
| Line 618: | Line 878: | ||
|- | |- | ||
!Truck-Drone (2 Drones) | !Truck-Drone (2 Drones) | ||
| 30 || | | 30 || 30.48 || 60.48 | ||
|- | |- | ||
!Truck-Drone (3 Drones) | !Truck-Drone (3 Drones) | ||
| 30 || | | 30 || 20.52 || 50.52 | ||
|- | |- | ||
!Truck-Drone (4 Drones) | !Truck-Drone (4 Drones) | ||
| 30 || | | 30 || 15.03 || 45.03 | ||
|- | |- | ||
!Truck-Drone (5 Drones) | !Truck-Drone (5 Drones) | ||
| 30 || | | 30 || 11.46 || 41.46 | ||
|- | |- | ||
!Truck-Drone (6 Drones) | !Truck-Drone (6 Drones) | ||
| 30 || | | 30 || 9.98 || 39.98 | ||
|- | |||
!Truck-Drone (7 Drones) | |||
| 30 || 6.41 || 36.41 | |||
|- | |||
!Truck-Drone (8 Drones) | |||
| 30 || 6.33 || 36.33 | |||
|- | |- | ||
|} | |} | ||
|} | |} | ||
It can be concluded that a lot of time can be gained by making use of this truck-drone combination. Increasing the amount of drones results in an increase in time gain, however a maximal time gain is reached at | It can be concluded that a lot of time can be gained by making use of this truck-drone combination. Increasing the amount of drones results in an increase in time gain, however a maximal time gain is reached at 8 drones (in this specific scenario), at this point the max travel time for the group of drones is equal to travel time of the drone that has to fly to the furthest destination. | ||
== Dynamic deployment == | == Dynamic deployment == | ||
| Line 644: | Line 910: | ||
Using the same example scenario as for the static deployment, the dynamic approach is shown and simulated delivery times are calculated. Since the truck doesn't deploy at the geomidpoint anymore, new locations for deployment should be appointed. Based on the results of the static approach, it is known that for sufficient amount of drones, the main factor that constrains the max delivery time is the max distance from the truck to the furthest destination. So the aim of the dynamic approach will be to route the truck to minimize this distance. | Using the same example scenario as for the static deployment, the dynamic approach is shown and simulated delivery times are calculated. Since the truck doesn't deploy at the geomidpoint anymore, new locations for deployment should be appointed. Based on the results of the static approach, it is known that for sufficient amount of drones, the main factor that constrains the max delivery time is the max distance from the truck to the furthest destination. So the aim of the dynamic approach will be to route the truck to minimize this distance. | ||
{| | {| | ||
|- | |- | ||
|[[File: | |[[File:Dynamic_long.png|thumb|none|alt=ALT|500px|Figure 11.2: Dynamic-long truck drone combination. Truck traject (green line)]] | ||
|[[File:Dynamic_optimal.png|thumb|none|alt=ALT|500px|Figure 11.3: Dynamic-optimized truck drone combination. Truck traject (green line)]] | |||
|- | |||
|} | |} | ||
Figure 11.2 shows a possible solution for the dynamic approach. However in this specific situation, it is not an optimal solution. This is due to the fact that the truck has a low average speed in these parts of the city. Figure 11.3 aims to solve this, by limiting the amount of travel time for the truck by deploying all drones earlier. Since the dynamic aspect allowed the first three destinations to be reached by the drones before the truck comes to its final hold, enough drones are available (since a total of 8 is assumed to compare with static deployment) to reach the remaining 7 delivery locations. The travel times are represented in Table IV. | |||
= | {| style="border: 1px solid black; border-spacing: 0; margin: 1em auto;" | ||
|+ '''Table IV''' | |||
|- | |||
! style="border: 1px solid black; padding: 5px; background: #efefef;" | Dynamic Delivery | |||
|- | |||
| style="border: 1px solid black; padding: 5px;" | | |||
{| border ="1" style = "border-collapse: collapse;" | |||
! Destination !! Truck drive time (mins) !! Drone fly distance (m) !! Drone fly time (s) !! Total delivery time (mins) | |||
|- | |||
| Kerkdorp Acht || 25 || 1084 || 86.72 || 26.45 | |||
|- | |||
| Woenselse Heide || 25.2 || 2601 || 208.08 || 28.67 | |||
|- | |||
| Mensfort || 27.5 || 900 || 72 || 28.70 | |||
|- | |||
| Hemelrijken || 30 || 794 || 63.52 || 31.06 | |||
|- | |||
| Antony Moddermanstraat 40-54 || 30 || 1945 || 155.6 || 32.59 | |||
|- | |||
| Binnenstad || 30 || 1763 || 141.04 || 32.35 | |||
|- | |||
| Philipsdorp || 30 || 1326 || 106.08 || 31.77 | |||
|- | |||
| Oude Spoorbaan || 30 || 2375 || 190 || 33.17 | |||
|- | |||
| Bennekel-Oost || 30 || 3534 || 282.72 || 34.71 | |||
|- | |- | ||
| | | Berckelbosch || 30 || 3819 || 305.52 || '''35.09''' | ||
|} | |||
|} | |} | ||
This shows that a small time gain is achieved compared to the static drone deployment strategy. | |||
Also a big time gain compared to the traditional delivery method. | |||
= | ==Advantages and disadvantages of truck-drone combination== | ||
The main concept of the truck-drone delivery method is shown, explained and simulated. | |||
Possible different approaches to the method are given. | |||
And their quantitative results of delivery times have been simulated. | |||
However, implementing this has also other factors that influence the viability of the technology. | |||
These are listed and discussed as advantages or disadvantages. | |||
= | ===Advantages=== | ||
The truck-drone combination has the aim to deploy the drones for the 'last-mile-delivery', | |||
meaning that the last part of the journey is done by the drone(s). | |||
Especially in areas such as cities, this is a very promising approach because it will result in a lower amount of delivery vehicles used on public roads. | |||
This will enhance traffic flow for the other road users. | |||
Also, the drones are electrically powered versus the traditional method of delivery that mainly uses internal combustion engined vehicles for delivery. | |||
If the recharging cycle of the drones could be made green by the use of solar-, wind- or hydro energy then this combination would be less harmful for the environment. | |||
As shown in the analysis, by using the dynamic truck-drone deployment method the delivery times for parcel deliveries in Eindhoven can be decreased by 65.67%. This allows the delivery companies to increase their output capacity with the same number of employees. This way the costs for the company on hourly wages stays the same for an increase in revenue. Also since the trucks or vans used now don't have to visit each delivery destination, the fuel consumption and therefore fuel cost is decreased. Because of this decrease in costs for the company, the costs per package can be lowered for the end user (or buyer). | |||
Because it is a hybrid solution that still uses trucks, the current infrastructure of distribution centres is still usable. This means that no big investments have to be made in (specific) new infrastructure before the technology could be applicable. In other words, the initial costs of the technology only consist of the investment in the drones (and perhaps in the altering of some of the trucks to allow for easy drone deployment). | |||
Even though the technology can be very useful in crowded areas such as cities, in very highly populated areas such as Amsterdam, it might not be the most efficient solution due to the time loss of the truck in congested traffic. So the main area of applicability would be in smaller cities such as Eindhoven and perhaps villages. | |||
===Disadvantages=== | |||
Launching and landing in highly populated areas creates challenges for the drones. Obstacles such as trees, people, cars and buildings have to be avoided at all costs which will require some kind of sensing performed by the drones. Especially when using the dynamic deployment, the actual strategy design becomes rather complex, meaning that resources have to be spend to develop some algorithm or software that automatically plans the route, points of deployment, optimal number of drones per truck etc. These factors contribute to a higher initial cost of the technology. | |||
Another drawback is the increase in airtraffic. The use of flying delivery drones will result in a busy network of drones crossing above the cities. For some this might be considered 'landscape pollution'. Even though the drones take over the majority of the delivery process, trucks are still used to get close to the specific area. This means that there is still CO2 emission present in the process of delivery. | |||
Another disadvantage of this technology is the constraint created by the use of trucks. More specifically, the truck will only depart from the distribution centre whenever it is completely filled with packages. This delays the minimal delivery time for the delivery of a package. The worst case would be that when someone buys a product online, that package is the first to be entering a truck, then it has to wait for sufficient other purchases in the same area before the truck can depart. | |||
Probably the biggest drawback or challenge for the truck-drone combination is that of legislation. Currently in the Netherlands, this technology would not be legal. Multiple rules for drones prevent the use of drones in crowded areas. However, since the drones are used for specific areas (such as cities) at a time, they don't require to travel at very high altitudes and could stay at the lower parts of the airspace (<250m). This way, adapting the legislation would not be too difficult since most of these areas are already prohibited for other aircraft anyway. | |||
= The Zeppelin warehouse= | |||
The last option which we consider as a delivery method with drones for packages is the zeppelin warehouse. For this idea Amazon has been awarded a patent. The idea of this delivery method is basically a giant flying drone mothership zeppelin warehouse, better known as the airborne fulfillment center (AFC) at high altitudes of around 45.000 feet in the air. This AFC contains lots of products and unmanned aerial vehicles (UAV/drones) which are used for the delivery of these products. The UAV will leave the AFC to deliver the product when the customer places an order. An advantage of this delivery method is the fact that the UAV’s will be able to have a much wider delivery range while consuming less power as they would be gliding down to deliver packages instead of having to take off and land. To maintain the functionality of the zeppelin warehouse there are used some smaller airships to return the UAV’s back to the AFC, to resupply the mothership with more inventory and fuel and shuttle workers to the flying factory. Another advantage is there is the possibility to deliver items within minutes. The mobile nature of the warehouses would allow Amazon greater flexibility in managing inventory in the face of changing demand. For example, the patent offers a hypothetical case of deploying a AFC near a sport stadium to allow for immediate delivery of team merchandise and snacks during a game. Also the drones would be able to communicate with each other via a mesh network to give information such as weather and route. UAVs could also recharge on the airship. For a visualization of this idea see the image below. | |||
{| | |||
|- | |||
| [[File:ZeppelinWarehouse.jpg|thumb|none|alt=ALT|400px|Figure 12.1: The basic idea of a Zeppelin Warehouse]] | |||
|} | |||
==Implementation of the Zeppelin Warehouse== | |||
To make a success of the Zeppelin Warehouses and to realize the higher delivery ranges for packages, drones which can glide down effectively has to be implemented. When flown at a constant speed in still air a glider moves forwards a certain distance for a certain distance downwards. The ratio of the distance forwards to downwards is called the glide ratio (L/D ratio); this has to be highest as possible for this case: | |||
<math>\frac{L}{D}=\frac{\Delta s}{\Delta h}=\frac{v_{forward}}{v_{down}}</math> | |||
A glider's glide ratio varies with airspeed, however it usually varies little with vehicle loading; a heavier vehicle glides faster, but this impact on the glide ratio is assumed negligible since it is so small<ref>https://www.faa.gov/regulations_policies/handbooks_manuals/aircraft/glider_handbook/media/faa-h-8083-13a.pdf</ref>. For a few examples of glide ratio’s, see the following link:<ref>https://en.wikipedia.org/wiki/Gliding_flight#Glide_ratio</ref> | |||
Unfortunately the glide ratio for drones is unknown so an assumption has to be made for this (taking into account the known values). The optimal glide ratio at a given speed can be extracted from the glide polar, the glide polar shows the still air sink rate of the glider with respect to its ground speed. However, since the glide polar for drones is also unknown, a simulation based on dimension assumptions was made. To realize this, the following specifications have been used for the delivery drones: | |||
{| style="border: 1px solid black; border-spacing: 0; margin: 1em auto;" | |||
|+ '''Table I''' | |||
|- | |||
! style="border: 1px solid black; padding: 5px; background: #efefef;" | Drone specifications | |||
|- | |||
| style="border: 1px solid black; padding: 5px;" | | |||
{| border ="1" style = "border-collapse: collapse;" | |||
! Symbol | |||
! Value | |||
! Description | |||
|- | |||
! Mass | |||
| 2.8 <math>[kg]</math>|| Total mass of the aircraft | |||
|- | |||
! S | |||
| 0.28 <math>[m^2]</math>|| Wing area (Through fuselage as well) | |||
|- | |||
! b | |||
| 0.9 <math>[m]</math>||Span of the wing (through the fuselage) | |||
|- | |||
!<math> Swep_{deg}</math> | |||
| 15 [°]||Sweep angle of the wing [degrees] | |||
|- | |||
! <math>S_{ref}</math> | |||
| S||Reference area = wing area | |||
|- | |||
! <math>S_{wet fus}</math> | |||
| 0.65 <math>[m^2]</math>|| Wetted area of the fuselage (Including nose) | |||
|- | |||
! <math>S_{wet wing}</math> | |||
| 2.04 <math>\cdot</math>S <math> [m^2]</math>|| Wetted area of the wing | |||
|- | |||
! <math>L_{fus}</math> | |||
| 0.6 <math>[m]</math>|| length fuselage (Including nose part) | |||
|- | |||
! <math>A_{max}</math> | |||
| 0.07 <math>[m^2]</math>|| Max fuselage cross sectional area | |||
|- | |||
! <math>t_{average}</math> | |||
| 0.1 <math>[m]</math>|| Average airfoil thickness of the wing | |||
|- | |||
! <math>c_{average}</math> | |||
| 0.28 <math>[m]</math>|| Average airfoil chord length | |||
|- | |||
|} | |||
|} | |||
[[File:Glide_rate.png|thumb|alt=ALT|400px|Figure 12.2:Glide polar of a drone]] | |||
To construct the glide polar for our drone a simulation (in Matlab) has been constructed based on the theory of aircraft aerodynamics. <ref>http://kimerius.com/aerodin%C3%A1mica-4/</ref><ref>https://arc.aiaa.org/doi/book/10.2514/4.103278</ref> | |||
The main concept used is to determine the drag and lift forces for a sufficient range of airspeeds. With these values, the glide ratio can be determined for this range of speeds which allows the construction of the glide rate plot. | |||
Here the y-axis is the horizontal flight range in meters when the drone is at 1000m altitude, compared to the flight speed on the x-axis in [km/h]. As shown in the figure, the optimum glide ratio for an unloaded drone occurs at a ground velocity of 74.7 [km/h], which yields a glide ratio of 11.21. | |||
The AFC can be used in two different scenarios, above a densely populated area or above a sparsely populated area. | |||
===Above a sparsely populated area=== | |||
[[File:zeppelinwarehouse2.png|thumb|left|alt=ALT|400px|Figure 12.3: A Zeppelin Warehouse at 45,000 feet]] | |||
Above a sparsely populated area delivery range is more important than fast delivery times. This is mainly because using multiple small-range AFCs in a sparsely populated area is very expensive, while there are very few packages ordered. This would then drive up the delivery costs dramatically, which then results in fewer people using the service. So in this case the speed of the drone is chosen as the speed with optimum glide ratio, this velocity is then 74.7 km/h, this then gives a glide ratio of 11.21. With this glide ratio, assuming the AFC is positioned at 45,000 feet as in the patent of Amazon, the maximum delivery range is then 153.75 km. A problem with a delivery range of 153.75 km is the flight back, since the flight range of the drones is only 32 km, the drones are unable to fly this distance in one go. A possible solution is to put rings of recharging pads at 32 km intervals around the refill centre, this however would result in 4 rings of increasing size around the refill centre. Since these charging pads are not likely to be extremely cheap, and considering the large amount of pads which are going to be necessary to implement this, this solution is very likely to be expensive. | |||
Another option would be to place pickup points for the drones around the refill centre. From these pickup points, the drones will then be transported to the refill centre for example by truck. This would mean that for each zeppelin, at least <math>\frac{\pi \cdot 153.75^2}{\pi \cdot 64^2}=5.77</math> pickup points are needed, not including overlap between radii. It may also possible to replace these pickup points with refill stations, this would save the trouble of getting the drones from the pickup points to the refill station. However this would result in a large amount of refill stations, these stations all have to be restocked with supplies. This is a lot more difficult than resupplying just one refill station, since then all supplies are centrally stored, instead of some items being in one warehouse, while others are somewhere else. Also, each of these refill stations have to be equipped with at least one refill ship. This would result in the posibility of parallelising restocking, which can save time. However, since the refill ships need a certain amount of cargo to be rendable to fly, this process will not likely be as fast as it sounds. Next to that, the refill ships are likely to be expensive, as well as the refill stations themselves, so this solution is likely much more expensive than the implementation of pickup points. | |||
===Above a densely populated area=== | |||
[[File:populationdensities.jpg|thumb|alt=ALT|400px|Figure 12.4: Population densities during the day and night in certain American cities<ref>http://www.joelertola.com/grfx/index.html</ref><ref>Time magazine Nov.26, 2007 issue</ref>]] | |||
Above a densely populated area the use of the AFC resembles closely the use of the beehive. The delivery range does not have to be large, since there will be a lot of orders within the city. This means that the speed of the drone can be increased, since it is no longer important for the delivery range to be optimal. The minimum altitude at which the AFC should be positioned can be calculated according to <math>\frac{v_{ground}}{2 \cdot glide ratio}[km]</math>. With the AFC positioned at 45,000 feet, a glide range of 64 km can be achieved at a velocity of 128 km. This is ideal if charging pads are used, because this is precisely twice the flying range of drones, so only one ring of charging pads is needed for this solution to work. Also, this choice of speed results in a maximum delivery time of 30 minutes, which is ideal for users and enterprise. | |||
During the day, people move from their home to their work or education, this mainly results in a movement of people from villages to the city. Since an AFC is mobile, this shift in population density can be acted upon by moving the AFC around during the day. In this way the AFC is always close to the busiest areas, where the most packages are ordered. This will massively decrease delivery times, since the AFC is already close to the delivery point. This also results in that the drones can be used more effectively, since the time of flight per delivery is reduced, the drones can deliver more packages per day. Also this increases the effectivity of the AFC, since there will be a lot of packages which can be delivered from the AFC in a short time. | |||
===Airspace regulation=== | |||
[[File:Airspace_classes.jpg|400 px|thumb|alt=ALT|Airspace classes as defined by the FAA<ref>http://www.dronitaly.it/wp2015/lera-del-regolamento-enac-versione-2/</ref>]] | |||
In both of the listed cases, it is important to consider that the AFC is positioned in the air. This brings with it the troubles of regulating air traffic around the AFC. The AFC is position is chosen at 45,000 feet since that is above all other air traffic, however, this does mean that the drones have to cross the airspace of, amongst others, airplanes. Also the refill ships have to cross this airspace when restocking the AFC. Currently, the airspace regulations state that between 18,000 and 60,000 feet is reserved for airplanes, but this region could also be used for autonomous drones<ref name=popularmechanics>https://www.popularmechanics.com/military/a9397/this-is-how-the-faa-regulates-american-airspace-15894142/</ref>. A possible solution could be to instantiate a no-fly zones underneath the AFCs, in this way the trouble with the air traffic control is avoided entirely. This however would mean that these no-fly zones vary in location during the day, this may cause problems for air traffic control since they have to account for these no-fly zones when they decide where each plane should fly. This also makes the planning of plane routes difficult if the movement of the AFC is not strictly regular. | |||
Another possibility would be to make the drones comply with the current regulations for planes. This would mean that the unmanned drones have to be equipped with transponders which communicate altitude and location to local air traffic control. Also these drones have to be equipped with sensors which enable them to detect and avoid planes in cases of emergency<ref name=popularmechanics/>. This would mean that the routes the drones will fly first have to be approved by local air traffic control before the drones can take off, which is very likely to cause delays. This also puts a lot more stress on air traffic control, since they now also have to account for the drones coming from the AFC. | |||
==Advantages and disadvantages== | |||
The concept of the airborne fulfillment centre has been discussed, as well as its implementation. Now the main advantages and disadvantages are important to list, so that is done below. | |||
===Advantages=== | |||
The speed at which the drones fly can be varied according to how far the drone has to fly. So if a larger delivery range is necessary, the speed of the drones can be decreased, this then increases the glide ratio, and thus the glide range, of the drone. This enables the AFC to be used in multiple different scenarios, each with their own advantages and disadvantages. | |||
If used above a densely populated area, the AFC mainly has the advantage that it is mobile, so it can move along with population density shifts during the day. This enables the AFC to be used optimally during the day, this means that the delivery time is as short as possible, which enables the drones to deliver more packages per day. Next to that, the delivery time is less than 30 minutes if the speed is chosen at 128 km/h. | |||
If used above a sparsely populated area, the AFC mainly has the advantage that is has a very large delivery range. This means that only one AFC is needed to supply a large area, which saves money compared to when multiple AFCs are necessary. | |||
If the AFC has a shorter delivery range, it becomes a beehive in the air, so the warehouse can be placed closer to the city without requiring ground to be build upon. This has the advantage that delivery times on average can be shorter, since the AFC is placed more centrally above the city. | |||
===Disadvantages=== | |||
If the AFC is positioned at 45,000 feet, the drones and refill ships have to cross the airspace of planes often. Currently this is not allowed anywhere in the world, since the airspace of airplanes is strictly regulated. New legislation will have to made to fix this problem. This legislative process will cost much time and research to be completed, since this is a large adaption to the current airspace regulation. | |||
Another drawback of the AFC is that drones have to navigate alongside other air traffic, including airplanes and other drones. This would mean that the drones have to be equiped with yet to be developed sensors, which enable the drones to avoid other air traffic in cases of emergency. Since these sensors do not exist yet, research and development needs to take place before the legislative process of allowing drones in the airspace of planes can even begin. | |||
Yet another disadvantage is that if a large delivery range is chosen, then the delivery time becomes large. For the maximum delivery range of 153.75 km, the delivery time is almost two hours. This comes with the problem of getting the drones back, which is likely to be a time consuming process, with a large investment cost. | |||
=Recommendation= | |||
After conducting a survey that gauged the user's preferences on the parcel delivery method and comparing/investigating the current parcel delivery system with the three alternative methods involving drones, a final conclusion can be made. To be able to do this multiple criteria are considered part of a decision matrix on which the final recommendation can be based. | |||
==Decision Matrix== | |||
The decision matrix is based on criteria that have been investigated in this project. These criteria are: | |||
*Costs: | |||
**Initial costs | |||
**Delivery costs | |||
**Company costs | |||
*Delivery options | |||
**Single package | |||
**Exact location | |||
**Delivery time | |||
*Impact on surroundings | |||
**Implementation possibilities | |||
**Pollution | |||
**Traffic fluency | |||
All of these criteria are then weighted. For the criteria such as delivery costs, delivery time, single package and exact location the weights can be based on the output of the user's research done in this project. For the other criteria the weights have to be determined in other ways. In the example decision matrix that is shown on the right, values are chosen for the remaining criteria. However these should be based on the specific profile of the delivery company and the area of application. This way a parcel delivery company that promotes 'green' vehicles for their deliveries could optimize the decision matrix to choose for a higher weighting factor for the pollution and perhaps the traffic fluency criteria. | |||
The main challenge for the implementation of such a decision matrix is that of the accurateness of the data for each of the methods. To improve the robustness, follow up research should be done on these methods. This research should then try to obtain more accurate data on criteria other than delivery times, such as initial costs, maintenance costs, levels of pollution etc. Also the fact that most of the criteria correlate to each other, causes more difficulty in determining the correct corresponding data and weighting per criteria and method. However, based on the research done in this project, a relative ranking between the 4 methods can be approximated that allows to simulate a possible output for the decision matrix. | |||
Important to note is not every criteria can be rated in the same way. Some criteria can directly be assigned to a method but some are area dependent. Therefor it is chosen to take some of the criteria out of the decision matrix and combine them with the population density matrix. This way the criteria combine their possibilities for each method per population density level. The criteria taken into account are the population itself, the traffic fluency and the implementation possibilities. It is chosen to combine the area dependent criteria in the weighting of the population density matrix. The last remaining criterion is the delivery time, which is completely depend on the area of delivery for each method. To be able to implement this criterion, values can only be obtained by running the simulations for that specific scenario. | |||
To show an example of an output for the decision matrix, 2 different cities are considered. | |||
These cities are: | |||
*Den Haag | |||
*Tilburg | |||
Let's assume that 50 parcels have to be delivered randomly spread accross the city. For both the Beehive and the AFC the delivery drones can be instantly engaged to all targets because their capacity is considered to be larger than 50 drones. For the Truck-drone combination a capacity of 10 drones is assumed together with the 50 parcels, this way (for ease of calculation) it is assumed each drone does approximately 5 deliveries each, for T-D delivery. | |||
For Den Haag, choosing a location in the centre of the city allows to have all destinations in a radius of 5.9km at most. Assuming a delivery speed of 50km/h for the drones in the Beehive and Truck-Drone method and a delivery speed of 90km/h for the drones in the zeppelin (AFC) method. This way the max delivery time for the Beehive would be 5900m/(13.89 m/s)= 425s, the truck-drone method approximately 2455s while the AFC would have 249.2s, if it is assumed to be hovering at 2km altitude above the centre or 415.6s when it is assumed to be hovering at 2km above a non-populated area (the sea in this case) and 661s if it is hovering at that same position but then at an altitude of 13km. | |||
{| | |||
|- | |||
|[[File:DM_Den_Haag.png|thumb|none|alt=ALT|1000px|Figure 13.1: Decision Matrix for the parcel delivery systems in the city of Den Haag (population density of 6429 inhabitants/km^2)]] | |||
|- | |||
|} | |||
For Tilburg, choosing a location in the centre of the city allows to have all destinations in a radius of 4.8km at most. Assuming a delivery speed of 50km/h for the drones in the Beehive and Truck-Drone method and a delivery speed of 90km/h for the drones in the zeppelin (AFC) method. This way the max delivery time for the Beehive would be 4800m/(13.89 m/s)= 346s, the truck-drone method approximately 3607s while the AFC would have 208s, if it is assumed to be hovering at 2km altitude above the centre or 333.6s when it is assumed to be hovering at 2km above a non-populated area (a forest area in this case) and 612.64s if it is hovering at that same position but then at an altitude of 13km. | |||
{| | |||
|- | |||
|[[File:DM_Tilburg.png|thumb|none|alt=ALT|1000px|Figure 13.2: Decision Matrix for the parcel delivery systems in the city of Tilburg (population density of 1826 inhabitants/km^2)]] | |||
|- | |||
|} | |||
The output of this decision matrix gives a good indication towards the final recommendation. According to the results, for the case of Den Haag, which has a very high population density, the Beehive delivery centre would be the most optimal solution. Its ability to deliver lots of parcels in short amounts of time outweighs the disadvantage of high start-up costs. Also the main limitation of the Beehive is its limited delivery range, which is in a scenario such as Den Haag, is not a problem. The population density is sufficiently high to keep the Beehive busy delivering parcels while the delivery range is small enough if the Beehive is placed near or in the city. | |||
For the case of Tilburg, with a much lower population density, the Truck-Drone combination is the most optimal solution according to the output of the decision matrix. Due to its low start-up costs, low delivery costs and adaptability in medium population density areas, the disadvantages of (rather) slow delivery times and high pollution rates can be outweighed in the case of Tilburg. | |||
=Coaching Questions= | |||
[[Coaching Questions Group 10]] | |||
=State of the art= | |||
[[State of the art Group 10]] | |||
==References== | |||
<references /> | |||
=Minutes tutor meetings= | =Minutes tutor meetings= | ||
[[Minutes tutor meetings Group 10]] | [[Minutes tutor meetings Group 10]] | ||
Latest revision as of 21:39, 5 April 2018
Introduction
Nowadays, already 43% of the world’s population is connected to the internet and online shopping is becoming increasingly popular [1] [2]. Since articles bought online have to be delivered to the requested address, parcel delivery is becoming more and more important in daily life. In 2010 already 90 million packages were deliverd in the Netherlands, in 2014 this number more than doubled to 190 million[3]. If the increasing trend continues, then in 2020 there will be 280 million packages to be delivered. This big demand for parcel delivery causes increasingly difficult last mile logistics for the parcel deliverers [4].To keep up with the huge increase of online shopping and to meet the wishes of the user, delivery companies are coming up with more and more creative ways of delivering packages. A good example of such a company is Amazon, which announced for example a key and a locker that makes it possible to deliver packages at the home of the customers when they are not there at the moment [5] [6].
Nowadays parcels are delivered one by one by people, however, with drones becoming more sophisticated, drones might be able to improve this process in multiple ways. This project focuses on three of these possible implementations. All considered applications are ideas Amazon is currently investigating and will possibly be used by Amazon in the future. The first method is by using warehouses which house drones, called beehives [7]. These drones then do the parcel delivery directly from the warehouse to the buyer. The second method is to drive a truck to a certain location, from where the drones will deliver the parcels to the buyer [8]. And the third method is to have a 'flying warehouse', for instance a zeppelin, hang in the air, from where the drones can deliver parcels to the buyer [9].
In this project it will be examined whether and in which areas the aforementioned three methods are an improvement compared to the current delivery method. Therefore the advantages and disadvantages of the methods are investigated and compared with each other. Also the users should be incorporated, their needs and desires are vital in deciding if and how drones should be implemented in parcel delivery. These will be visualized based on a survey.
Problem statement and objectives
Problem statement
As discussed in the introduction, parcel delivery by means of drones can be implemented in several ways, to determine how these methods compare to the current method each of these methods needs to be investigated thoroughly. Next to that the users, society and enterprise need to be incorporated in determining if and, if indeed necessary, how drones should be implemented in parcel delivery. The problem tackled in this project is the problem of if and how drones should be implemented in parcel delivery. This leads to the research question:
How does parcel delivery by means of drones compare to the current way of delivery?
Objectives
The objective of this project is to make an analysis of the current parcel delivery method and several new methods of parcel delivery using drones. The analyses of the delivery methods using drones to the current method are then compared to see what the advantages and disadvantages of each method is. With the results of these comparisons and the results of the survey it can be determined if and how drones should be implemented in parcel delivery.
Approach, milestones and deliverables
Approach
For this project the work was split in three parts, the literature study, the survey and the models.
The literature study was performed to learn more about the state of the art of drones. This gave us a good basis from which we could start our analysis.
The survey was done to find out how users think about the current parcel delivery system, where they would like to see improvements and which parts of the delivery system are annoying to them. This helped us in determining which parts of the delivery system as currently used can be improved upon.
The different delivery methods were modeled to get a good impression of the advantages and disadvantages of these systems. By then comparing these (dis)advantages with the preferences of the users the best solution was determined.
Milestones
Several milestones were defined to measure our progress during the project.
For the literature, the goal is to have at least 25 articles studied and summarised.
For the survey the goal is to have at least 75 surveys filled out.
For the models, the goal is to be able to have absolute numbers for amongst others the time-gain and costs.
The final milestone is to make a relevant comparison between the results of the survey and the outcome of the model.
Deliverable
Our deliverable is a report in which all our findings can be found, as well as the results from the survey and the models. With these results a final recommendation is given based on a decision matrix that has been constructed.
Planning
- Pam: responsible for the survey and the model of the Zeppelin warehouse
- Thibeau: responsible for model of truck-drone delivery
- Marc: responsible for model of beehive system
- Nol: responsible for analysis of current system
- David: responsible for the wiki and the model of the zeppelin warehouse
Stakeholders
Users
Buyers
The user of this system is the buyer of online products, the buyers are interested in a system which gives them fast and cheap delivery. They also want their package to be safe and undamaged during delivery. Next to that users do not want to have to be at home at a specific time to get their package.
Drones could provide for these wishes, they do not need a salary, which could save money for the seller of products, and thus also for the user. Drones could also provide undamaged delivery, as drones only carry one package at a time, so damage during transport is unlikely. Next to that drones can be used at any time of the day, so timing the delivery becomes easier.
However drones also have disadvantages for the buyers, for instance drones have to be able to see where they are going, so they may need cameras installed on them. Buyers will likely oppose camera images of their homes to be saved and stored. Also drones are often remotely accessable, so they may be hacked and taken over by others.
Society
Neighbourhoods
For neighbourhoods in general using drones mainly has disadvantages, the use of many drones by different companies could lead to noise disturbances in densely populated areas because of large numbers of drones flying around. This would be especially bad at later times of the day, since drones can fly almost 24/7 packages can be delivered at any time of the day. This could mean that at night many drones still fly around delivering packages when people want to sleep.
Also privacy is an important factor here, because drones need vision, camera images of neighbourhoods may be recorded. If these images are stored instead of deleted, people will likely oppose the use of drones.
Government
For the government the use of drones means a whole new set of laws which have to be formulated. These laws mainly have to do with the privacy issues and noise disturbances. The government needs to enforce laws to protect the privacy of their inhabitants, in that way people will feel reassured and safe, this could greatly help the use of drones. Also if the government makes clear airspace regulations the noise disturbance experienced by neighbourhoods could dramatically decrease.
Enterprise
Supplier
The enterprises which are affected by the implementation of drones are the parcel delivery services. For these companies it is important that deliveries are quick, so that they can deliver more packages per day. Next to that cheap delivery is important while still keeping the packages safe and undamaged.
Using the current delivery methods (trucks, bicycles etc.) companies cannot keep up with the amount of packages which have to be delivered on a daily basis [10]. which can also be concluded from their descending delivery quality graph shown in Figure 5.3.1
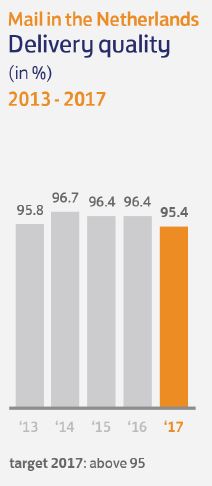
.
Drones could provide a new way of parcel delivery, which can help companies like PostNL deliver their packages faster and cheaper. Amazon is one company in particular that stands out since it is web shop that is already making steps in the direction of delivery but mainly in the United States. In the Netherlands there is a company that is quite like Amazon and might also be very interested in the idea of Amazon. The company is Bol.com which just like Amazon started as a book seller and is now one of the biggest web shops in the Netherlands. To investigate the parcel delivery of Bol.com, the main stakeholder that is important, is PostNL since that is the company that deals with delivery of packages.
It is already said that drone delivery might be a solution to the huge demand of package deliveries, but to come to quantitative conclusions more information about the need for fast parcel delivery system is needed. This information can be distracted from the following links: [11][12] and is structured in Figure5.3.2
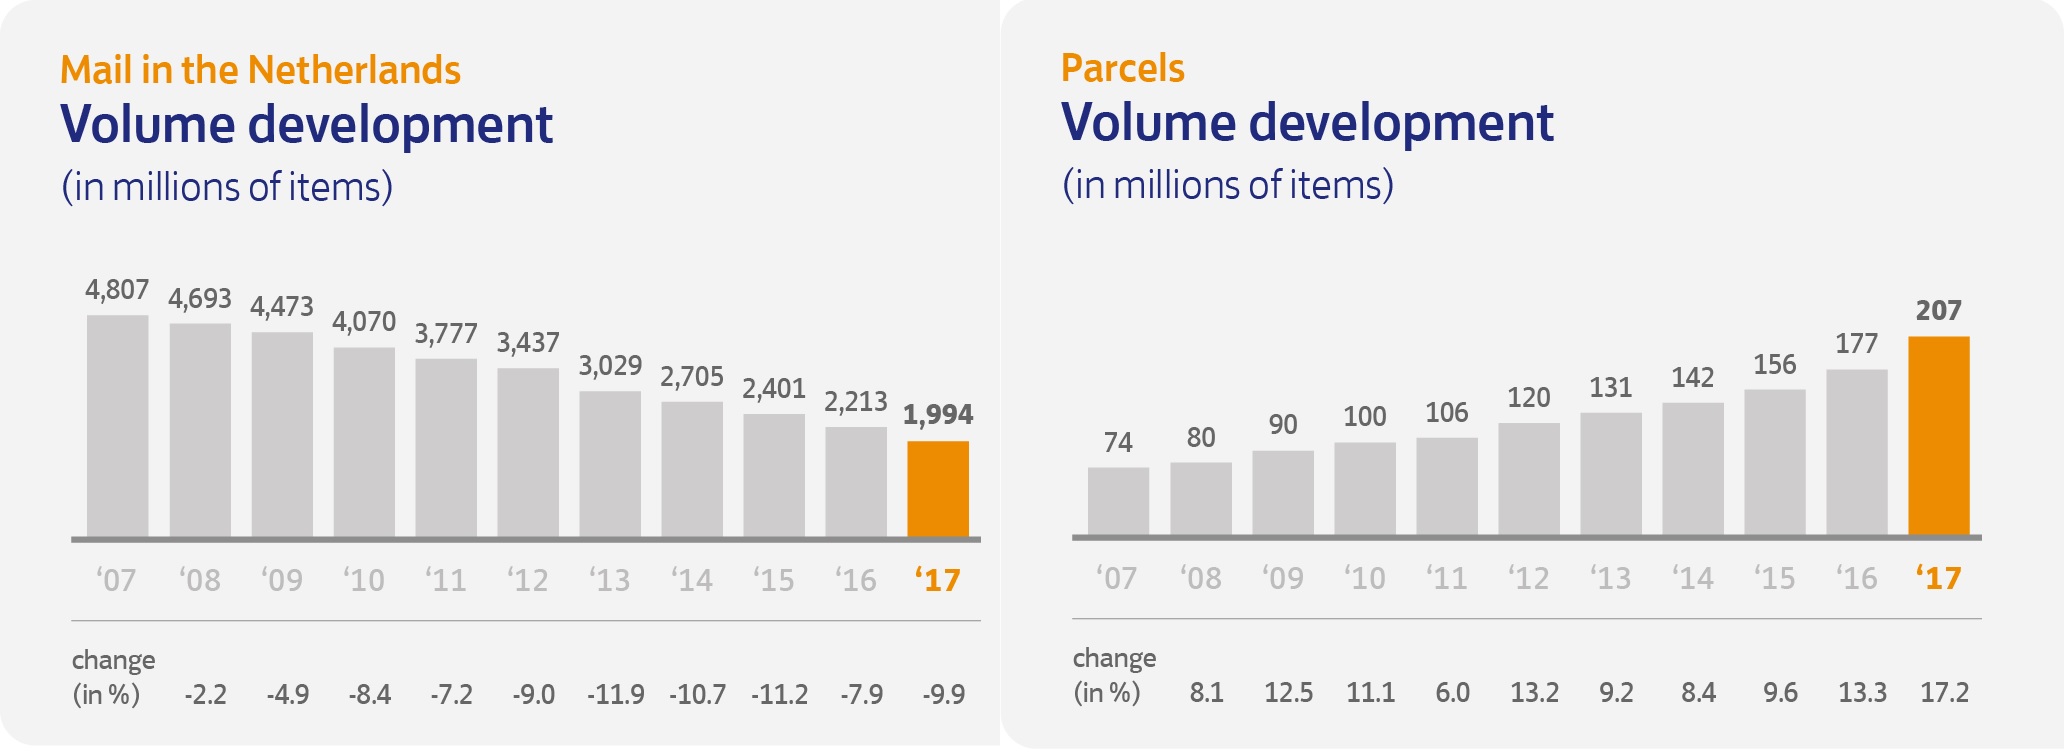
From the graphs it can be concluded that the parcel delivery systems needs to be optimized in order cope with the stress and other problems that come with the current delivery system.
Assumptions
Currently the state of art of parcel delivery drones is all in design and testing phases. Therefor direct research on the subject is quite difficult since the information available sometimes correlates and other times proposes the opposite of one and other. To be able to continue this research, a couple of assumptions have to be made. These assumptions are based on scientific research and will be used baseline for the project. Almost every assumptions will be substantiated with articles found online.
Assumptions on parcel delivery drones
Delivery Drones
Depending on the circumstances and needs of the enterprise and customers there are several ways to do parcel delivery's by flying drones. In this chapter an analysis will be made on the advantages and disadvantages of the proposed options. The choice of delivery system and its matching drone will be further analyzed in later chapters and a concept of a possible delivery system will be proposed.
Single rotor

The look of a drone that only has a single rotor is most easily described as a normal helicopter containing a pilot. This implementation uses one big rotor to travel vertically and also horizontally. The use of only one rotor will impact its power and maneuverability since there is only one rotor that needs to do all the work. Therefor this implementation will only be able to lift relatively light loads and the battery life will be low. Another downside of a single rotor is that the rotor needs to be pretty big which makes it mobility very low and not suitable for landing near a house on the street. The price of a professional single rotor helicopter is near €600,-[14]
Multi rotor

The most well-known drone for hobbyist and people with a little bit general aviation knowledge. Multi rotor drones are known for their stability and safety. The multiple rotors make it possible to keep the drone very stable and with the smaller blades and often applied “mudguards “ makes it also very safe for the customers and people around the delivery point. A down side of multiple rotors that have a relatively small diameter also drain a lot of battery if you want to enable a sufficient large working area for the drone. The costs of a Multirotor will be around €3000,- [16] [17]
Fixed Wing/Glider
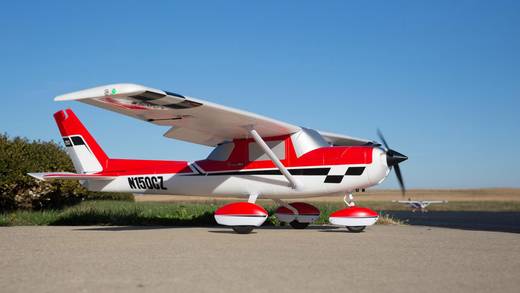
Fixed wing gliders are more known for its application in the military due to his very high distance range and low energy use but it can still have its place in the parcel delivery industry. Another few advantages of a glider drone is that it travels faster than the multirotor drone variations where the rotors are direction vertically. Hobby remote controlled airplanes can already reach speeds of around 140 km/h. It is however limited by the package size and mass since the size of the package will determine the shape of the plane and maybe make it less aerodynamic. This can be remedied by placing the package internal in the drone. In comparison with vertical multirotor drones, are fixed wing drones capable in less weather situations(manned helicopters are capable to fly with wind power 11 [19]). And because it can glide more to lift off are possible for the drone such as catapulting. The reason that is a plus point is because it will save a lot of battery if the drone won’t have to use power to lift from the ground. The biggest problem with glider drones is that they can’t fly straight vertically to land. This makes it harder to implement a glider drone for parcel delivery tasks in busy city’s. Also the safety of these kind of drones will be a problem. With speeds of 140 km/h the plane can cause serious damage to humans, cars and buildings which makes this type of drone very dangerous. The costs of an Fixed wing drone will be around a professional well known RC Cessna 150 of €530,- [20]
Fixed wing hybrids
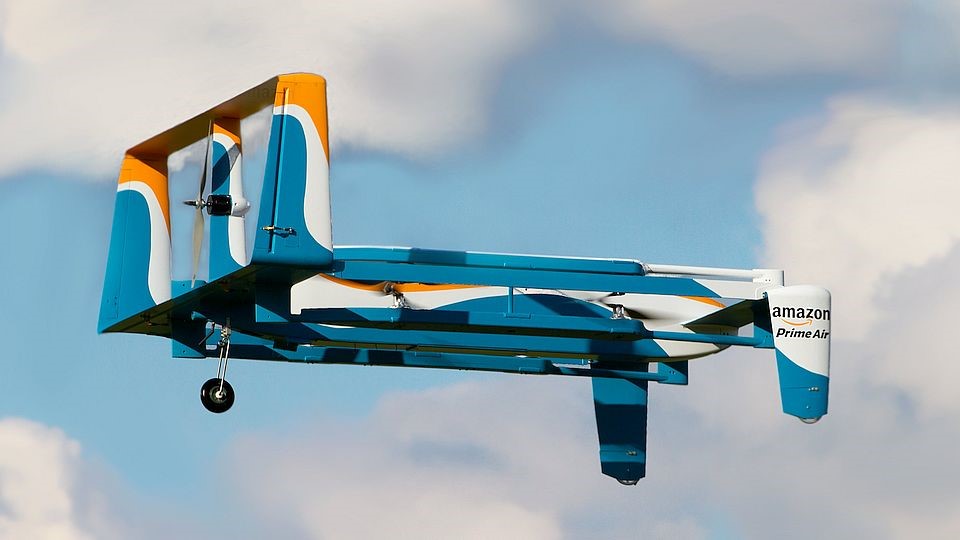
This type of drone is already in a very high stage of development by several companies including Amazon. This type of drone mixes the best of multiple worlds. It can glide in the sky and its lift off can be aided by a catapult which will guarantee better battery life and speed. It can also float in the air stationary which makes it much more applicable for delivering parcels. The speed will be comparable to the glider drone when it flies horizontally. The load will be sufficient enough, knowing that Amazon is already marketing it for the use of 5 pound parcels. Its ability to switch to “helicopter” mode makes it also a lot safer and when looking at the design Amazon already uses it can be stated that the rotors won’t cause harm. Costs about this drone are unknown but it is very certain that this type will be the most expensive of all types.
Zeppelins
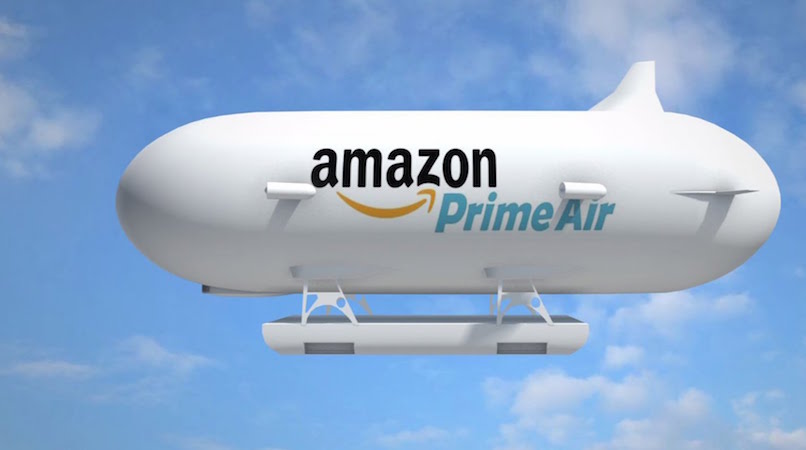
It is an Idea to use zeppelins to deliver drones. Zeppelins have the ability to lift of easily while having low power usage which will make the battery life longer. The drawback that comes with the low power use is a very slow locomotion. And with that comes that because the device is relying on lightweight gas the zeppelin, depending on its size, is very susceptible to weather conditions due to its relatively large surface area and light weight. It is debatable whether zeppelins are safer then multi rotor drones since the likely hood of failing is bigger but when it fails it is not a loose projectile but falls a lot slower which gives less direct human injuries but probably a lot more traffic accidents. The reason for more failure is mainly because of the size of the device which makes it susceptible to vandalism and hard to reach places. The costs of the zeppelin depend on the gas used and the preferred size that is going to be used. In terms of technology the zeppelin is probably the cheapest because the battery will not have to be high level. The size of a zeppelin can be of use when taking in consideration to implement solar cells. This will make the zeppelin extremely power efficient.
Limitations of the drone’s flying radius
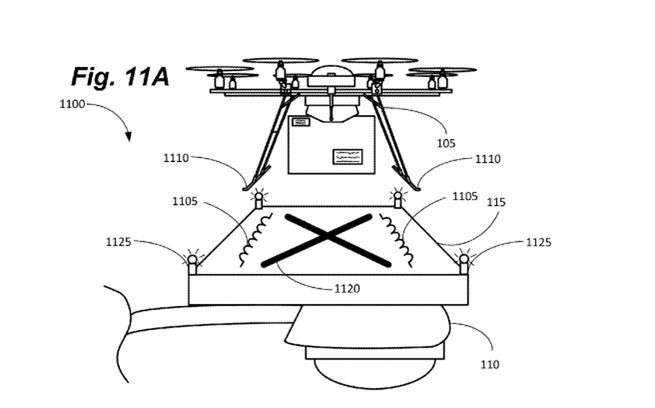
It is important to look into the possibilities of the delivery drones in terms of reach. To be able to analyse the situation, the Amazon prima air delivery drone is used. In their current research status, these drones can cover a total distance of 32 kilometres. This means that the drones can fly within a radius of 16 km from the distribution center on a full battery. It is possible to extend the reach of a drone by placing charging stations on objects like bus stations, street signs or lampposts. The latter application is already thought of by Amazon, see figure 7.6.1 By applying this option, the distance one drone can cover will increase with 200% since the first time the drone can fly straight for 32 km, before fully charging and then cover another 16km so it can still return to the charging pad. This would mean one distribution center that deploys the drones can cover up a radius of 48 km and therefor a surface of 7234 km2.
Current Delivery System
For the current delivery systems the trivial method of parcel delivery trucks is used. These trucks start from distribution centers that are currently scattered by PostNL. The locations are according to the website of PostNL[25] placed in or near the cities:
- Amsterdam (postcodegebied 1000-2199) PostNL Sorteercentrum, Liniepad, Halfweg. This is very west from Amsterdam close to Harlem
- Den Haag (postcodegebied 2200-2899) Forepark
- Nieuwegein (postcodegebied 3400-4299 & 6500-6999) Grote Wade 80, 3439 NS Nieuwegein
- Rotterdam (postcodegebied 2900-3399 & 4300-4999) Terbregseweg 300
- Den Bosch (postcodegebied 5000-6499)De Steenbok 2, 5215 ME
- Zwolle (postcodegebied 7000-9999)Anthony Fokkerstraat 2, 8013 NS
The delivery process can be summarized in the following steps:
- An order on a web shop like Bol.com is made
- From the web shops the package gets send stockroom to a distribution centre
- The parcel is processed in that distribution centre
- The parcel is send to a post office near clients home or directly to the clients home
In this delivery process the first three steps will not be innovated in this project., but instead the last step will be optimized by delivery drones.
Quick clarifying analysation
In order the get a quick analysis on how much time a parcel delivery truck takes when delivering a package, a time delivery interval should be derived showing both extremes in time. This way a quantitative conclusion can be drawn on the time efficiency of delivery trucks. The average work radius of a delivery truck is approximated to 48 km. This approximation is based on the location, amount and distribution of distribution centers. When taking into account that the surface of the Netherlands is 42.000 km2 and there are 6 distribution centres so each centre will have a working radius of (sqrt(7000/pi=) 47.2 km. This radius does not seem to take into account that some distribution centres are located closely together and others are very far from others but it is an average and it seems reasonable since at 48 km the delivery trucks radius don't overlap in the country but do overlap a bit in the high population dense cities where it is needed due to high chance traffic jams and high traffic density. From the approximation of 48km it can be calculated what the time efficiency of the current delivery system at its fastest by checking the travel time of 2 cities of extremes. The two extremes depend highly on the population density and the traffic that correlates with it. To see which city is the busiest and which is the least busiest, Figure 8.1.1 and 8.1.2 show the traffic in the rush hours.
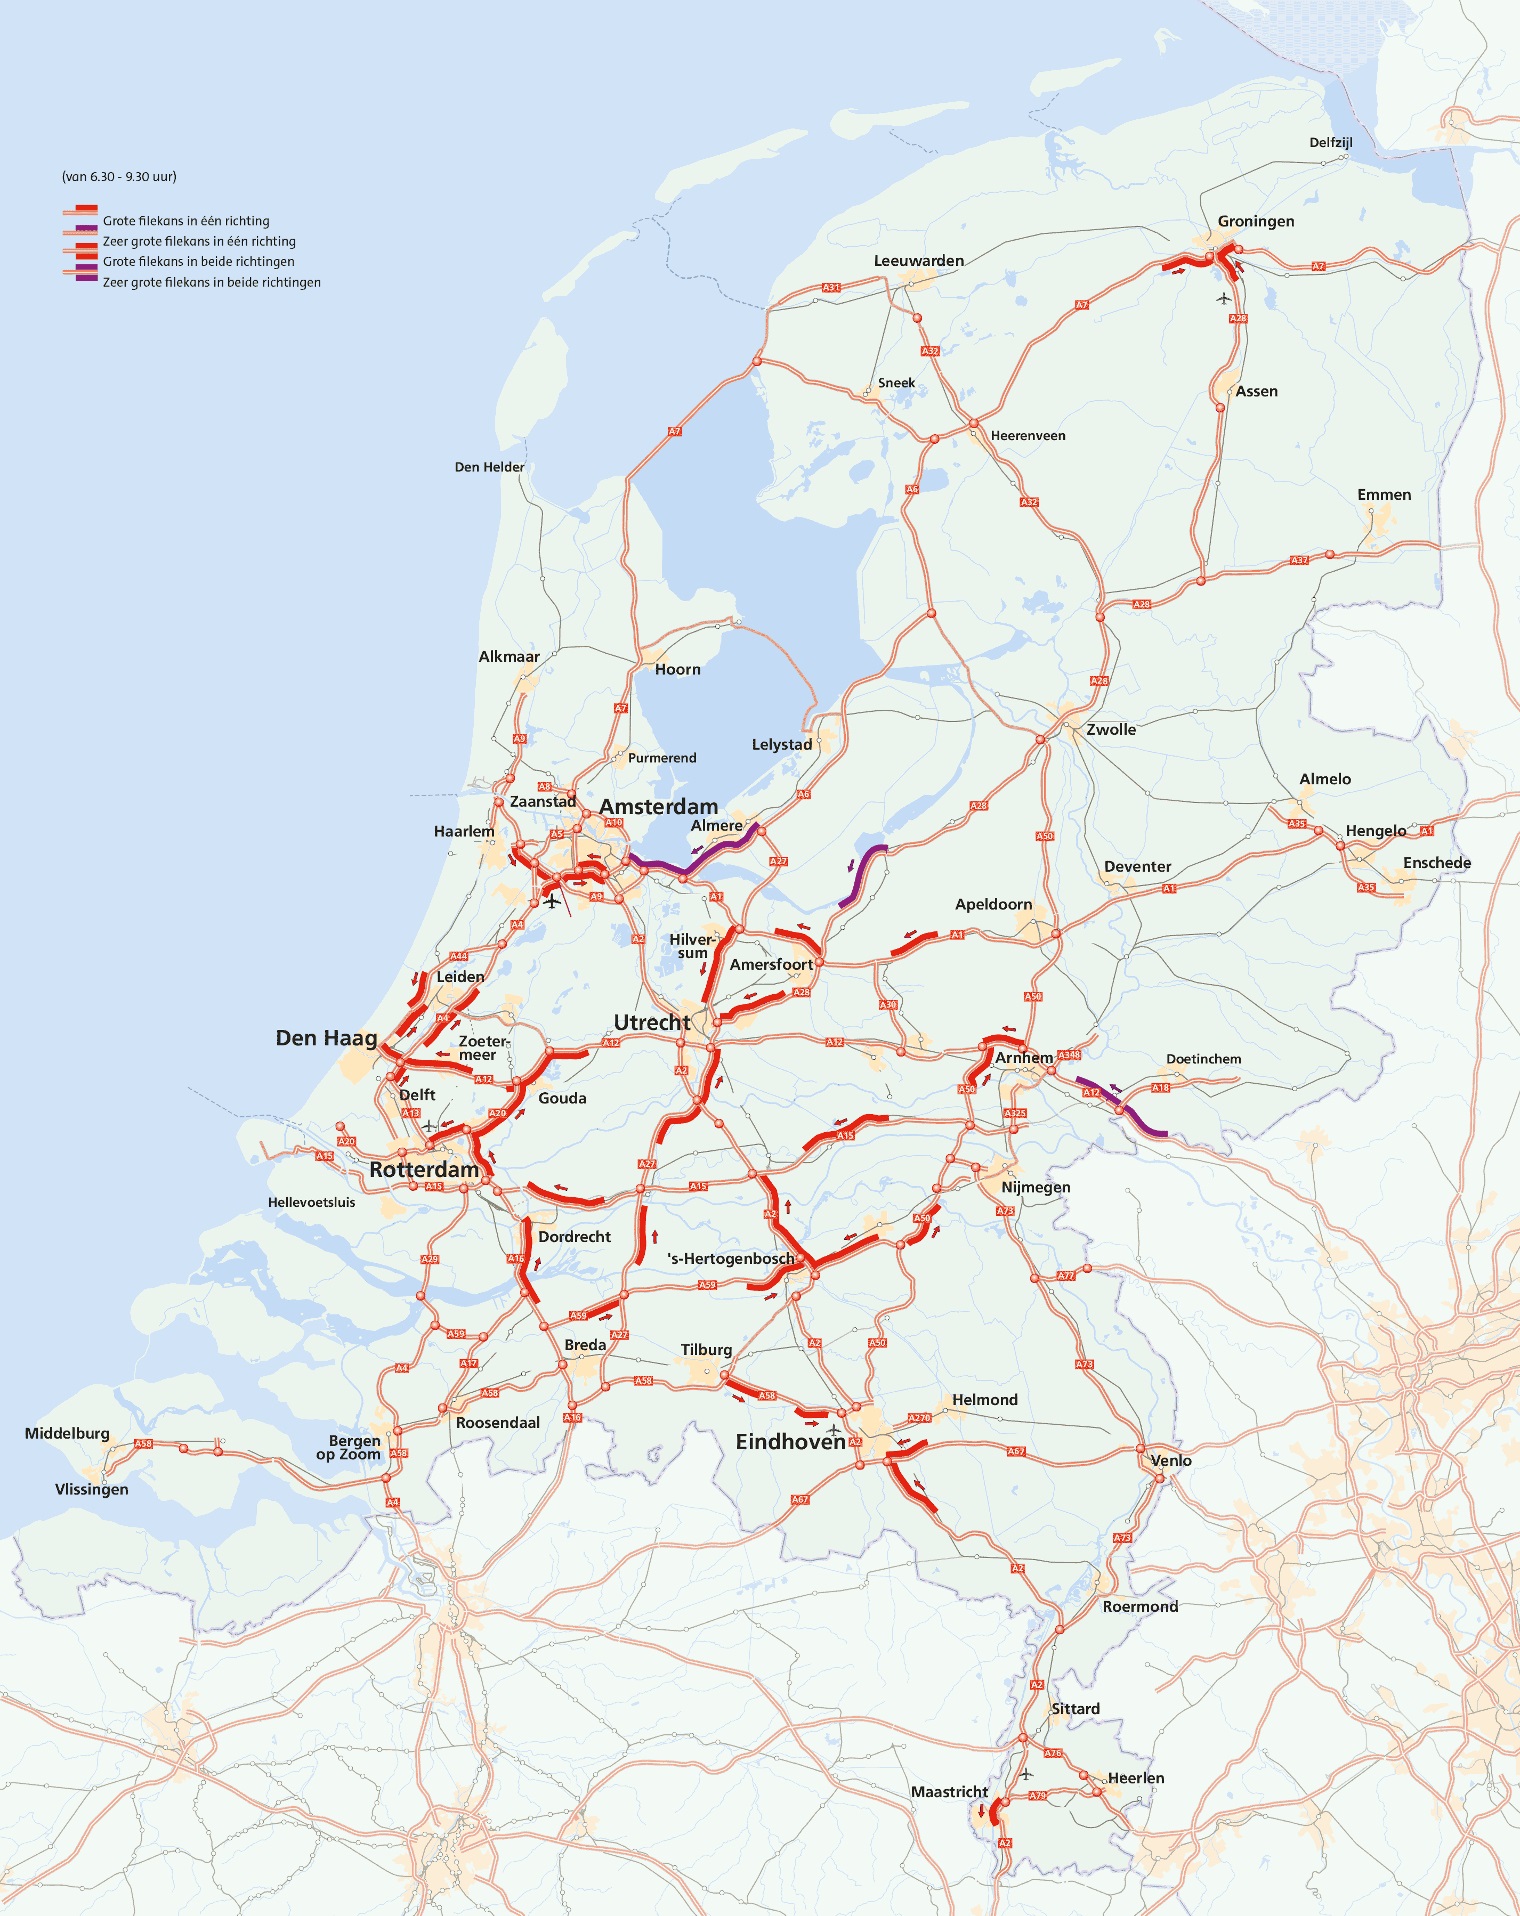 |
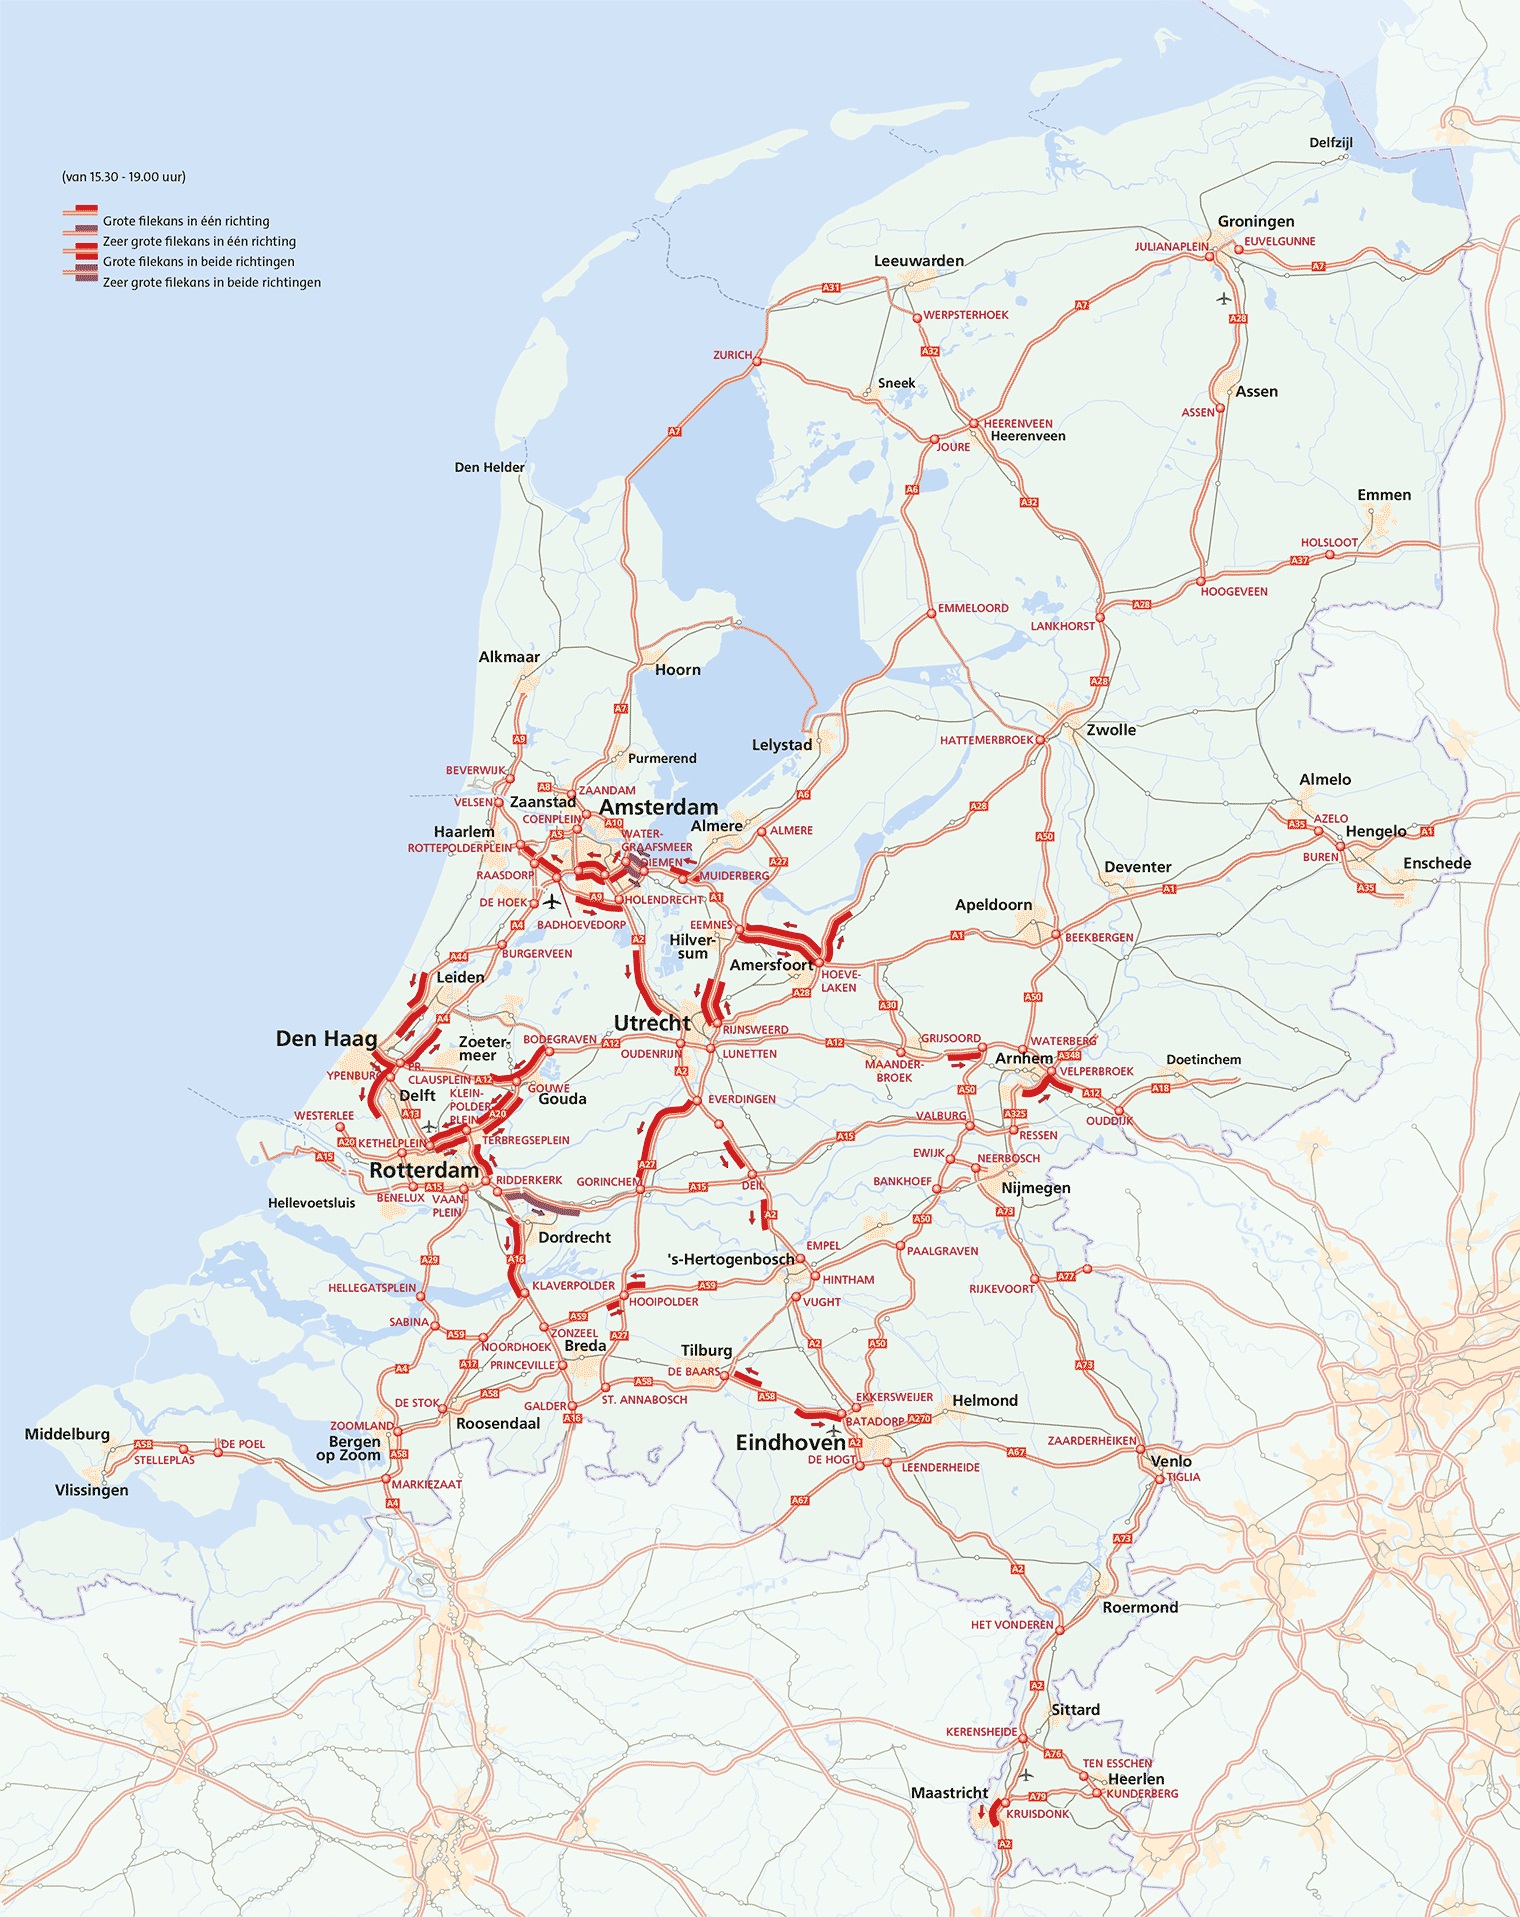 |
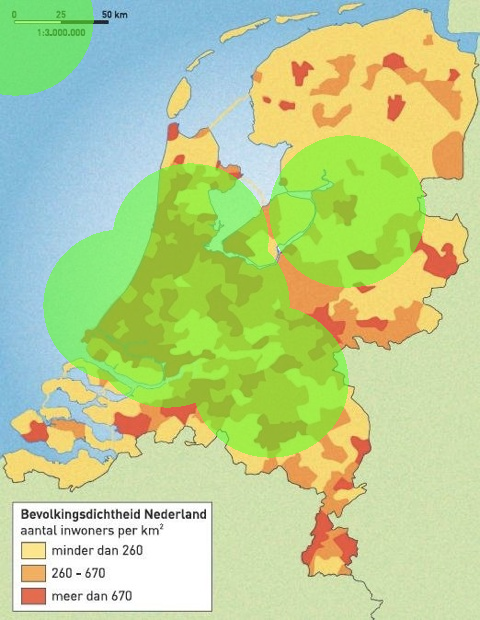 |
From these maps it can be concluded that Zwolle is the least busiest traffic city. For the busiest cities it is a little bit harder to point out the busiest city but it looks like Rotterdam is the busiest when morning and evening rush hour are both taken into consideration. From Rotterdam a circle of approximately 48 can be drawn and from that a location can be chosen where the parcel delivery truck has to deliver. From the traffic rush hour maps it seems that in the direction of Utrecht the most traffic jams takes place. Selecting a location in that direction will lead to the extreme where the delivery truck needs the most time. Before proceeding the analysis, a few important notices should be made. The first notice is that the delivery centers are placed very concentrated in area's where a lot of traffic jams take place. This is a very strategically way to deal with the demands in very population dense area's, see Figure 8.1.3. A second notice is that Bol.com and PostNL will not give information about the division of parcel delivery's per distribution center so an educated guess should be made determining which distribution center delivers where. The third notice is that because the distribution centers are placed in the strategic way it is done now, analysing an extreme where the truck has to delivery a package exactly 48 km in the direction of a high potential traffic jam is not possible. The reason for this is that the location from a distribution centre can be done by an other distribution centre. So choosing Rotterdam as leaving point for a delivery in the direction of the Randstad will probably will not be the best choice for analysation. Hence another reasoning for a different city should be made. And a fourth notice is that Google maps doesn't include the average of traffic jams but instead takes the current traffic jam situation. Therefore two options can be taken; one is just taking "snapshot" of the travel distance Google maps gives or two, take a constant delay time that is incorporated in the travel time to a location. This delay time can be modelled by setting the average time over the whole travel distance to a constant. This time constant can be approximated by taking in account the average speed a truck drives in cities, suburbs, the country, village streets and the highways. It can be stated that on the types: city, suburbs, country and village streets the average speed a truck drives is 50 km/h which keeps in mind that these types are built-up area. For the highways the maximum speed of 130 km/h can be used but during traffic jams can come down to 50km/h.[27] It depends highly on the distance on what the average speed should be since if the road contains mostly high ways the average would be higher than a road that goes through the city most of the time. The best choice for getting a result where the an extreme can be derived is when the distribution center in Nieuwegein delivers a parcel to a location near Almere. The reason for this is as follow: If busiest city Rotterdam was chosen and the truck needed to deliver in Utrecht it will not give a representational travel time since the delivery also could have been made by approximately 4 other distribution centers; Amsterdam, Den Haag, Nieuwegein and even Den Bosch. Its seems assumable that a parcel delivery suffers the most from traffic jams if the delivery location is in the north east direction with respect to Amsterdam, Den Haag, Rotterdam and nieuwegein together. The reason for north east is because towards the south the traffic jams are less long and concentrated or it is unclear which distribution center should do the delivery. Therefore it seems reasonable to disregard Rotterdam and Den haag as potential example for a worst case delivery scenario and thus Amsterdam and Nieuwegein Remain.
In Figure 8.1.4 and 8.1.5 circles are drawn that are exactly 48 km To select a delivery location that is exactly 48km crow flies is hard so we approximate by selecting a street that is near the edge of the 48 km circle. From Figure 8.1.5 it seems more reasonable that PostNL chooses Nieuwegein as distribution center that needs to deliver at Almere since the road seems more as the crow flies and Amsterdam is at its own a very busy city where the traffic is horrible so if the distribution centre of Amsterdam needs to deliver to a location near Almere it will probably be very ineffective. The delivery coming from Zwolle is directed to a street in the south of the city to come close to the 48km radius but letting the delivery. The choice for Hengelo is semi random. It didn’t really matter what city but to delegate the fare corner of the Netherlands a residential street in Hengelo was chosen.
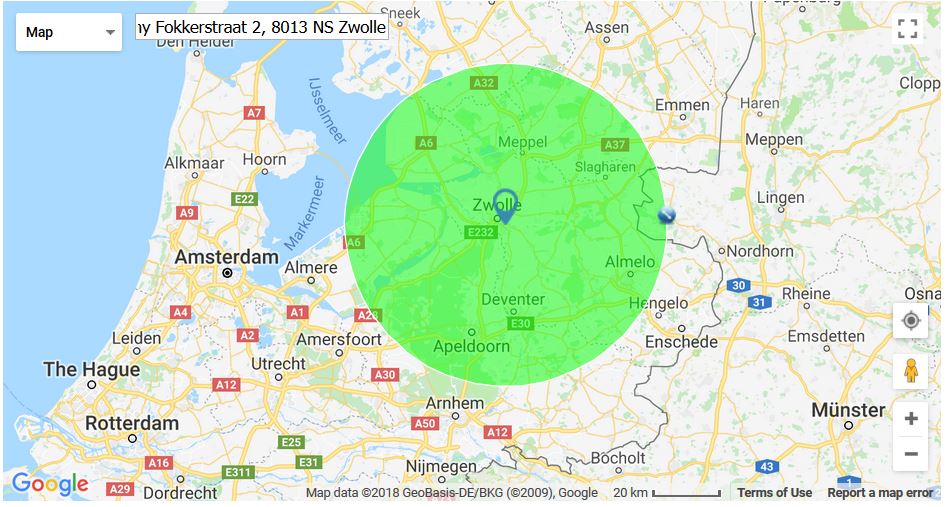
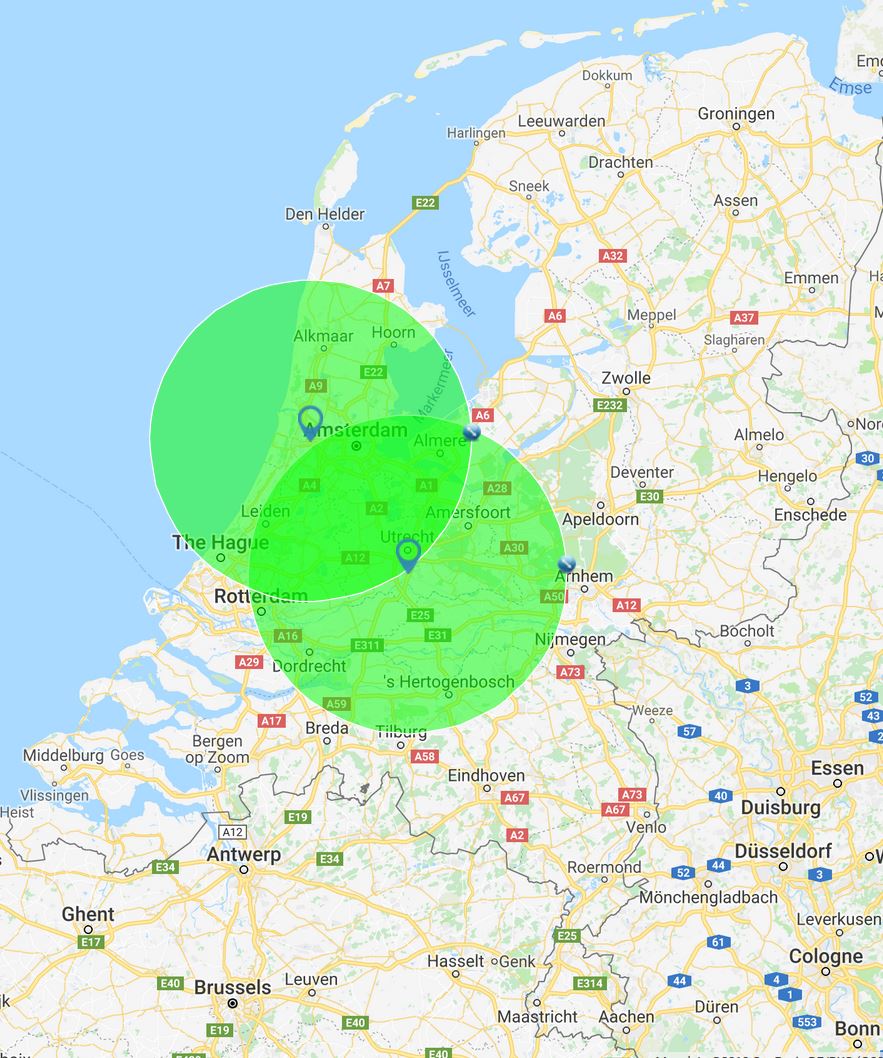 |
Figure 8.1.7 and 8.1.8 show the disadvantage of letting the truck leave from Amsterdam where not only the road is meandering but it also have to go through the busy streets of Amsterdam, And it is also approximately 10km longer in terms of the travel distance but also 1 km longer in a straight line. So in that case it can be concluded that the extreme we chose to compare is suitable.
The pictures are taken during non rush hours so to incorporate the traffic jams the average is taken of the travel time calculated by Google Maps and the travel time if the whole road was driven with a speed of 50 km/h. With that the following data is received.
| Truck from Zwolle to Hengelo | Truck from Nieuwegein to Almere | Truck from Amsterdam to Almere | |
|---|---|---|---|
| Travel time in minutes when
traffic jam is accounted for |
71 | 50 | 74 |
| Travel time in minutes calculated
by Google Maps |
57 | 37 | 45 |
Conclusions and discussion from the quick analysis
For the calculated travel time it seems that the method where the traffic jam is accounted for by setting the average speed to 50 km/h this is more suitable for rural areas then for high populated cities but it is still quite off. A difference of 10 to 20 minutes is observed between the calculated traffic time by Google and the travel time by setting the average speed to 50 km/h. This goes against the expectations. From this we can conclude that the average speed a truck drives is wrongly approximated. It should be said that since the Google maps snapshots were taken during non-rush hours it a time difference was expected between the calculated travel time and the travel time where traffic jams would be accounted for. So in that sense an average speed of 50 during rush hours is not farfetched, but assuming that delivery trucks only deliver at rush hours is. So to make a recommendation for the average travel speed, looking at the travel times could help to give a better average travel speed by taking the max average speed calculated by google and average it with 50 km/h. The max average speed calculated by Google in the three scenarios was 85km/h so a good approximation for the average speed will be 68 km/h. It was also expected that the travel time in rural areas would be much faster but it seems in the same range as for high populated areas. The reason for this is unknown. It could be that the snapshots were taken on unfortunate moments or that the infrastructure is much better in the high populated areas. Nevertheless it is still advised to take a higher travel time into account in highly populated areas since in practise these areas are inherent with traffic jams and the pictures showing the traffic morning and evening rush hour back this up as well. Hence it is advised to account an average speed of 68 km/h for highly populated areas and 85 km/h for rural areas.
From this quick analysis some new insight have been obtained that can help making a decision matrix for the recommendation. From the rush hour and the population maps the statement can be drawn that a high population means a lot of traffic and a lot of traffic will omit CO2 a lot. In conclusion, the aspects: traffic fluency and pollution are dependent on the population density
A discussion point of the analysis is the following: Delivering just 1 parcel is not representable since it is possible for one delivery van to deliver 80 parcels a day [29]. But this analysis is mainly done to get some insight of distribution centres, distribution of delivery trucks and dependency on traffic and population. This information can then later be used for the decision matrix or smaller aspects of other drone delivery systems like the truck done solution where only the travel time of the truck by highway is of much importance. More insight of the time used by a delivery truck in the city is elaborated in the Beehive method.
CO2 Pollution
PostNL is aware that a logistic sector contributes greatly to the negative impact to the environment and that intervention to that contribution benefits the company itself as well since every company has to pay CO2 taxes. PostNL is already using the population density of the Netherlands in its advantage by putting bicycle delivery in operation but this might affect other aspects of the delivery process. Think about delivery speed and capacity of the deliverer. PostNL has since now, its primary focus already on making small delivery trucks more sustainable and they have monitored this by taking the CO2 efficiency index as its environmental performance indicator. The most CO2 efficiency index improvements to the small delivery trucks were made by making the truck run on biogas. Which is in theory a good step but first of all should not be considered as the all remedy solution since bio gas has its downsides [30]. The biggest problem that arises with biomass is the land that it uses, which will conflict the demand for food. Secondly most claims about how biomass is green is very questionable since a large percentage of the biomass the Netherlands use, is shipped out of the United States. In that case a lot of fossil fuel is used to create the biomass from forests and a lot is used to ship it [31].
Parcel delivery costs
Enterprise
In the last year the total operating expenses increased by €135.000.000,- in comparison to 2016, see Figure 8.4.1.1. The total operation expenses consists of imprimis the cost of materials which are things like carton boxes and digital signature devices; secondly the work contracted out and other external expenses which are money that is spend on Acquisitions, thirdly the salaries, pensions and social security contributions, this speaks for itself; fourthly the Depreciation, amortisation and impairments which can be seen as the value of the company and the fifth thing is other operating expenses can be things like start-up problems , incidentals and other things which can correlate to the volume and revenue within the segment.
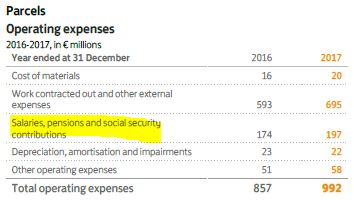
For our problem statement somewhat all aspects can be effected by the use of drones. The cost of materials will probably rise due to the drone costs. The work contracted out and other external expenses will possibly change since the need for transport services and transport related services will differ. If vehicle maintenance is taken into account. Vehicle maintenance will be less since the delivery trucks will not travel as much anymore and therefore the vehicle will wear down slower. External expenses like distribution, assembly and online platform companies will probably stay somewhat the same. The need for companies with drone knowledge will be rise, hence in that sense the external expenses will differ and probably rise but this will be compensated in other segments The salaries, pensions and social security contributions will definitely lower with the implementation of drones since the whole use of an employee is taken out in the delivery process.

In Figure 8.4.1.2 the labour force of PostNL is shown, it is visible that there is a rise that occurred for the headcount in the parcel delivery department. This is probably due to the rising command in parcel deliveries shown earlier in the stakeholder chapter. If PostNL is implementing the drone delivery methods that are treated in this wiki, it will be the first logistic company that uses drones, making PostNL technological advanced in comparison to others. This will be an advantage in terms of depreciation, making PostNL more valuable in the logistic market.
User
The price for the user is important. If drone delivery systems work technically and legally but the delivery itself is more expensive then truck delivery systems than chances of failing are high. The following graph is an approximation of what drone delivery is expected to cost, it also shows the current costs in the United states. Note that this approximation is done for a Beehive kind of system and the prices are in dollars.
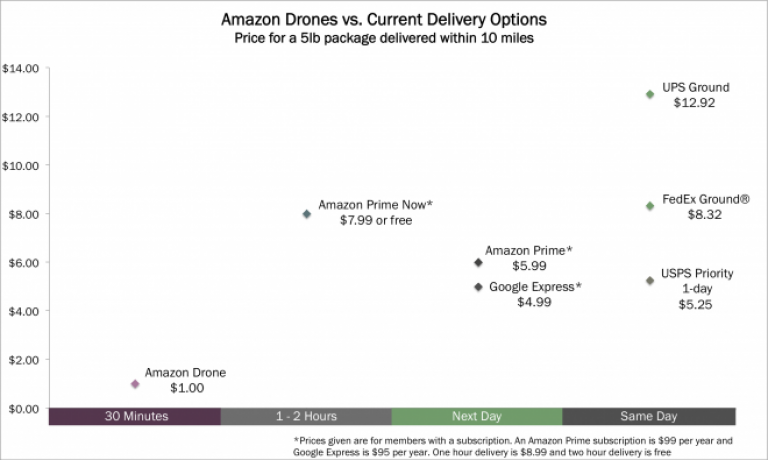
From Figure 8.4.2.1 it can be concluded that a drone delivery is much cheaper and thus it can be promised to both the enterprise and the user that a Drone delivery system will pay of.
Survey
It is very important to include the opinions of the users with regard to the delivery system since these are the stakeholders who make use of the service. To include their interests, a survey was conducted. The purpose of this survey was to provide a clear view of their perspective on the current delivery method and a delivery method where drones are involved.
Research group
The survey is aimed at the Dutch population aged 12 and older. According to the CBS, 12 years is the age from where packets are ordered online. As general personal information asked about gender and age.
Measuring instruments and procedure=
A questionnaire of 13 questions has been developed via the website www.enquetesmaken.com (see this link: https://www.enquetesmaken.com/s/721f1a5 ). The questions relates to different ones sub-areas, namely: personal details, social environment, online ordering, the current delivery method and the implementation of drones in the delivery system. The questions about the sub area current delivery method are not answered by people who indicated never to order packages online. The question about why people do not use the service to order online packages is not answered by the people who use it. The online surveys were sent in early March via social media and Whatsapp.
Analysis
The survey forms are digitally processed with the website www.enquetesmaken.com. The research focuses on the total results for the Netherlands. A distinction has been made between gender and age. The results showed that the vast majority of respondents belongs to the same age group. This has to be taken into account while drawing a conclusion. The rough age data are classified according to the following age groups:
- 12 to 19 years;
- 20 to 29 years;
- 30 to 39 years;
- 40 to 49 years;
- 50 to 59 years;
- 60 years and older
Results
The survey was completed by 64 respondents, of which 55% male and 45% female. 17% of the respondents are in the age category 12 to 19 years, 72% in the age range 20 to 29 year, 2% in the age group 30 to 39 years, 2% in the age group 40 to 49 years, 5% in the age group 50 to 59 years and 3% in the age group 60 years and older. In the extensive result description below all results are mentioned. All results are visible via the following link: https://www.enquetesmaken.com/?url=results&c=721f1a5-da3c741&uid=1206625&status=1&language=1&hl=0&datum_einschraenken=0&dateRange=&fid=12132120&ftid=28719153&ftid_wert=0#E12132120.
Social environment
Education
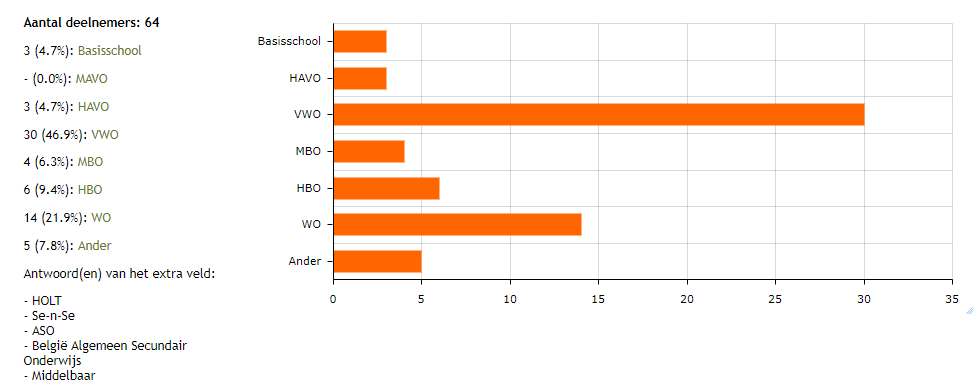 |
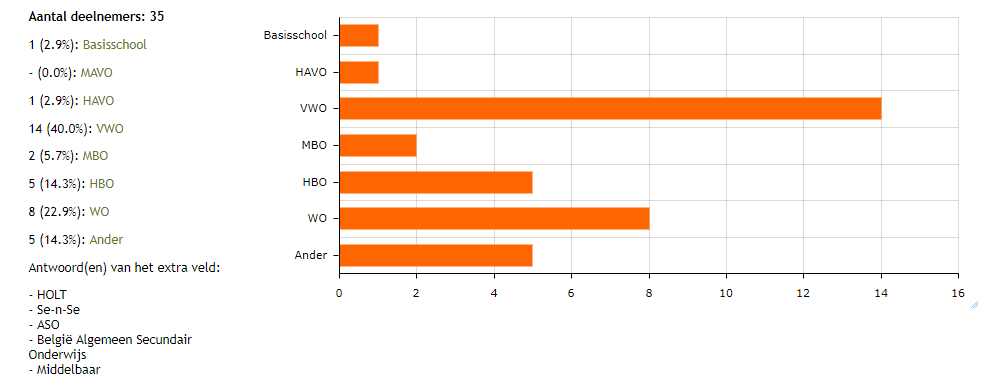 |
 |
The highest level of education has been asked. Results (figure 9.1) have shown that over 46 percent of the group stated to have VWO and 0 percent stated to have MAVO as their highest obtained degree. Also the results are given by gender (figure 9.2 for men and 9.3 for women). For men it is remarkable that there are filled out five other forms of education. The explanation for this is that these are educations in Belgium.
Living environment
There has been asked in what kind of environment the respondent lives. See figure 9.4 for the results. Just over the half (54.69%) of the respondents stated to live in the city. Furthermore one respondent stated to live under a bridge. Because the truth of this is being seriously questioned, the other answers of this respondent have also been examined. Because these are also not reliable this must be taken into account when drawing conclusions. This respondent stated to be a woman of 60 years and older. In figure 9.4 and 9.5 the results are given by gender.
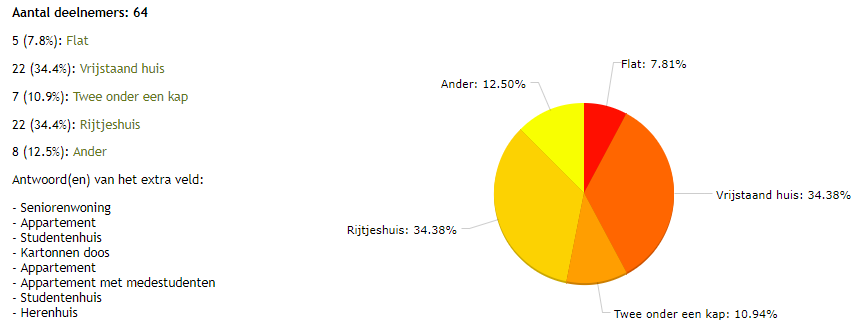 |
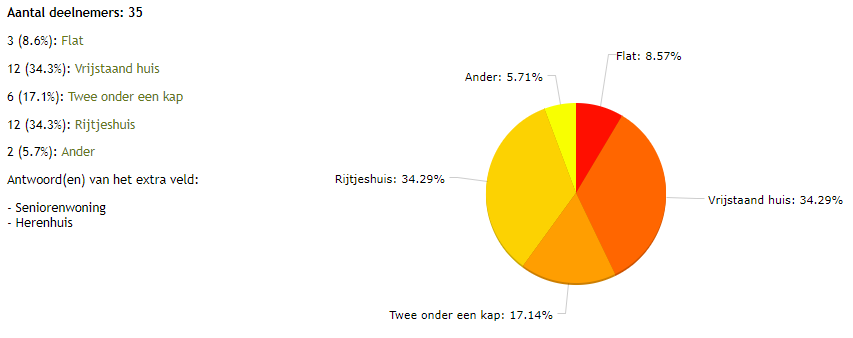 |
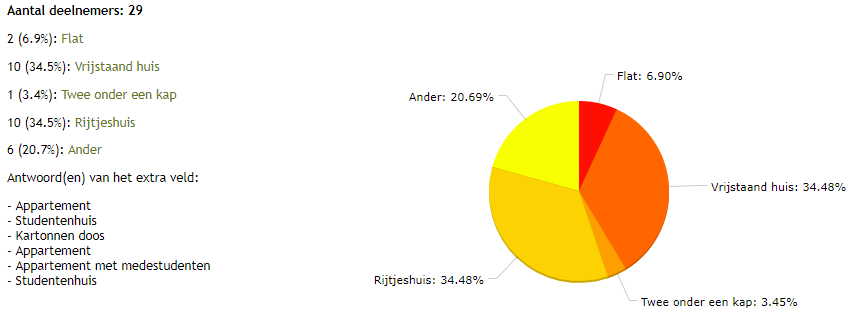 |
There also has been asked in what type of house the respondent lives. From figure 9.7 it can be concluded that many answers have been filled in in the additional field. The respondent whose answers are questioned is again confirmed here with the answer 'cardboard box'. Furthermore, the same answers have been entered several times. This brings us to 8 different types of houses: flat, detached house, semi-detached, terraced house, retirement home, apartment, student house, mansion. In figure 9.4 and 9.5 the results are given by gender.
Online ordering
There has been asked if the respondent makes use of the availability to order packages online.
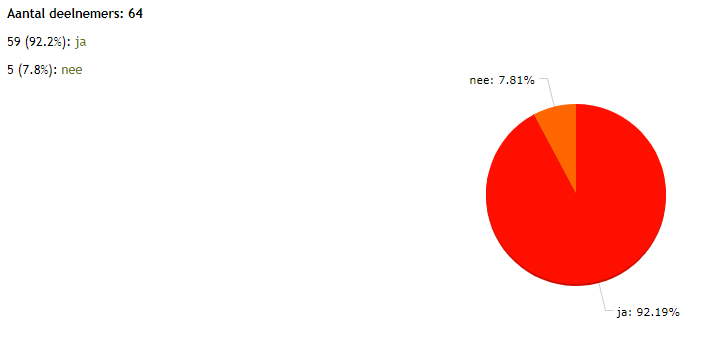
From the above illustration it can be concluded that the vast majority (92.19%) make use of this opportunity. Of the 35 male respondents, 94.3% (33 respondents) makes use of this service. Of the 29 female respondents, 89.7% (26 respondents) makes use of this service.
There has been asked about the reasons of the respondents to not order packages online (respondents whose answer was yes in the previous question, were requested to answer ‘inapplicable’ to this question).
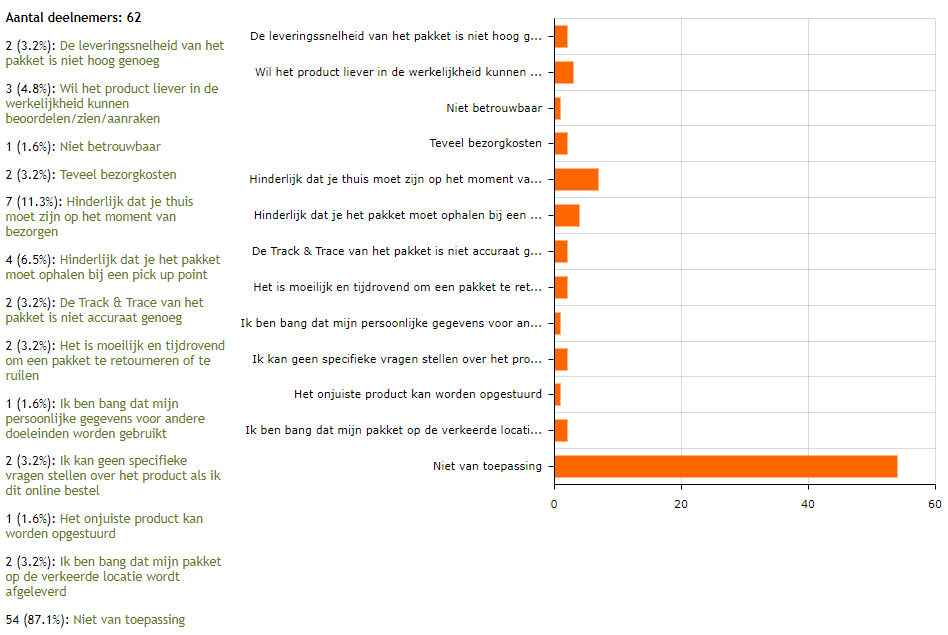 |
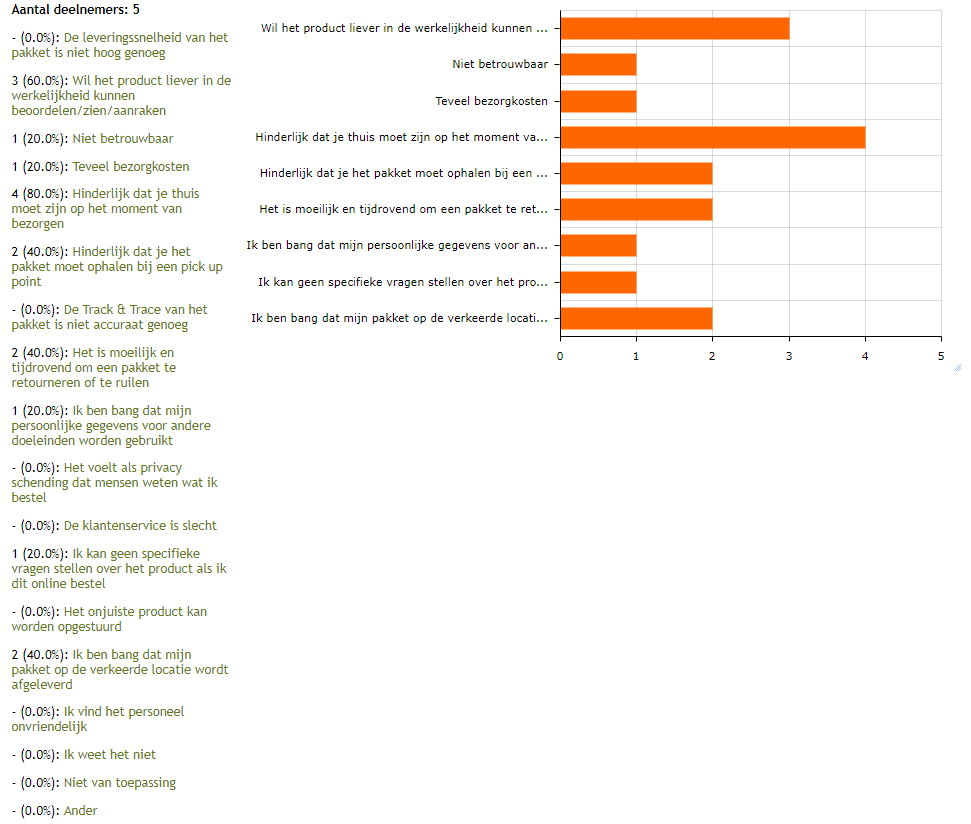 |
It is striking that only 62 respondents answered this question (figure 9.11). This means that there are quitted two respondents with the survey so far. The respondents were able to give multiple answers to this question. When filtering on the answers of the respondents who indicated that they did not make use of the service in the previous question, the figure 9.12 is displayed. This illustration does not match the preceding illustration. This means that respondents who do make use of the online ordering service have also answered this question. Because they were not supposed to answer this question, their answers are not taken into consideration in the conclusion and the above illustration is assumed. From this it can be concluded that the respondents mainly do not order online for two reasons: they would rather be able to asses/see/touch the product in reality (60%) and they think it is annoying that you have to be at home at time of delivery (80%).
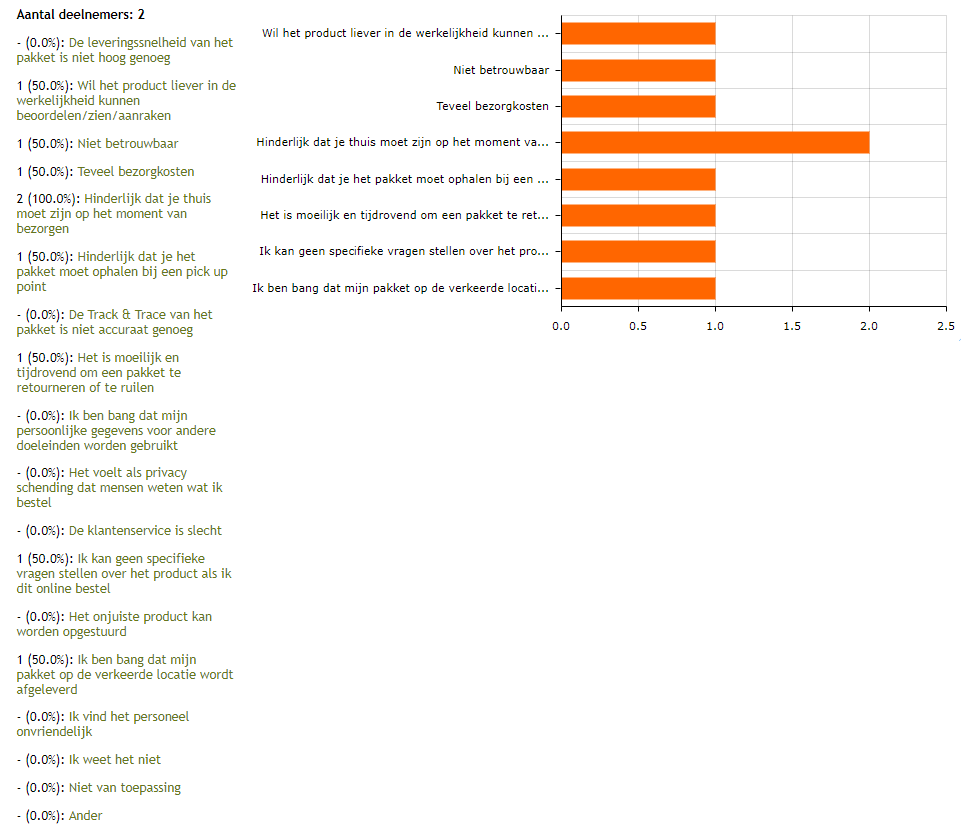 |
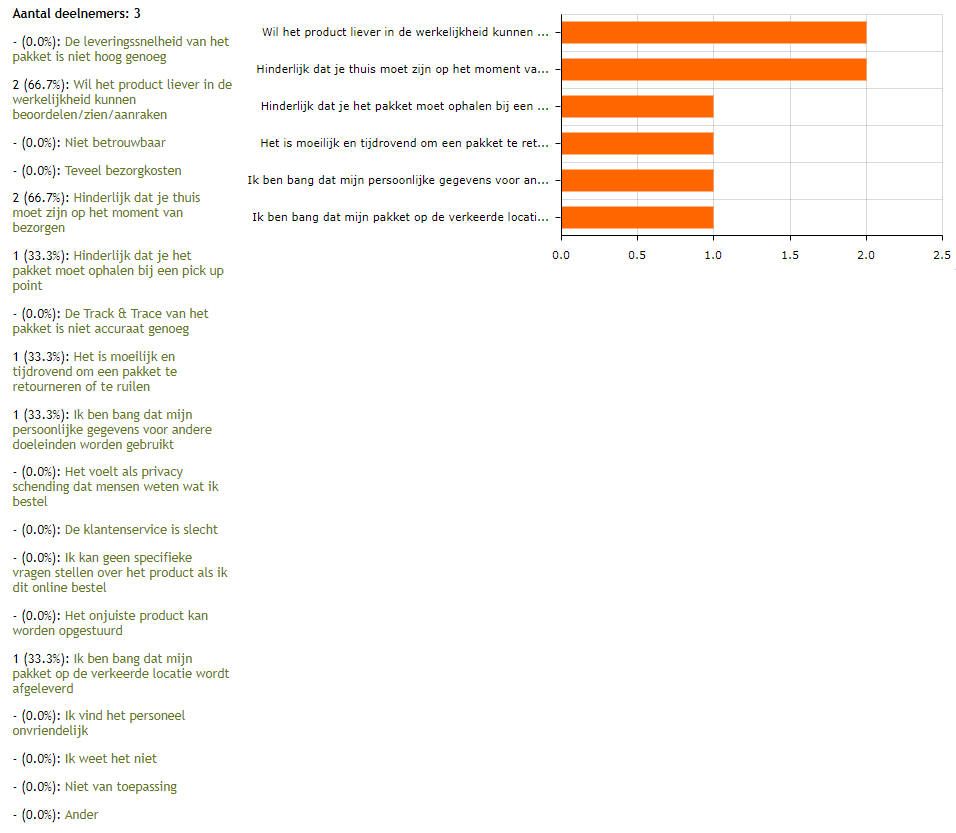 |
Above (figure 9.13 and 9.14) the results are given by gender. Both men indicated to be irritated by the fact that you have to be at home at time of delivery. The main reasons for the women are the facts that they want to be able to asses/see/touch the product in reality (66.7%) and they think it is annoying that you have to be at home at time of delivery (66.7%).
There has been asked on which day the respondent usually orders a package online. It is striking that this question has again 64 respondents (figure 9.15). It seems like the two respondents who did not answer the previous question have answered this question again. This question is considered to be answered only by the respondents who have indicated that the make use of the online order service. However, when the answers of the respondents who do not use this service are filtered, the figure 9.16 is displayed. 60 percent followed the instructions from the survey and answered ‘not applicable’ , but the other two respondents did answer this question. These answers are not taken into consideration; only the answers of the respondents who stated to make use of the online order service are taken into account (these are 59 respondents). This gives the following results: working day (45 respondents: 76.27%) , Saturday (5 respondents: 8.48%, Sunday (3 respondents: 5.08%), not applicable (9 respondents: 15.25%). Here it is striking that there are 6 respondents who make use of the service and do answer ‘not applicable’ to this question. When a distinction has been made between gender, there were 26 (78.8%) male respondents who order a package online on a working day, 3 (9.1%) respondents on a Saturday, 0 respondents on a Sunday and 4 (12.1%) respondents answered ‘not applicable’. When looking at the female respondents, there were 19 (73.1%) respondents who order their packages on a working day, 2 (7.7%) respondents on a Saturday, 3 (11.5%) respondents on a Sunday and 2 (7.7%) respondents answered ‘not applicable’.
There was asked on which part of the day the respondents mainly order a package online (figure 9.17). The fact that only respondents who make use of the online order service are deemed to answer the question also applies here. When the results are filtered on the respondents who do not make use of the service, figure 9.18 is given. This illustration shows that there were three respondents who did not follow the instructions of the survey. These answers are therefore not taken into account in the conclusion. This gives the following results: morning (2 respondents: 3.39%), afternoon (19 respondents: 32.20%), evening (36 respondents: 61.02%), night (0 respondents), not applicable (2 respondents: 3.39%). Here the same holds as in the previous question; it is striking that there are 2 respondents who make use of the service and do answer ‘not applicable’ to this question. When a distinction between gender is made, the following results are given (only from the respondents who stated to make use of the online order service): there were 2 (6.1%) male respondents who mainly order their packages in the morning, 9 (27.3%) male respondents in the afternoon, 21 (63.6%) male respondents in the evening, 0 male respondents at night and 1 (3.0%) male respondent answered ‘not applicable’. The following results apply to female respondents: 0 female respondents order their packages in the morning, 10 (38.5%) in the afternoon, 15 (57.7%) in the evening, 0 at night and 1 (3.8%) answered ‘not applicable’.
Current delivery method
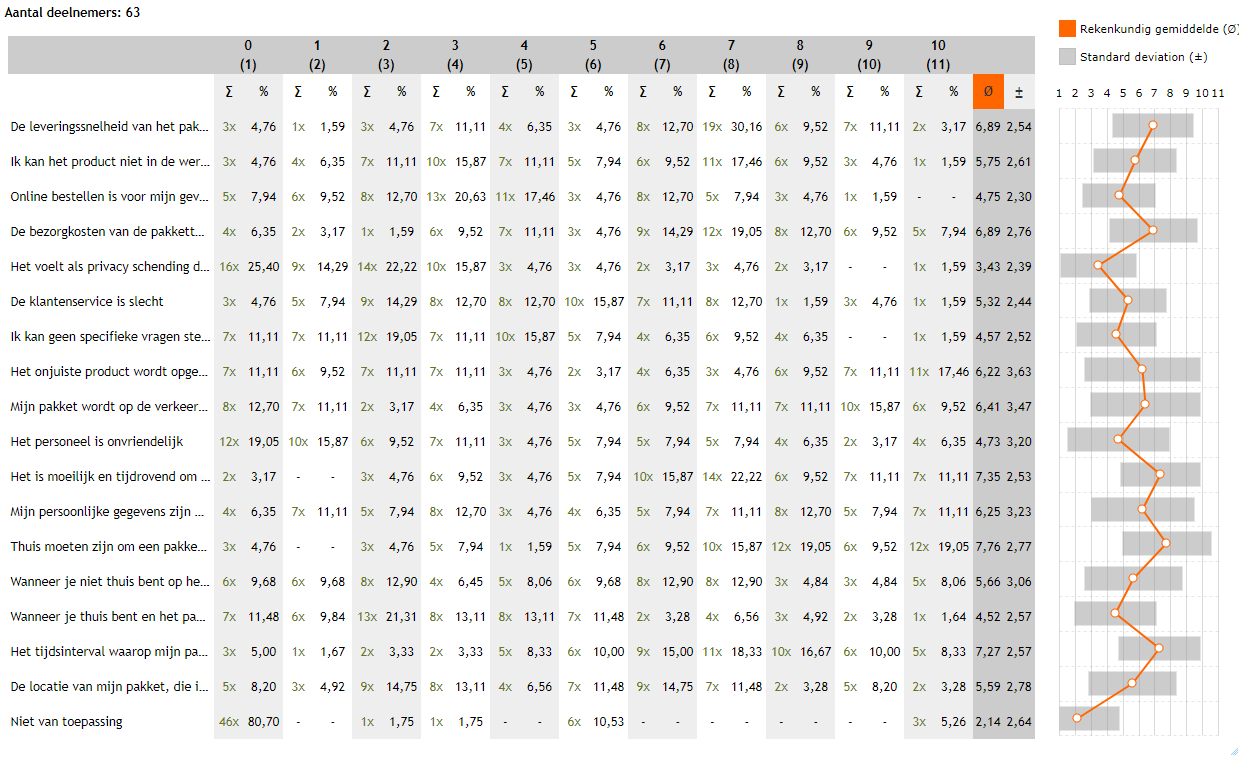 |
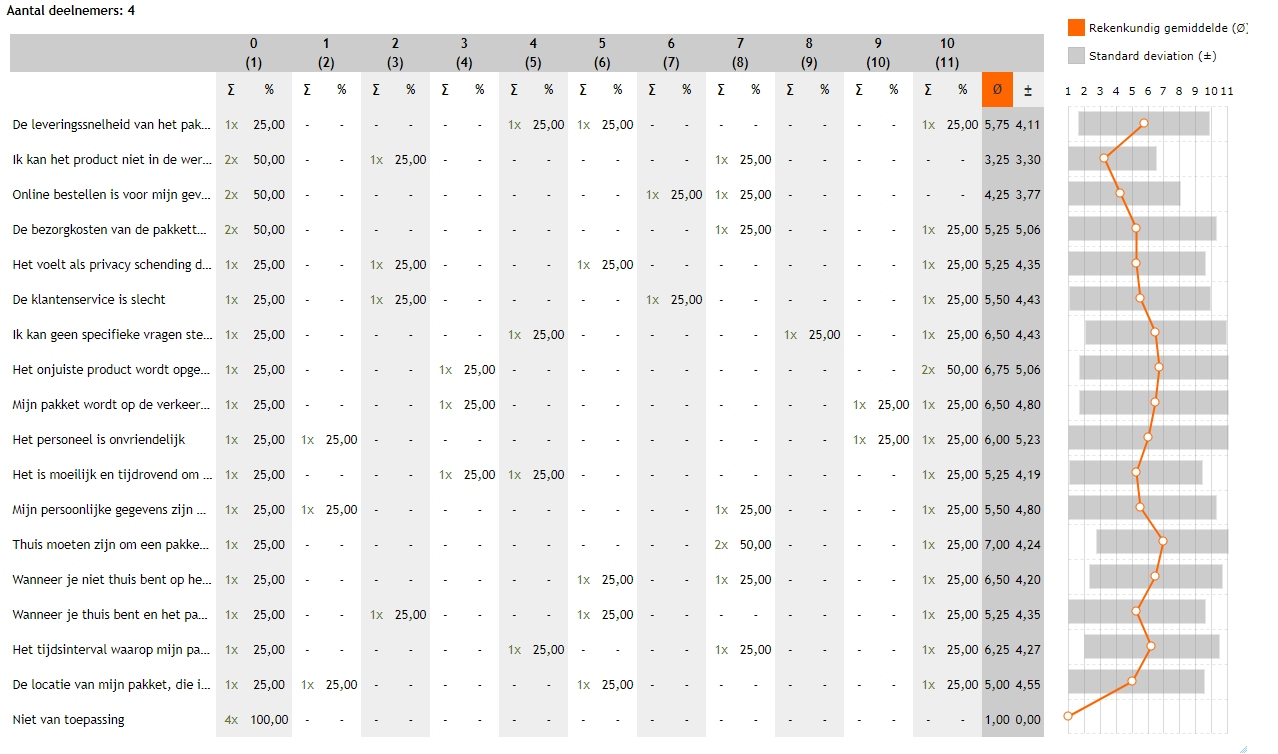 |
The respondents were asked to indicate their irritation on a scale of 0 to 10 in a number of cases. Here the amount of respondents is remarkable again (figure 9.19). There is one respondent who did not give an answer to this question. When the answers of the respondents who do not make use of the online order service are filtered, figure 9.20 is given. From this figure it can be inferred that there again were respondents who answered this questions while they were not supposed to (because they do not make use of the online order service). These answers are not taken into consideration.
Implementation of drones in the delivery system
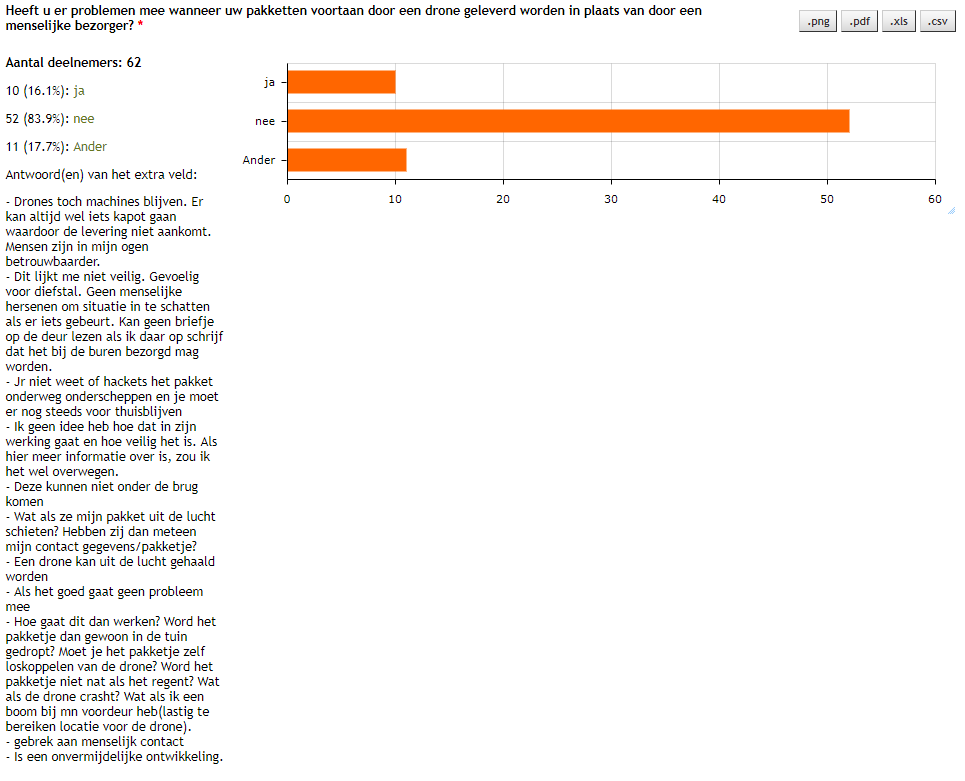 |
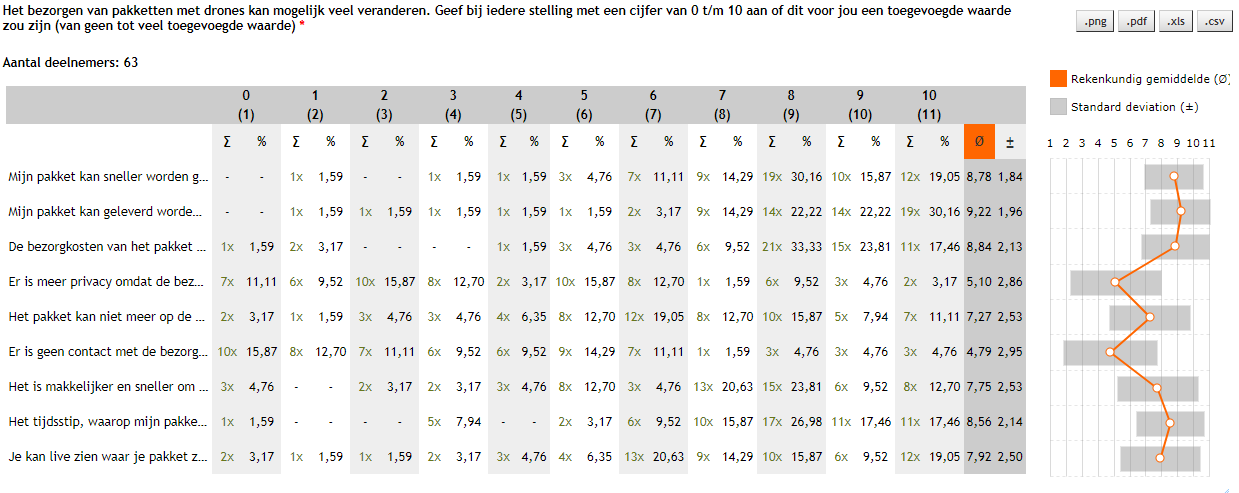 |
There was asked whether the respondents have a problem with the fact when their packages are delivered by a drone henceforth instead of a human mail deliverer. Again it is striking that 62 respondents gave an answer to this question (figure 9.21). The vast majority (83.9%) indicates that they have no problems with this change. Furthermore it is remarkable that there are many comments to this question. These comments come almost (81.82%) of all the respondents who make use of the online order service. From the comments it can be concluded that there are still a lot of questions about this situation and that some respondents have doubts about safety.
Delivering packages with drones can potentially change a lot. The respondents were asked to indicate with a number from 0 to 10 for each statement whether this would be an added value for them.
From figure 9.22 it can be seen that the respondents consider the following three cases as the most valuable added value: when their package can be delivered faster, that their package can be delivered at the location of the respondent two hours after ordering and that the delivery costs of the package are lower. Furthermore they see it as the least added value that there is no contact with the human mail deliverer.
There is asked whether the respondents would pay extra money for a human delivery person when the delivery of packages with drones becomes the standard delivery method.
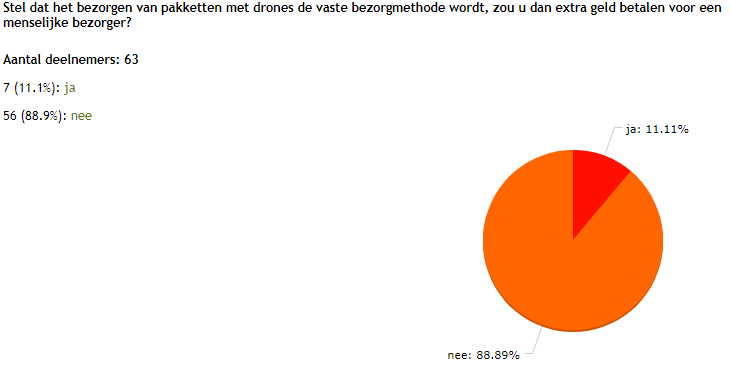
It is striking that of the 10 respondents who indicated that they had troubles when their packages were delivered by drones, 9 would pay no extra money for a human mail deliverer.
The beehive
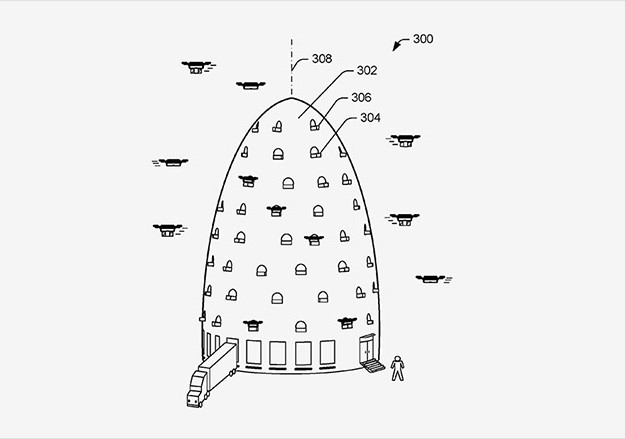
One of the first methods that will be investigated is the adaption of distribution centres and how it can be used for drone parcel delivery. To be able to deploy delivery drones from distribution centres and warehouses, one must come with a smart design so drone deployment and truck deliveries don’t interfere. Today’s distribution centres and warehouses are typically large-volume single-floor buildings, located at the outer parts of the mayor cities [32]. But since drones are not restricted to the ground floor, it could efficiently fly from higher levels. Combining this possibility with the distribution centres results in the beehive.
The beehive is a distribution centre for the delivery drones to take off and land. [32] The beehive facilities would be mainly build to create space vertically so the footprint of the building is small enough to fit close-by or even within the cities. Building the beehives closer to the cities results into possibilities of items that may be delivered more quickly to the growing population of people that live in the cities, as well as the growing number of people who work in the cities [32].
While the ground floor can be used as is done nowadays, docking and deploying delivery trucks, the higher levels can be used to deploy the drones. In this way the drones are already at a higher level in the sky and therefor save time and energy for the since it doesn’t need to ascend much, making it possible to fly further and faster. And by taking off from the higher level, the danger to interfere with pedestrians is minimized.[33]
Inside the beehive, automatic robots move around goods and conduct maintenance on the drones. And since the facilities are so high, the delivery drones can easily fly inside as well. Another advantage of the multi-level facility is that the drone activities largely take place at the upper levels, therefor minimizing the noise for surrounding areas [34].
The beehives could facilitate a large volume of drones that continuously fly in and out to deliver the packages and recharge at site. Those drones could fulfil thousands of orders a day, depending on the number of drones being used. And to be able to control and oversee the flight operations of the drones the beehive could facilitate a command centre, comparable with a flight control tower at the airport. With the use of this command centre no drone delivery flies unseen or unmanned while the drones itself is autonomous.
Possibilities and limitations of the Beehive
As explained above, the beehive adapted distribution centre, placed closed or even within a city. And to understand its possibilities, one must first look back at the drones. Taking in mind that, as explained in the assumptions, the average speed of a delivery drone is 60 km/h, and the maximum range a drone fly and still be able to return is 16 km, the beehive brings the possibility to deliver a packages within 30 minutes after it is ordered. And not only can it deliver in such a high speed, it can target the buyer’s exact location and send the drone over there. And placing such a beehive close or even within a city, bring along the possibility to deliver to every customer within the city in less than 30 minutes.
But keeping in mind that the delivery range for a beehive is 16 km, one beehive can cover up a surface of (π * r2=) 803.84 km2. To cover up the entire Netherlands its surface (42.000 km2), it would take a demand of over 52 distribution centres. Comparing this to the current number of distribution centres of PostNL, which is 6 centres through the entire Netherlands [35], a proposed increase of 875% on distribution centres is necessary. This number of distribution centres would theocratically be the only way to deliver packages with beehives within 30 min. And for every delivery one drone is occupied for a maximum of 90 minutes, taking into account that recharging takes half an hour.
A possible solution for this would be to install wireless charging pads throughout the Netherlands, for example on lampposts, as mentioned before and in the assumptions. This would increase the distance one drone can cover with 200% since the first time the drone can fly straight for 32 km, before fully charging and then cover another 16km so it can still return to the charging pad. This would mean that one distribution centre can cover up a radius of 48 km and therefor a surface of 7234 km2. Comparing this with the surface of the Netherlands, about 6 distribution centres could cover up the entire Netherlands, if ideally distributed over the country. In this case a drone maximally takes about 75 minutes for one delivery and another 75 minutes to return and another 30 min to recharge again, resulting in a total time of 180 minutes. It is a possibility to change the battery of the drone once it is back to the beehive, which can save up the last 30 min with just one action.
However, the Netherlands is not a perfect shape so the surfaces will not align with 6 beehives. Furthermore the distribution centres are not spread out optimally over the Netherlands. Currently the longest distance between a distribution centre and a city in the far north is about 140 km. A clear overview of the centres of PostNL throughout the Netherlands can be seen in Figure 10.2 above. Figure 10.3 aside of it shows a favourable distribution of the beehives with respect to covering the most area. Currently, the centre of the Netherlands can be reached quite well with sometimes more than one distribution centre in range. The outer parts of the Netherlands are actually out of reach, even with the solution of wireless charging pads. Even when applying a second charge moment in the flight, extending the range with another 32 km, not every part of the Netherlands can be reached. And due to this extra charge the total flying time increased with 90 minutes and the delivery time is extended to 135 minutes, causing one drone to be occupied for about 5 hours before be ready for the next delivery and thereby completely losing the point of the beehive.
It can be concluded that spreading out 6 beehives throughout the Netherlands is not going to be enough to deliver packages with drones throughout the entire Netherlands within a profitable time. A better implementation for the placements of the beehives would be to look into the population density. To see if PostNL has its distribution centres on favourable places, its warehouses are compared to the population density in the Netherlands. And around these distribution centres, the radius of the drone’s flying distance is drawn, as seen the Figure 10.4 below. Figure 10.5 aside of it shows a favourable distribution of the beehives throughout with respect to the population density. A few notions can be made when comparing the distribution of distribution centres of PostNL compared to the distribution with respect to population density:
- Currently the distribution centres seem to mainly cover the most densely populated areas. Therefor leaving out a big part of the Netherlands.
- The map that respects the population density still doesn't cover the entire area of the Netherlands
- There shouldn't be a reason for PostNL not to place distribution centres in the northern part of the Netherlands existing of Friesland, Groningen and Drenthe.
With this analyses it can be concluded that the beehive is limited through its delivery range and can’t be used to deliver to the entire Netherlands. However, the possibilities it creates when placed close to a mayor city is very profitable. Therefor one must not see the beehive as a solution for the entire country, but as a solution or improvement for the mayor cities.
Implementation of the beehives

To analyse the advantages of the beehive compared to the current method, it has to be analysed in a real situation. For this analysis it is chosen to compare a normal distribution centre on the outskirts of a big city to a beehive. And what better city to analyse than Amsterdam. And even though it would be possible to place a beehive on the most ideal location within the city itself, it is chosen to place the beehive on the same location as the current distribution centre to get the most reliable results to compare. build almost in the city itself.
First of all, Amsterdam currently has a delivery of over 40.000 packages a day. And with the current grow of online purchases it is expected to grow over 100.000 packages a day within 10 years. [36] But according to Amsterdam, the dense populated city can’t facilitate that amount of packages with their already overcrowded traffic. Currently, almost all packages are delivered with a van and a small amount is delivered with motorbikes or bicycles.
So let’s compare the possibilities with a normal distribution centre and the beehive. PostNL has its current distribution centre placed at Australiëhavenweg 100, Amsterdam. This location is indicated in Figure 10.6 as starting point of the route, encircled in black.
To start off, one package has to be delivered directly from the distribution centre to Agnietenkapel, located at Oudezijds Voorburgwal 231, close in the city itself. First of all, the package could be delivered with a van, having two options. First, driving through the city and taking a route of 11.2 km that takes up to 36 minutes or drive around the city taking a route of 20.3 km that takes up to 26 minutes. When delivered with motorbike it takes the route of 11.1 km and about 31 minutes. When delivered with bicycle it takes the route of 10.0 km that takes up to 35 minutes. But when delivering with a drone, it could fly in a straight line, taking a route of 7.2 km. Taken into account that it flies with an average speed of 60 km/h, it takes less than 8 minutes to deliver by drone.

But to get a proper comparison between the different transport systems more locations have to be added. There is chosen for a total of 6 locations, randomly chosen among Amsterdam. In the comparison the van is shown as a car, there is the bike, the bicycle and the drone. All carriers can take 6 packages with them, except for the drone. This results in the fact that the drone has to fly back to the distribution centre after every delivery to pick-up a new package. As mention in the assumptions, the action of retrieving a package out of the distribution centre takes about 90 seconds, which have been added in the calculation- each time. Also since the drone is not flying on ground level it has to ascend and land every time, each action taking 30 seconds into account. With this extra restrictions the model is believed to be more reliable and less in favour of the drone delivery.
To calculate the time necessary to deliver packages in Amsterdam, Google Maps is used. The final route for the car is shown in the figure aside, highlighted in blue. The final route for the bicycle is shown in red. The bike mostly rides on the bicycle lanes but sometimes has to drive on the main road, taking more time and some more distance. The drone flies into a straight line each time, with an average flying speed of 60 km/h. The table shows the distance (km) and time (min) covered up until reaching that location. In the end the total covered distance and time are shown as well as the average speed. Take into account that no extra time is charged for the car, bike and bicycle to actually deliver the packages. And even without this extra event the drone is almost 50% faster than the van. And below the top four calculation an implantation of more drones is shown. As seen in the table the total time consumed when using three drones is only 21.5 minutes for 6 deliveries, not taking the last return flight into account. Compared with the truck, this is an improvement of over 500%. Compared to the bike it improves with 475% and with the bicycle 630%. To get a better understanding, the time-distance relations have been plotted in Figure 10.8 aside.

As stated before, currently the model is running from the distribution centre location of Amsterdam as it is currently located. However, with the implementation of the beehive, the distribution centre could be placed even more central in the city being able to deliver packages all over Amsterdam and surrounding within 30 minutes. And this implementation is not only available for Amsterdam but for all major cities. With the use of the beehive, every big city in the Netherlands will be able to order packages that can be delivered within 30 minutes on the exact location necessary. With the transformation of the current distribution centres into beehives almost all big cities fall within the 16 km range. And with only a couple of extra beehives all major cities will be able to order packages with a delivery time below the 30 minutes.
| Delivery times of the different delivery services in Amsterdam | ||||||||||||||||||||||||||||||||||||||||||||||||||||||||||||||||||||||||||||||||||||||||||||||||||||||||||||||||||||||||||||||||||||||||||||||||||||||||||||||||||||||||||||||||||||||||||||||||||||||||||||||||||||||||||||||||||||||||||||||||
|---|---|---|---|---|---|---|---|---|---|---|---|---|---|---|---|---|---|---|---|---|---|---|---|---|---|---|---|---|---|---|---|---|---|---|---|---|---|---|---|---|---|---|---|---|---|---|---|---|---|---|---|---|---|---|---|---|---|---|---|---|---|---|---|---|---|---|---|---|---|---|---|---|---|---|---|---|---|---|---|---|---|---|---|---|---|---|---|---|---|---|---|---|---|---|---|---|---|---|---|---|---|---|---|---|---|---|---|---|---|---|---|---|---|---|---|---|---|---|---|---|---|---|---|---|---|---|---|---|---|---|---|---|---|---|---|---|---|---|---|---|---|---|---|---|---|---|---|---|---|---|---|---|---|---|---|---|---|---|---|---|---|---|---|---|---|---|---|---|---|---|---|---|---|---|---|---|---|---|---|---|---|---|---|---|---|---|---|---|---|---|---|---|---|---|---|---|---|---|---|---|---|---|---|---|---|---|---|---|---|---|---|---|---|---|---|---|---|---|---|---|---|---|---|---|---|---|---|---|---|---|---|---|---|---|---|---|---|---|---|---|
|
Advantages and disadvantages of the beehive
Now that the main idea is of the beehive is clear and a comparison is made between the current methods and the method of the beehive, the advantages can be enlisted versus the disadvantages.
Advantages
Let’s look into the advantages at first. To implement the beehive, a distribution centre has to be transformed. The footprint will become smaller and the building will become a multi-level fulfilment centre. In this way it can be located closer or even within the major cities, since the space taken is much smaller. Another advantage is that the current methods doesn’t have to be changed completely, it is just altered. Drones are added for fast deliveries, but have to stay within range, while truck can still be deployed from the beehive to deliver outside this range. Due to the height of the beehive, the drones can fly away from a sufficient altitude preventing noise disruption and dangerous encountering with pedestrians on the ground floor. And since it has so much space on the higher levels, lots of drones can be stored that are either idle or charging.
Furthermore, the traffic jam within the city will decrease since less vans are necessary to deliver the packages. The packages can be delivered within 30 min in a 16 km radius of the beehive, any location necessary. This results in the fact that buyers don’t have to be home but can use GPS to uplink their current location so the drone can deliver at that specific location. The time profit made is between 300% and 600%, depending on the number of deliveries and the number of drones used. And keep in mind that a van would not depart to deliver one packages, while a drone flies straight away. Beside the fact that the deliveries a much quicker, they are also cheaper. A PostNL parcel delivery costs the user about €3.80 [37] and a PostNL deliverer costs about €8.57 [38]. A drone has a one-time investment cost and afterwards only makes costs with charging. Resulting in lower costs for the company and therefor a decrease in the price for the buyer which will probably be about €1 per parcel.
- Smaller footprint for distribution centre
- Closer to the city
- Less traffic jams
- Quick deliveries in overpopulated areas
- A time profit between 300 – 600% on deliveries
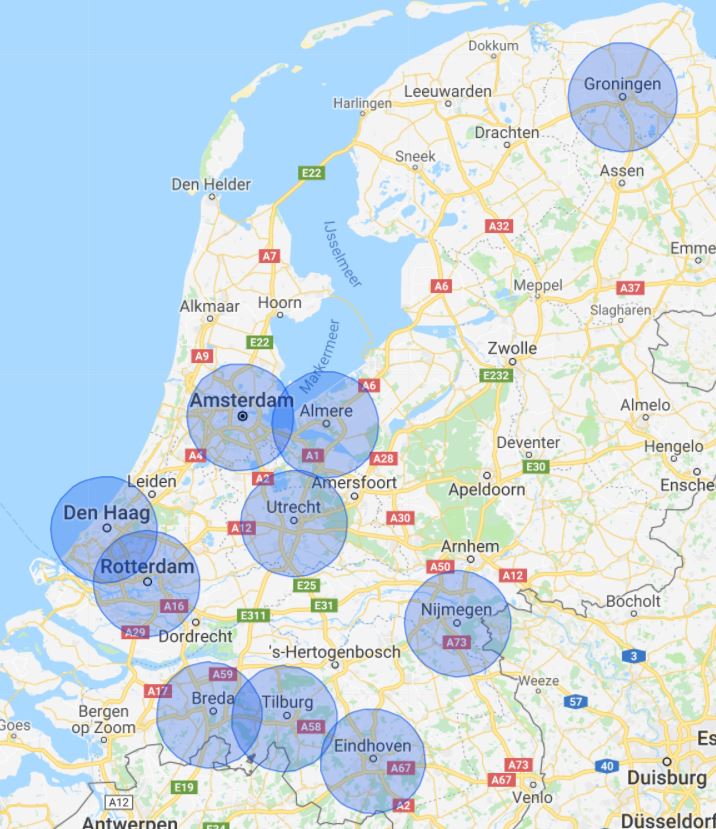
- Possibility to deliver within 30 minutes
- Cheaper for the buyer
- On time, more profit for the supplier
Disadvantages
Although the beehive offers a lot of promising advantages, there are also some downsides. First of all, to be able to deliver packages within 30 minutes to the 10 major cities of the Netherlands, every city needs its own beehive. These cities have been drawn in Figure 10.9 aside [39]. Taking in account that currently, only 4 of the 10 cities have a distribution centre nearby, 6 completely new distribution centres have to be built. Building such project close-by or within those major cities brings along quite some trouble as well as costs. And all the drones delivering from the beehives have to be accounted for. As stated in the assumptions, 172.000 deliveries have to be made daily with drones. Assuming 67% is ordered in the major cities, about 115.000 deliveries have to be made with only 10 beehive. Assuming one drone can deliver about 4 packages an hour, recharging time takin into account, and the drones fly for about 10 hours a day, so 40 packages a day can be delivered by each drone. This results in a supply of around 3.000 drones in 10 beehives, so 300 per beehive. And since each drone costs €3500, a total of €10.5 million euros has to be invested.
Beside the fact that the implementation of the beehives need a big start-up, the beehive might not be the most attractive building to have around. It is quite high so it can clearly be seen over a large range and it has lots of activity, resulting in distractions and irritations for people in the surroundings. Not even starting about all the flying drones in the air which people might get frustrated about, especially the ones working in high business-towers. And the fauna environment around the beehive might also be supressed by all the flying drones.
- Limited within a range of 16 km
- Large start-up costs
- Building projects bring along trouble
- Distraction for fauna environment
- Distraction for surrounding people
Truck-drone combination
A truck-drone combination is another possible solution. The main idea of this concept is to deploy a number of drones from a stationary truck. By using a strategic position for the placement of the truck, the distance covered by the drones is minimized, hence the delivery time can be reduced. Implementing this method creates a number of difficulties that have to be tackled. First, the capacity of a truck has to be approximated. The amount of drones per truck and the amount of packets per truck have to be determined. This is done by making assumptions, this way a truck contains at least 10 packets and 2 drones. To investigate the efficiency, the calculations can be repeated for different numbers of drones and packets per truck.
Static deployment
Another important problem is that of the placement of the truck. In this delivery method it is assumed that 1 truck is placed in Eindhoven for all the deliveries at that time. To optimize this placement, different techniques can be used.[40] The two most appealing are:
1) Determine the geographic midpoint.
2) Determine the centre of minimum connecting distance (aka Steiner point).
For the first, the benefit is that the maximal distance from the truck to a destination is minimal. This way it can be prevented that an empty truck is extensively delayed by a single drone that is still enroute to/from the furthest delivery destination. This method is optimal when the number of drones is significant compared to the amount of packets to be delivered. For the second, the benefit is that the total distance travelled by the drones is minimized. Therefore when the number of drones is very small compared to the amount of packets, the total time can also be optimized.
To compare this method with a traditional parcel delivery, an example scenario is worked out.
The distribution company has 10 packets that they have to deliver in the city of Eindhoven.
The locations at which they have to deliver are (random locations) shown in Table I.
Calculating the geographic midpoint results in: 51.448193, 5.464556
Calculating the centre of minimum distance results in: 51.443398, 5.465531
The comparison between the traditional delivery system and the truck-drone is computed. Since the distribution centre closest to Eindhoven is located at De Herven in Den Bosch, this means that the vehicle will be approaching from the North. With this in mind, the shortest route for the traditional delivery can be planned, starting at Kerkdorp Acht. The travel time from the distribution centre to Kerkdorp Acht is approximately 25 mins. The delivery route followed from there on to the 9 other destinations is shown in Figure 11.1.
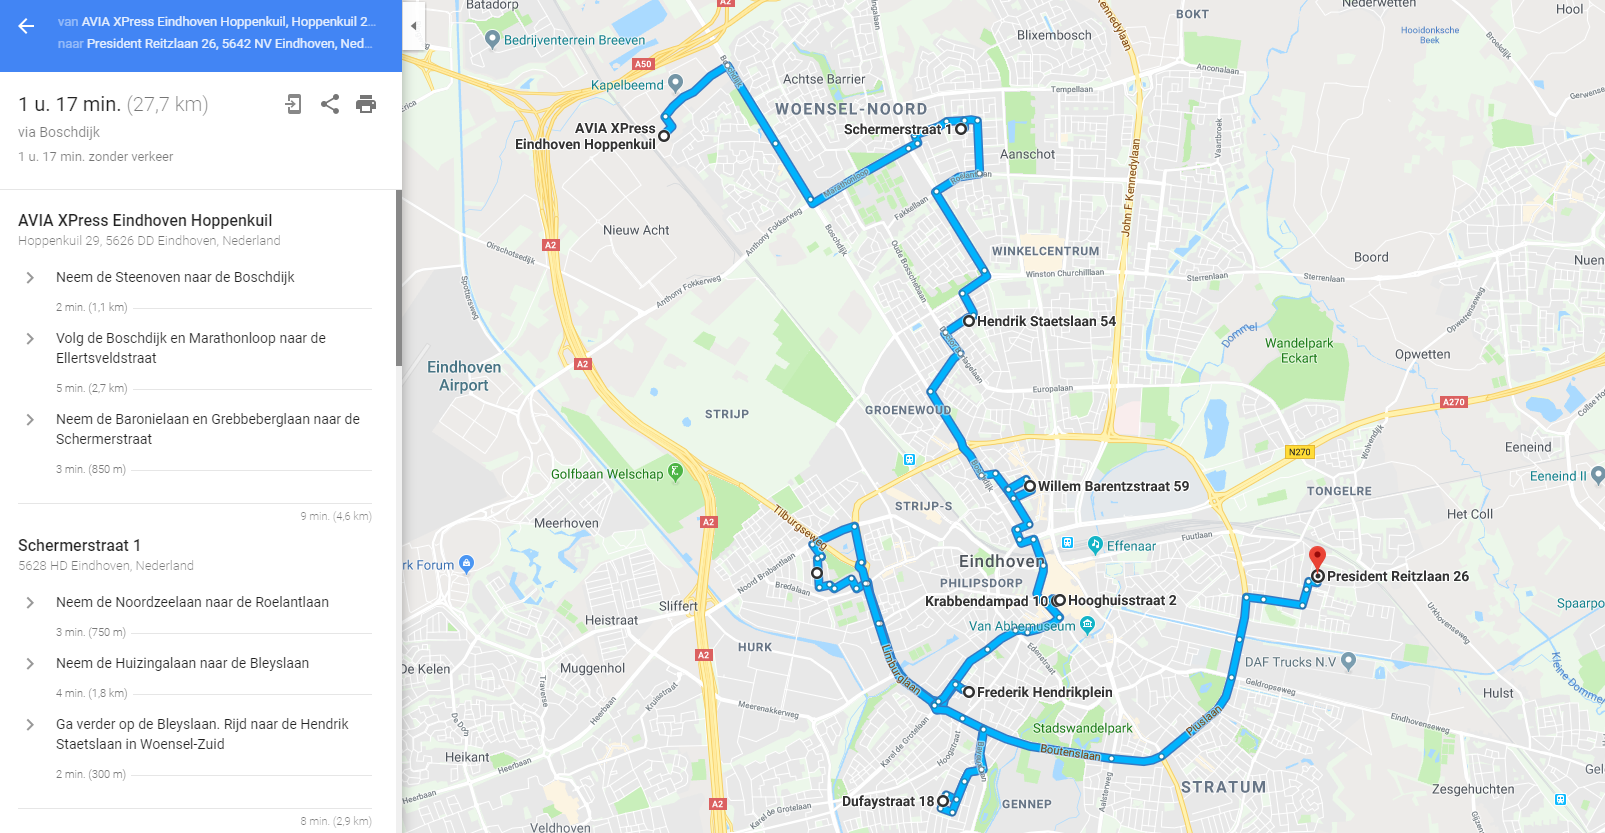
This accounts for an additional 1h 17mins for the delivery of all 10 packages. In total this results in a delivery-travel time, for the last package, of 1h 42mins.
Now this can be compared with the truck-drone method.
First of all, the truck has to drive from the distribution centre to the geographic midpoint, this takes approximately 30 mins.
From there, the drones will be deployed.
A deployment strategy for the drones is crucial to optimally use both the resources and the time available.
By measuring the total distance from the geographic midpoint to the delivery destinations, we can compute the minimal number of drones required to deliver the 10 packets without recharging.
The distances towards each point are shown in Table I.
| Delivery destinations | |||||||||||||||||||||||||||||||||
|---|---|---|---|---|---|---|---|---|---|---|---|---|---|---|---|---|---|---|---|---|---|---|---|---|---|---|---|---|---|---|---|---|---|
|
Now with a total flight distance of 47410m it is known that a minimum of 2 drones is required to deliver all packets without recharging (assuming a total range of 32km for each drone).
Table II shows the order of delivery and the (cumulative) time it takes for each delivery. As can be seen, the order of deliveries is based on a decreasing distance towards the destination. In other words, the furthest delivery point will be the destination for the first drone, the second drone will fly towards the second furthest delivery point and so on. The cumulative time is used to determine which drone goes to what location. However, important to note is that the cumulative time is not the same as the delivery time, this is because the cumulative time is the time that corresponds with the moment where the drone arrives back at the truck. In other words, the delivery moment is equal to the cumulative time minus the time it took the drone to fly from the destination back to the truck. The maximal final delivery times for the locations are respectively: 1828.8s, 1230.96s, 901.84s, 687.44s, 598.8s, 384.4s and 380.08s.This way it can be seen that a decreasing maximal delivery time is achieved for an increasing number of drones deployed.
| Delivery destinations ordered | |||||||||||||||||||||||||||||||||||||||||||||||||||||||||||||||||||||||||||||||||||||||||||||||||||||||||||||||||||||||||||||||||||||||||||||||||||||||||||||||||||||||||||||||||||||||||||
|---|---|---|---|---|---|---|---|---|---|---|---|---|---|---|---|---|---|---|---|---|---|---|---|---|---|---|---|---|---|---|---|---|---|---|---|---|---|---|---|---|---|---|---|---|---|---|---|---|---|---|---|---|---|---|---|---|---|---|---|---|---|---|---|---|---|---|---|---|---|---|---|---|---|---|---|---|---|---|---|---|---|---|---|---|---|---|---|---|---|---|---|---|---|---|---|---|---|---|---|---|---|---|---|---|---|---|---|---|---|---|---|---|---|---|---|---|---|---|---|---|---|---|---|---|---|---|---|---|---|---|---|---|---|---|---|---|---|---|---|---|---|---|---|---|---|---|---|---|---|---|---|---|---|---|---|---|---|---|---|---|---|---|---|---|---|---|---|---|---|---|---|---|---|---|---|---|---|---|---|---|---|---|---|---|---|---|---|
|
| Summary | ||||||||||||||||||||||||||||||||||||
|---|---|---|---|---|---|---|---|---|---|---|---|---|---|---|---|---|---|---|---|---|---|---|---|---|---|---|---|---|---|---|---|---|---|---|---|---|
|
It can be concluded that a lot of time can be gained by making use of this truck-drone combination. Increasing the amount of drones results in an increase in time gain, however a maximal time gain is reached at 8 drones (in this specific scenario), at this point the max travel time for the group of drones is equal to travel time of the drone that has to fly to the furthest destination.
Dynamic deployment
Even though using a static truck with multiple drones for parcel delivery offers a great gain in time efficiency compared to the traditional method, this still can be enhanced by optimizing the method. One way of doing this is, as shown in the tables above, by increasing the number of drones per truck. Another possible point of optimization is the truck placement. Instead of using a single position for the truck, a dynamic approach in which the truck is also moving while deployment is ongoing is probably even more efficient for time gain.
This dynamic approach creates a few extra difficulties. The first one is that of the deployment itself, certain questions need to be answered to verify the possibility of application. Can a drone be deployed while a truck is driving? What is the optimal route for the truck? Since the solutions to these questions are way more complex compared to the static approach, a basic solution is given that still has a lot of room for improvement.
Using the same example scenario as for the static deployment, the dynamic approach is shown and simulated delivery times are calculated. Since the truck doesn't deploy at the geomidpoint anymore, new locations for deployment should be appointed. Based on the results of the static approach, it is known that for sufficient amount of drones, the main factor that constrains the max delivery time is the max distance from the truck to the furthest destination. So the aim of the dynamic approach will be to route the truck to minimize this distance.
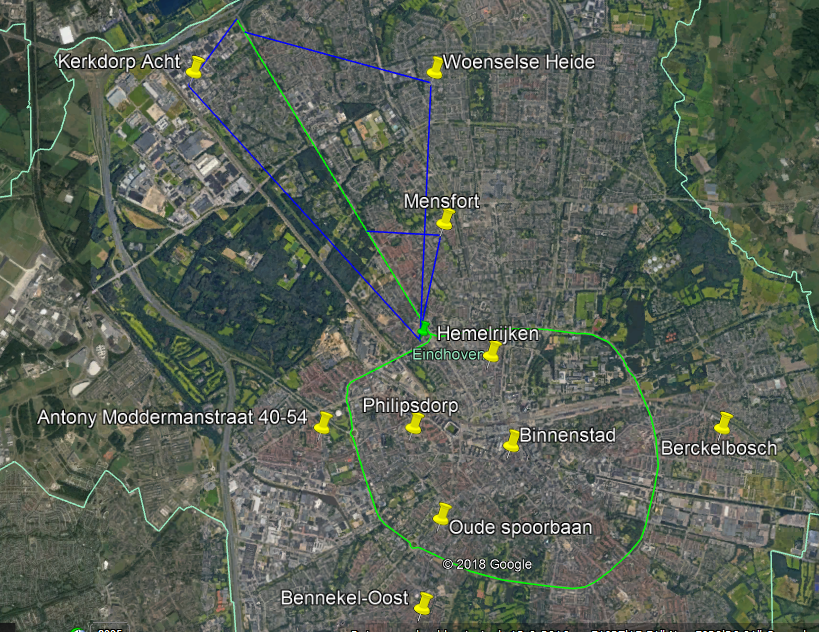 |
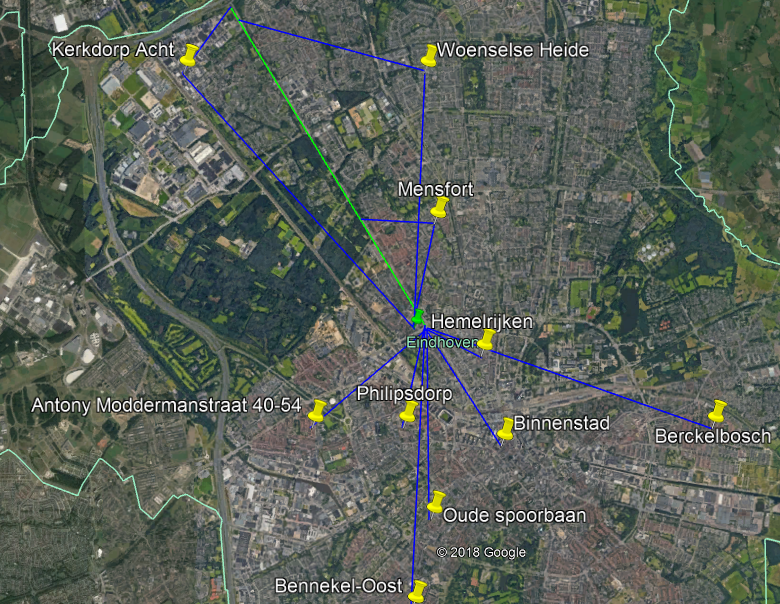 |
Figure 11.2 shows a possible solution for the dynamic approach. However in this specific situation, it is not an optimal solution. This is due to the fact that the truck has a low average speed in these parts of the city. Figure 11.3 aims to solve this, by limiting the amount of travel time for the truck by deploying all drones earlier. Since the dynamic aspect allowed the first three destinations to be reached by the drones before the truck comes to its final hold, enough drones are available (since a total of 8 is assumed to compare with static deployment) to reach the remaining 7 delivery locations. The travel times are represented in Table IV.
| Dynamic Delivery | |||||||||||||||||||||||||||||||||||||||||||||||||||||||
|---|---|---|---|---|---|---|---|---|---|---|---|---|---|---|---|---|---|---|---|---|---|---|---|---|---|---|---|---|---|---|---|---|---|---|---|---|---|---|---|---|---|---|---|---|---|---|---|---|---|---|---|---|---|---|---|
|
This shows that a small time gain is achieved compared to the static drone deployment strategy. Also a big time gain compared to the traditional delivery method.
Advantages and disadvantages of truck-drone combination
The main concept of the truck-drone delivery method is shown, explained and simulated. Possible different approaches to the method are given. And their quantitative results of delivery times have been simulated. However, implementing this has also other factors that influence the viability of the technology. These are listed and discussed as advantages or disadvantages.
Advantages
The truck-drone combination has the aim to deploy the drones for the 'last-mile-delivery', meaning that the last part of the journey is done by the drone(s). Especially in areas such as cities, this is a very promising approach because it will result in a lower amount of delivery vehicles used on public roads. This will enhance traffic flow for the other road users. Also, the drones are electrically powered versus the traditional method of delivery that mainly uses internal combustion engined vehicles for delivery. If the recharging cycle of the drones could be made green by the use of solar-, wind- or hydro energy then this combination would be less harmful for the environment.
As shown in the analysis, by using the dynamic truck-drone deployment method the delivery times for parcel deliveries in Eindhoven can be decreased by 65.67%. This allows the delivery companies to increase their output capacity with the same number of employees. This way the costs for the company on hourly wages stays the same for an increase in revenue. Also since the trucks or vans used now don't have to visit each delivery destination, the fuel consumption and therefore fuel cost is decreased. Because of this decrease in costs for the company, the costs per package can be lowered for the end user (or buyer).
Because it is a hybrid solution that still uses trucks, the current infrastructure of distribution centres is still usable. This means that no big investments have to be made in (specific) new infrastructure before the technology could be applicable. In other words, the initial costs of the technology only consist of the investment in the drones (and perhaps in the altering of some of the trucks to allow for easy drone deployment).
Even though the technology can be very useful in crowded areas such as cities, in very highly populated areas such as Amsterdam, it might not be the most efficient solution due to the time loss of the truck in congested traffic. So the main area of applicability would be in smaller cities such as Eindhoven and perhaps villages.
Disadvantages
Launching and landing in highly populated areas creates challenges for the drones. Obstacles such as trees, people, cars and buildings have to be avoided at all costs which will require some kind of sensing performed by the drones. Especially when using the dynamic deployment, the actual strategy design becomes rather complex, meaning that resources have to be spend to develop some algorithm or software that automatically plans the route, points of deployment, optimal number of drones per truck etc. These factors contribute to a higher initial cost of the technology.
Another drawback is the increase in airtraffic. The use of flying delivery drones will result in a busy network of drones crossing above the cities. For some this might be considered 'landscape pollution'. Even though the drones take over the majority of the delivery process, trucks are still used to get close to the specific area. This means that there is still CO2 emission present in the process of delivery.
Another disadvantage of this technology is the constraint created by the use of trucks. More specifically, the truck will only depart from the distribution centre whenever it is completely filled with packages. This delays the minimal delivery time for the delivery of a package. The worst case would be that when someone buys a product online, that package is the first to be entering a truck, then it has to wait for sufficient other purchases in the same area before the truck can depart.
Probably the biggest drawback or challenge for the truck-drone combination is that of legislation. Currently in the Netherlands, this technology would not be legal. Multiple rules for drones prevent the use of drones in crowded areas. However, since the drones are used for specific areas (such as cities) at a time, they don't require to travel at very high altitudes and could stay at the lower parts of the airspace (<250m). This way, adapting the legislation would not be too difficult since most of these areas are already prohibited for other aircraft anyway.
The Zeppelin warehouse
The last option which we consider as a delivery method with drones for packages is the zeppelin warehouse. For this idea Amazon has been awarded a patent. The idea of this delivery method is basically a giant flying drone mothership zeppelin warehouse, better known as the airborne fulfillment center (AFC) at high altitudes of around 45.000 feet in the air. This AFC contains lots of products and unmanned aerial vehicles (UAV/drones) which are used for the delivery of these products. The UAV will leave the AFC to deliver the product when the customer places an order. An advantage of this delivery method is the fact that the UAV’s will be able to have a much wider delivery range while consuming less power as they would be gliding down to deliver packages instead of having to take off and land. To maintain the functionality of the zeppelin warehouse there are used some smaller airships to return the UAV’s back to the AFC, to resupply the mothership with more inventory and fuel and shuttle workers to the flying factory. Another advantage is there is the possibility to deliver items within minutes. The mobile nature of the warehouses would allow Amazon greater flexibility in managing inventory in the face of changing demand. For example, the patent offers a hypothetical case of deploying a AFC near a sport stadium to allow for immediate delivery of team merchandise and snacks during a game. Also the drones would be able to communicate with each other via a mesh network to give information such as weather and route. UAVs could also recharge on the airship. For a visualization of this idea see the image below.
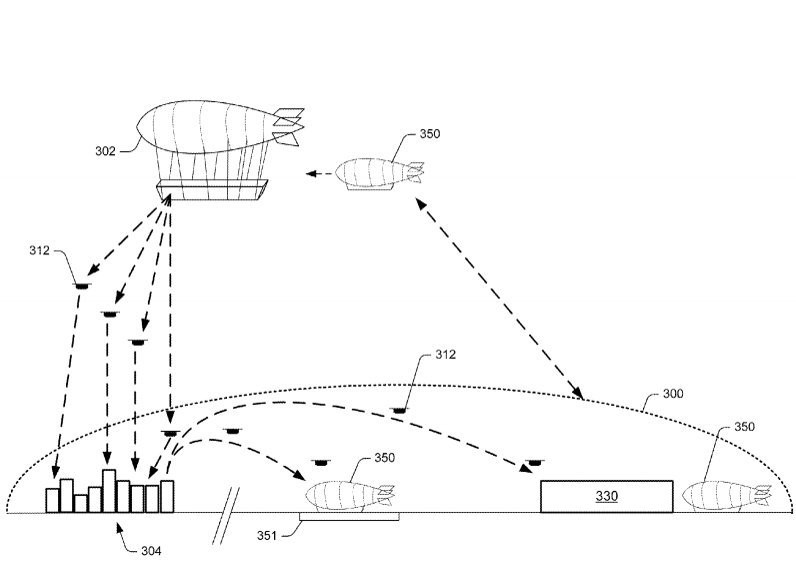 |
Implementation of the Zeppelin Warehouse
To make a success of the Zeppelin Warehouses and to realize the higher delivery ranges for packages, drones which can glide down effectively has to be implemented. When flown at a constant speed in still air a glider moves forwards a certain distance for a certain distance downwards. The ratio of the distance forwards to downwards is called the glide ratio (L/D ratio); this has to be highest as possible for this case:
[math]\displaystyle{ \frac{L}{D}=\frac{\Delta s}{\Delta h}=\frac{v_{forward}}{v_{down}} }[/math]
A glider's glide ratio varies with airspeed, however it usually varies little with vehicle loading; a heavier vehicle glides faster, but this impact on the glide ratio is assumed negligible since it is so small[41]. For a few examples of glide ratio’s, see the following link:[42] Unfortunately the glide ratio for drones is unknown so an assumption has to be made for this (taking into account the known values). The optimal glide ratio at a given speed can be extracted from the glide polar, the glide polar shows the still air sink rate of the glider with respect to its ground speed. However, since the glide polar for drones is also unknown, a simulation based on dimension assumptions was made. To realize this, the following specifications have been used for the delivery drones:
| Drone specifications | ||||||||||||||||||||||||||||||||||||
|---|---|---|---|---|---|---|---|---|---|---|---|---|---|---|---|---|---|---|---|---|---|---|---|---|---|---|---|---|---|---|---|---|---|---|---|---|
|
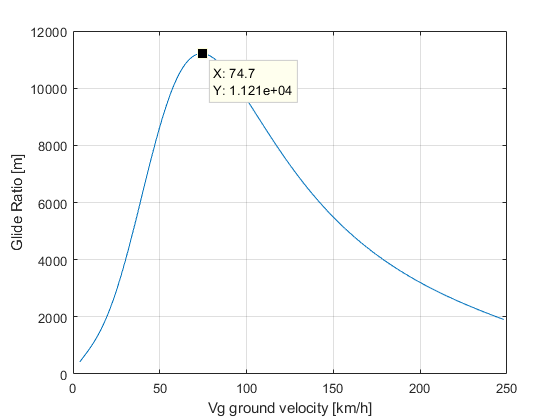
To construct the glide polar for our drone a simulation (in Matlab) has been constructed based on the theory of aircraft aerodynamics. [43][44] The main concept used is to determine the drag and lift forces for a sufficient range of airspeeds. With these values, the glide ratio can be determined for this range of speeds which allows the construction of the glide rate plot.
Here the y-axis is the horizontal flight range in meters when the drone is at 1000m altitude, compared to the flight speed on the x-axis in [km/h]. As shown in the figure, the optimum glide ratio for an unloaded drone occurs at a ground velocity of 74.7 [km/h], which yields a glide ratio of 11.21.
The AFC can be used in two different scenarios, above a densely populated area or above a sparsely populated area.
Above a sparsely populated area
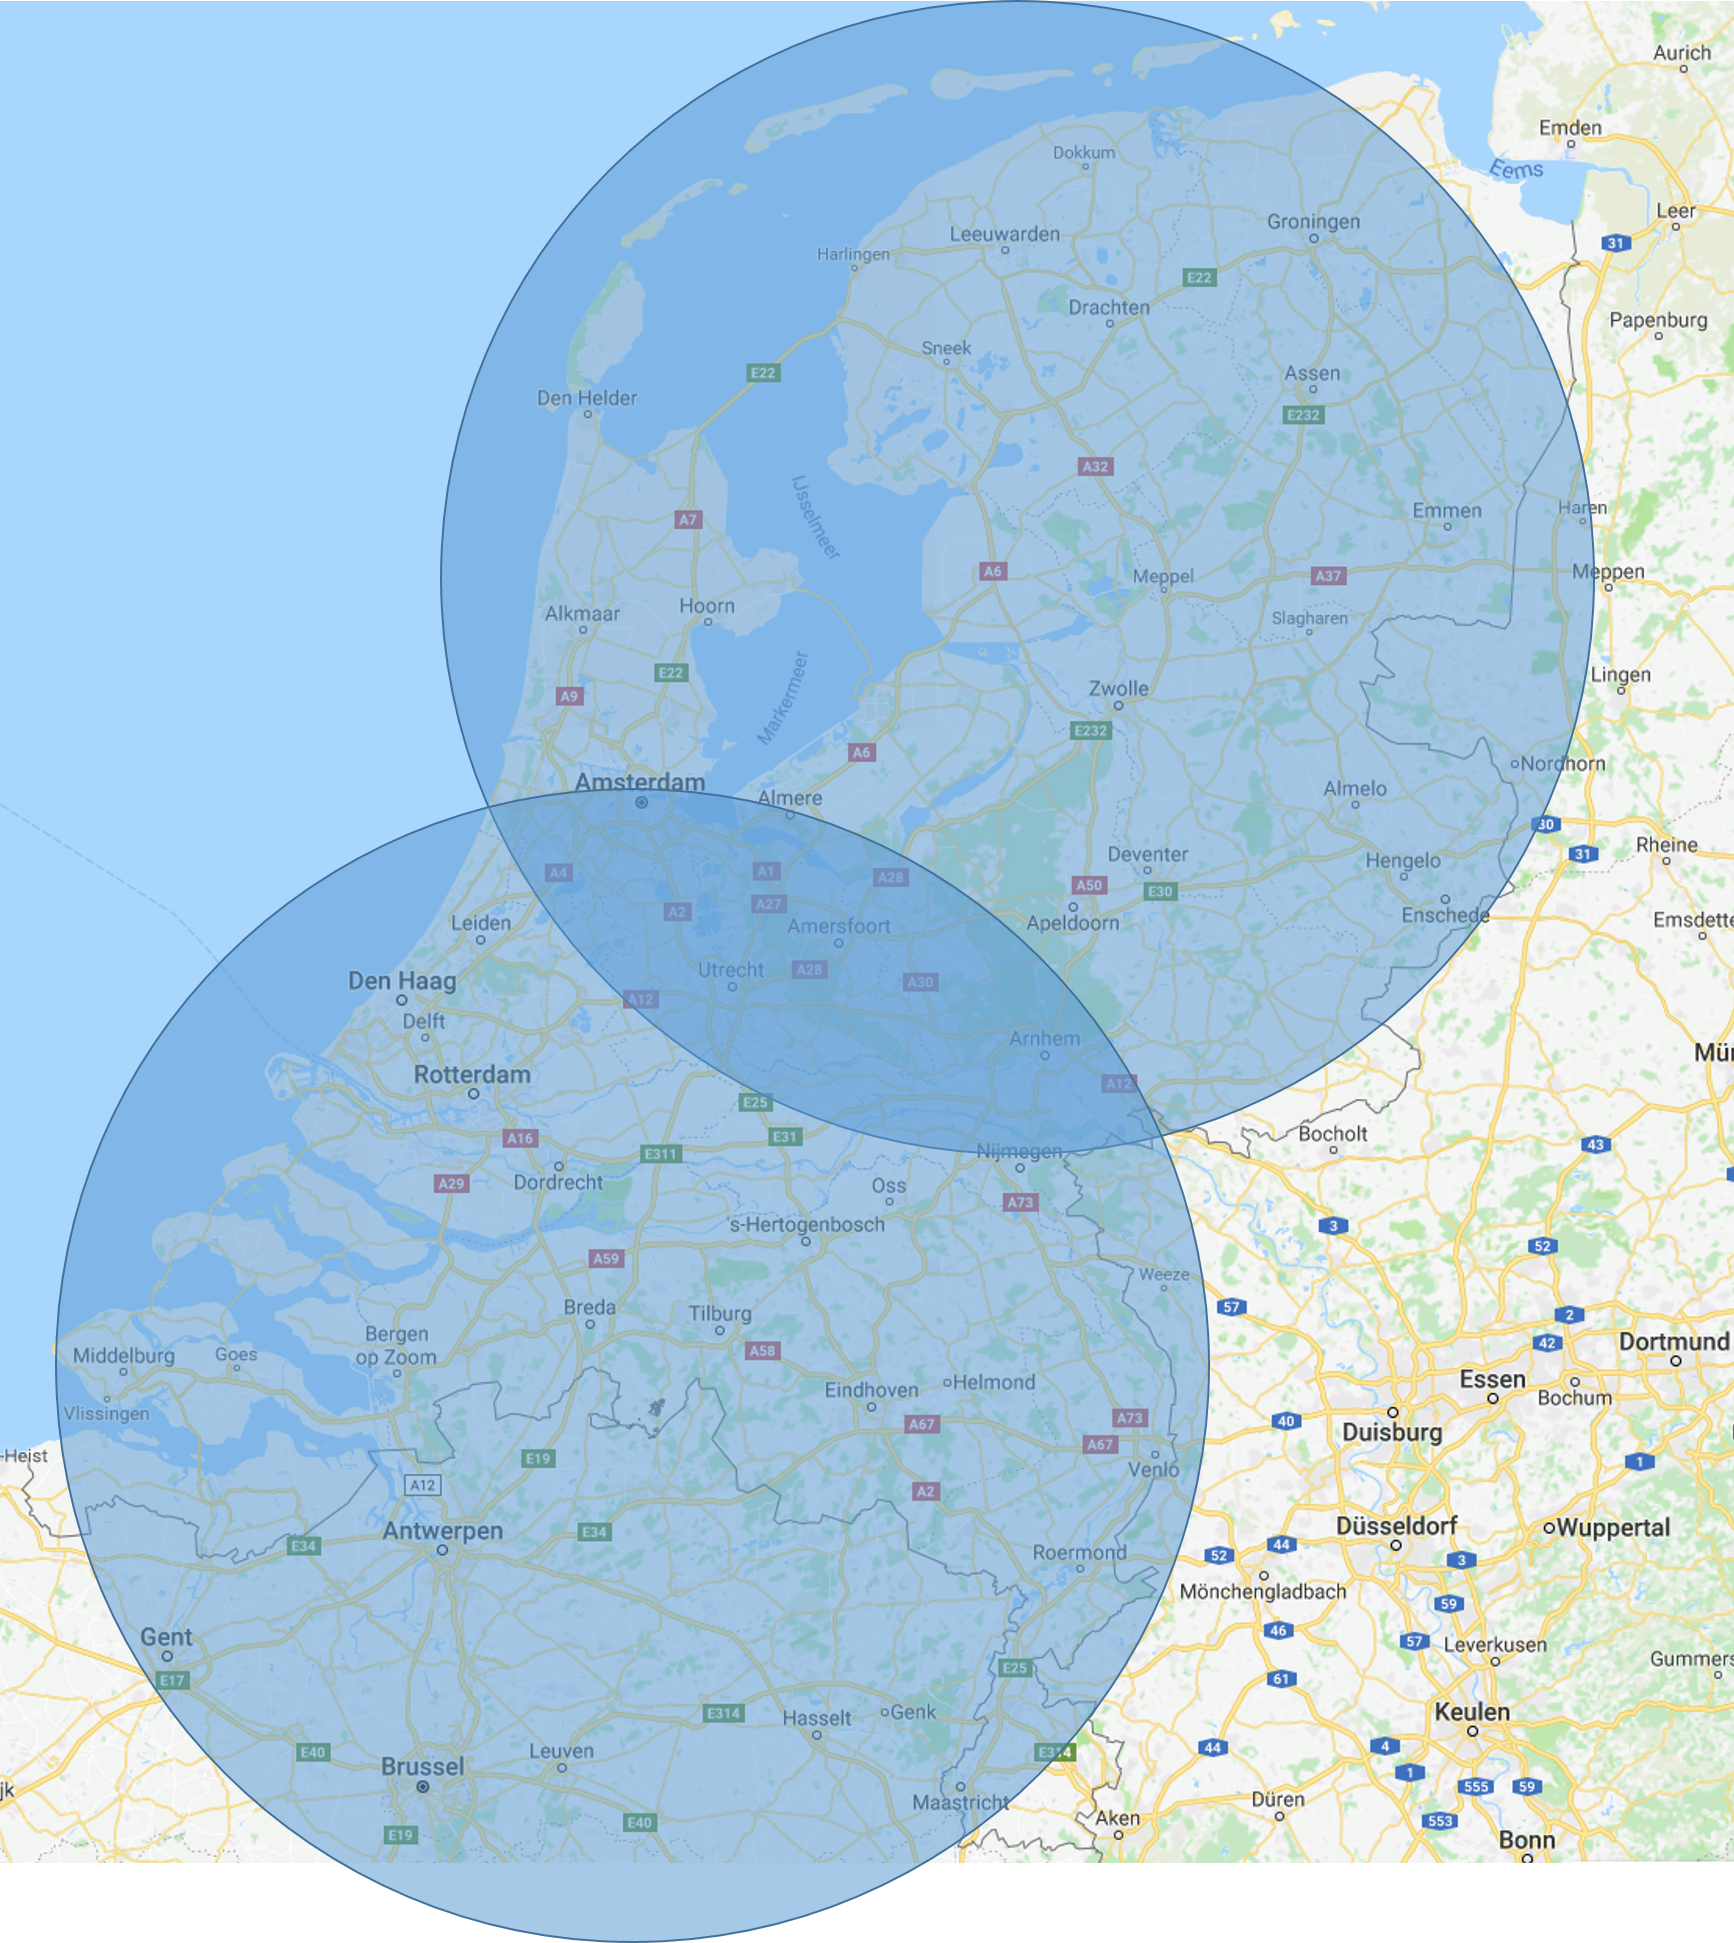
Above a sparsely populated area delivery range is more important than fast delivery times. This is mainly because using multiple small-range AFCs in a sparsely populated area is very expensive, while there are very few packages ordered. This would then drive up the delivery costs dramatically, which then results in fewer people using the service. So in this case the speed of the drone is chosen as the speed with optimum glide ratio, this velocity is then 74.7 km/h, this then gives a glide ratio of 11.21. With this glide ratio, assuming the AFC is positioned at 45,000 feet as in the patent of Amazon, the maximum delivery range is then 153.75 km. A problem with a delivery range of 153.75 km is the flight back, since the flight range of the drones is only 32 km, the drones are unable to fly this distance in one go. A possible solution is to put rings of recharging pads at 32 km intervals around the refill centre, this however would result in 4 rings of increasing size around the refill centre. Since these charging pads are not likely to be extremely cheap, and considering the large amount of pads which are going to be necessary to implement this, this solution is very likely to be expensive.
Another option would be to place pickup points for the drones around the refill centre. From these pickup points, the drones will then be transported to the refill centre for example by truck. This would mean that for each zeppelin, at least [math]\displaystyle{ \frac{\pi \cdot 153.75^2}{\pi \cdot 64^2}=5.77 }[/math] pickup points are needed, not including overlap between radii. It may also possible to replace these pickup points with refill stations, this would save the trouble of getting the drones from the pickup points to the refill station. However this would result in a large amount of refill stations, these stations all have to be restocked with supplies. This is a lot more difficult than resupplying just one refill station, since then all supplies are centrally stored, instead of some items being in one warehouse, while others are somewhere else. Also, each of these refill stations have to be equipped with at least one refill ship. This would result in the posibility of parallelising restocking, which can save time. However, since the refill ships need a certain amount of cargo to be rendable to fly, this process will not likely be as fast as it sounds. Next to that, the refill ships are likely to be expensive, as well as the refill stations themselves, so this solution is likely much more expensive than the implementation of pickup points.
Above a densely populated area
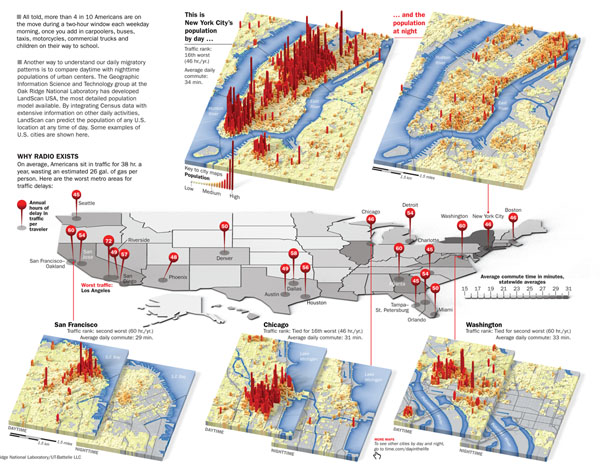
Above a densely populated area the use of the AFC resembles closely the use of the beehive. The delivery range does not have to be large, since there will be a lot of orders within the city. This means that the speed of the drone can be increased, since it is no longer important for the delivery range to be optimal. The minimum altitude at which the AFC should be positioned can be calculated according to [math]\displaystyle{ \frac{v_{ground}}{2 \cdot glide ratio}[km] }[/math]. With the AFC positioned at 45,000 feet, a glide range of 64 km can be achieved at a velocity of 128 km. This is ideal if charging pads are used, because this is precisely twice the flying range of drones, so only one ring of charging pads is needed for this solution to work. Also, this choice of speed results in a maximum delivery time of 30 minutes, which is ideal for users and enterprise.
During the day, people move from their home to their work or education, this mainly results in a movement of people from villages to the city. Since an AFC is mobile, this shift in population density can be acted upon by moving the AFC around during the day. In this way the AFC is always close to the busiest areas, where the most packages are ordered. This will massively decrease delivery times, since the AFC is already close to the delivery point. This also results in that the drones can be used more effectively, since the time of flight per delivery is reduced, the drones can deliver more packages per day. Also this increases the effectivity of the AFC, since there will be a lot of packages which can be delivered from the AFC in a short time.
Airspace regulation
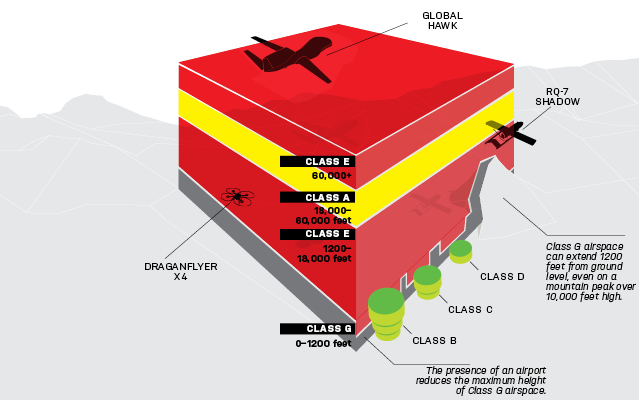
In both of the listed cases, it is important to consider that the AFC is positioned in the air. This brings with it the troubles of regulating air traffic around the AFC. The AFC is position is chosen at 45,000 feet since that is above all other air traffic, however, this does mean that the drones have to cross the airspace of, amongst others, airplanes. Also the refill ships have to cross this airspace when restocking the AFC. Currently, the airspace regulations state that between 18,000 and 60,000 feet is reserved for airplanes, but this region could also be used for autonomous drones[48]. A possible solution could be to instantiate a no-fly zones underneath the AFCs, in this way the trouble with the air traffic control is avoided entirely. This however would mean that these no-fly zones vary in location during the day, this may cause problems for air traffic control since they have to account for these no-fly zones when they decide where each plane should fly. This also makes the planning of plane routes difficult if the movement of the AFC is not strictly regular.
Another possibility would be to make the drones comply with the current regulations for planes. This would mean that the unmanned drones have to be equipped with transponders which communicate altitude and location to local air traffic control. Also these drones have to be equipped with sensors which enable them to detect and avoid planes in cases of emergency[48]. This would mean that the routes the drones will fly first have to be approved by local air traffic control before the drones can take off, which is very likely to cause delays. This also puts a lot more stress on air traffic control, since they now also have to account for the drones coming from the AFC.
Advantages and disadvantages
The concept of the airborne fulfillment centre has been discussed, as well as its implementation. Now the main advantages and disadvantages are important to list, so that is done below.
Advantages
The speed at which the drones fly can be varied according to how far the drone has to fly. So if a larger delivery range is necessary, the speed of the drones can be decreased, this then increases the glide ratio, and thus the glide range, of the drone. This enables the AFC to be used in multiple different scenarios, each with their own advantages and disadvantages.
If used above a densely populated area, the AFC mainly has the advantage that it is mobile, so it can move along with population density shifts during the day. This enables the AFC to be used optimally during the day, this means that the delivery time is as short as possible, which enables the drones to deliver more packages per day. Next to that, the delivery time is less than 30 minutes if the speed is chosen at 128 km/h.
If used above a sparsely populated area, the AFC mainly has the advantage that is has a very large delivery range. This means that only one AFC is needed to supply a large area, which saves money compared to when multiple AFCs are necessary.
If the AFC has a shorter delivery range, it becomes a beehive in the air, so the warehouse can be placed closer to the city without requiring ground to be build upon. This has the advantage that delivery times on average can be shorter, since the AFC is placed more centrally above the city.
Disadvantages
If the AFC is positioned at 45,000 feet, the drones and refill ships have to cross the airspace of planes often. Currently this is not allowed anywhere in the world, since the airspace of airplanes is strictly regulated. New legislation will have to made to fix this problem. This legislative process will cost much time and research to be completed, since this is a large adaption to the current airspace regulation.
Another drawback of the AFC is that drones have to navigate alongside other air traffic, including airplanes and other drones. This would mean that the drones have to be equiped with yet to be developed sensors, which enable the drones to avoid other air traffic in cases of emergency. Since these sensors do not exist yet, research and development needs to take place before the legislative process of allowing drones in the airspace of planes can even begin.
Yet another disadvantage is that if a large delivery range is chosen, then the delivery time becomes large. For the maximum delivery range of 153.75 km, the delivery time is almost two hours. This comes with the problem of getting the drones back, which is likely to be a time consuming process, with a large investment cost.
Recommendation
After conducting a survey that gauged the user's preferences on the parcel delivery method and comparing/investigating the current parcel delivery system with the three alternative methods involving drones, a final conclusion can be made. To be able to do this multiple criteria are considered part of a decision matrix on which the final recommendation can be based.
Decision Matrix
The decision matrix is based on criteria that have been investigated in this project. These criteria are:
- Costs:
- Initial costs
- Delivery costs
- Company costs
- Delivery options
- Single package
- Exact location
- Delivery time
- Impact on surroundings
- Implementation possibilities
- Pollution
- Traffic fluency
All of these criteria are then weighted. For the criteria such as delivery costs, delivery time, single package and exact location the weights can be based on the output of the user's research done in this project. For the other criteria the weights have to be determined in other ways. In the example decision matrix that is shown on the right, values are chosen for the remaining criteria. However these should be based on the specific profile of the delivery company and the area of application. This way a parcel delivery company that promotes 'green' vehicles for their deliveries could optimize the decision matrix to choose for a higher weighting factor for the pollution and perhaps the traffic fluency criteria.
The main challenge for the implementation of such a decision matrix is that of the accurateness of the data for each of the methods. To improve the robustness, follow up research should be done on these methods. This research should then try to obtain more accurate data on criteria other than delivery times, such as initial costs, maintenance costs, levels of pollution etc. Also the fact that most of the criteria correlate to each other, causes more difficulty in determining the correct corresponding data and weighting per criteria and method. However, based on the research done in this project, a relative ranking between the 4 methods can be approximated that allows to simulate a possible output for the decision matrix.
Important to note is not every criteria can be rated in the same way. Some criteria can directly be assigned to a method but some are area dependent. Therefor it is chosen to take some of the criteria out of the decision matrix and combine them with the population density matrix. This way the criteria combine their possibilities for each method per population density level. The criteria taken into account are the population itself, the traffic fluency and the implementation possibilities. It is chosen to combine the area dependent criteria in the weighting of the population density matrix. The last remaining criterion is the delivery time, which is completely depend on the area of delivery for each method. To be able to implement this criterion, values can only be obtained by running the simulations for that specific scenario. To show an example of an output for the decision matrix, 2 different cities are considered.
These cities are:
- Den Haag
- Tilburg
Let's assume that 50 parcels have to be delivered randomly spread accross the city. For both the Beehive and the AFC the delivery drones can be instantly engaged to all targets because their capacity is considered to be larger than 50 drones. For the Truck-drone combination a capacity of 10 drones is assumed together with the 50 parcels, this way (for ease of calculation) it is assumed each drone does approximately 5 deliveries each, for T-D delivery.
For Den Haag, choosing a location in the centre of the city allows to have all destinations in a radius of 5.9km at most. Assuming a delivery speed of 50km/h for the drones in the Beehive and Truck-Drone method and a delivery speed of 90km/h for the drones in the zeppelin (AFC) method. This way the max delivery time for the Beehive would be 5900m/(13.89 m/s)= 425s, the truck-drone method approximately 2455s while the AFC would have 249.2s, if it is assumed to be hovering at 2km altitude above the centre or 415.6s when it is assumed to be hovering at 2km above a non-populated area (the sea in this case) and 661s if it is hovering at that same position but then at an altitude of 13km.
 |
For Tilburg, choosing a location in the centre of the city allows to have all destinations in a radius of 4.8km at most. Assuming a delivery speed of 50km/h for the drones in the Beehive and Truck-Drone method and a delivery speed of 90km/h for the drones in the zeppelin (AFC) method. This way the max delivery time for the Beehive would be 4800m/(13.89 m/s)= 346s, the truck-drone method approximately 3607s while the AFC would have 208s, if it is assumed to be hovering at 2km altitude above the centre or 333.6s when it is assumed to be hovering at 2km above a non-populated area (a forest area in this case) and 612.64s if it is hovering at that same position but then at an altitude of 13km.
 |
The output of this decision matrix gives a good indication towards the final recommendation. According to the results, for the case of Den Haag, which has a very high population density, the Beehive delivery centre would be the most optimal solution. Its ability to deliver lots of parcels in short amounts of time outweighs the disadvantage of high start-up costs. Also the main limitation of the Beehive is its limited delivery range, which is in a scenario such as Den Haag, is not a problem. The population density is sufficiently high to keep the Beehive busy delivering parcels while the delivery range is small enough if the Beehive is placed near or in the city.
For the case of Tilburg, with a much lower population density, the Truck-Drone combination is the most optimal solution according to the output of the decision matrix. Due to its low start-up costs, low delivery costs and adaptability in medium population density areas, the disadvantages of (rather) slow delivery times and high pollution rates can be outweighed in the case of Tilburg.
Coaching Questions
State of the art
References
- ↑ https://www.statista.com/statistics/534123/e-commerce-share-of-retail-sales-worldwide/
- ↑ https://www.weforum.org/agenda/2016/01/a-brief-guide-to-the-technologies-changing-world/
- ↑ https://nos.nl/artikel/2072466-pakketbezorging-met-busjes-door-snelle-groei-niet-vol-te-houden.html
- ↑ https://www.sciencedirect.com/science/article/pii/S235214651400297X/
- ↑ https://www.recode.net/2017/10/25/16538828/amazon-key-in-home-delivery-prime-camera-lock/
- ↑ https://www.amazon.com/b?ie=UTF8&node=6442600011/
- ↑ http://www.newsweek.com/amazon-drone-tower-patent-628713
- ↑ https://www.digitaltrends.com/cool-tech/amazon-drone-patent-save-battery-power
- ↑ https://techcrunch.com/2016/12/28/amazon-patents-show-flying-warehouses-that-send-delivery-drones-to-your-door
- ↑ https://nos.nl/artikel/2072466-pakketbezorging-met-busjes-door-snelle-groei-niet-vol-te-houden.html
- ↑ https://www.postnl.nl/en/about-postnl/about-us/annual-review-2016/?pst=sp-pnl-pos-enabout-postnl-banner-building_our_futureannual_review_
- ↑ https://www.postnl.nl/en/Images/annual-report-2017_tcm9-115056.pdf?v=8c27b618066baa7b818fdb4505df6048
- ↑ https://www.theelitedrone.com/best-rc-helicopter-for-beginners/
- ↑ https://www.conrad.nl/nl/thunder-tiger-raptor-e550-rc-helikopter-arf-1539420.html?WT.mc_id=gshop&WT.srch=1&gclid=Cj0KCQjwv73VBRCdARIsAOnG8u2mL4wNU1QzMgl0G_bobrvY0-qn8ADEWfr6IPo6QgLRdQGZRDXWxMIaAlcEEALw_wcB&insert=8J&tid=951383695_45708089245_pla-370059029402_pla-1539420
- ↑ https://www.amazon.com/MC6-1600-waterproof-commercial-Aircraft-Accessories/dp/B075V5J3PV
- ↑ https://www.amazon.com/DJI-Matrice-100-QUADCOPTER-DEVELOPERS/dp/B011CE6U7O/ref=as_li_ss_tl?linkCode=sl1&slotNum=1&linkId=ce6829c60c2f03c344558960805bac8d&keywords=dji+matrice+100&imprToken=MZKwg5gM67tUfYwP-sEbLQ&tag=dglobe_guide-20&ie=UTF8&qid=1509763661&sr=8-2
- ↑ https://www.amazon.com/YUNEEC-YUNH920US-Tornado-Hexa-Copter-Transmitter/dp/B017P0EAZI/ref=as_li_ss_tl?linkCode=sl1&slotNum=0&linkId=3fb48db54f6ce1e5ac0f990dd031cbe2&keywords=yuneec+tornado+h920&imprToken=MZKwg5gM67tUfYwP-sEbLQ&tag=dglobe_guide-20&ie=UTF8&qid=1509764248&sr=8-1
- ↑ https://www.horizonhobby.com/product/airplanes/airplanes-14501--1/bind-n-fly/carbon-z-cessna-150-aerobat-bnf-basic-efl1450
- ↑ https://www.trouw.nl/home/gelukkig-vliegen-helikopters-nog-tot-windkracht-11~ad597fb6/
- ↑ https://www.conrad.nl/nl/e-flite-carbon-z-cessna-150-rc-vliegtuig-bnf-2125-mm-1543382.html?WT.mc_id=gshop&WT.srch=1&gclid=CjwKCAjw4sLVBRAlEiwASblR-2csYNgd2NgclwwR0-MuCpH3FQL8EHyxMVCKVRLJhFaf9ILR9Q-kQRoCl1wQAvD_BwE&insert=8J&tid=951383695_45708089245_pla-562391731912_pla-1543382
- ↑ https://www.amazon.com/Amazon-Prime-Air/b?ie=UTF8&node=8037720011
- ↑ https://www.theverge.com/2017/9/13/16299448/drones-blood-rural-medicine-diagnostics-tests-future-rural-medicine
- ↑ http://www.dailymail.co.uk/sciencetech/article-4073250/Amazon-s-flying-factories-Patent-suggests-firm-use-self-driving-AIRSHIPS-launch-delivery-drones.html
- ↑ https://www.popsci.com/amazon-patent-puts-drones-on-streetlight-recharging-stations
- ↑ https://www.postnl.nl/klantenservice/vragen/locaties-brievenbussen/waar-staan-de-sorteercentra-van-postnl.html
- ↑ 26.0 26.1 https://www.anwb.nl/verkeer/nederland/verkeersinformatie/dagelijkse-drukke-trajecten
- ↑ https://nl.wikipedia.org/wiki/File_(verkeer)
- ↑ 28.0 28.1 https://www.freemaptools.com/radius-around-point.htm
- ↑ https://www.omroepwest.nl/nieuws/3313393/Tachtig-tot-110-pakketten-per-bus-bezorgers-hebben-het-druk-vlak-voor-Kerstmis
- ↑ https://pubs.acs.org/doi/pdf/10.1021/ef800806g
- ↑ https://www.youtube.com/watch?v=xW-VLPyxqAM
- ↑ 32.0 32.1 32.2 https://www.theguardian.com/technology/2017/jun/26/amazon-drones-delivery-beehive-patent
- ↑ https://www.theverge.com/2017/6/23/15860668/amazon-drone-delivery-patent-city-centers
- ↑ https://www.livescience.com/59617-amazon-patent-for-drone-beehive-airport.html
- ↑ https://www.postnl.nl/klantenservice/vragen/locaties-brievenbussen/waar-staan-de-sorteercentra-van-postnl.html
- ↑ http://www.logistiek.nl/distributie/nieuws/2016/12/over-10-jaar-per-dag-100-000-pakketten-in-amsterdam-101150392
- ↑ https://www.postnl.nl/tarieven/tarieven-pakketten/Pakket/NL/0-2kg
- ↑ https://www.indeed.nl/cmp/Postnl/salaries
- ↑ https://nl.wikipedia.org/wiki/Lijst_van_grootste_gemeenten_in_Nederland
- ↑ http://www.geomidpoint.com/calculation.html
- ↑ https://www.faa.gov/regulations_policies/handbooks_manuals/aircraft/glider_handbook/media/faa-h-8083-13a.pdf
- ↑ https://en.wikipedia.org/wiki/Gliding_flight#Glide_ratio
- ↑ http://kimerius.com/aerodin%C3%A1mica-4/
- ↑ https://arc.aiaa.org/doi/book/10.2514/4.103278
- ↑ http://www.joelertola.com/grfx/index.html
- ↑ Time magazine Nov.26, 2007 issue
- ↑ http://www.dronitaly.it/wp2015/lera-del-regolamento-enac-versione-2/
- ↑ 48.0 48.1 https://www.popularmechanics.com/military/a9397/this-is-how-the-faa-regulates-american-airspace-15894142/
