PRE2019 3 Group10: Difference between revisions
| Line 86: | Line 86: | ||
<h6>Engineers</h6> | <h6>Engineers</h6> | ||
Engineers creating neural networks for image recognition or image processing in general. They can use our tool to create a better understanding of the strengths and weaknesses of their network and how it works. They can use this knowledge to repeatedly improve their network until it holds a standard that they are satisfied with. | Engineers creating neural networks for image recognition or image processing in general. They can use our tool to create a better understanding of the strengths and weaknesses of their network and how it works. They can use this knowledge to repeatedly improve their network until it holds a standard that they are satisfied with. | ||
The main way users can use our tool to help with this is by looking at important features. The saliency map that our tool shows indicates very clearly what features the network is focusing on. Knowing these features can help engineers improve their networks in several ways. | The main way users can use our tool to help with this is by looking at important features. The saliency map that our tool shows, indicates very clearly what features the network is focusing on. Knowing these features can help engineers improve their networks in several ways. | ||
They can preprocess their test data to show certain features more clearly | They can preprocess their test data to show certain features more clearly, they can modify their training dataset and they can also change the entire architecture of their network if their network is incapable of capturing key features even with a lot of data. | ||
We give some examples of how our tools can be used by neural network engineers: | We give some examples of how our tools can be used by neural network engineers: | ||
It is interesting to look at the saliency map of a certain class and look at what features the network values. If the data your network is intended to work for does not always have these features engineers might want to extend the training dataset to make sure other features are also recognised. They could also limit the use of their neural network to only images that have these features. | It is interesting to look at the saliency map of a certain class and look at what features the network values. If the data your network is intended to work for does not always have these features, engineers might want to extend the training dataset to make sure other features are also recognised. They could also limit the use of their neural network to only images that have these features. | ||
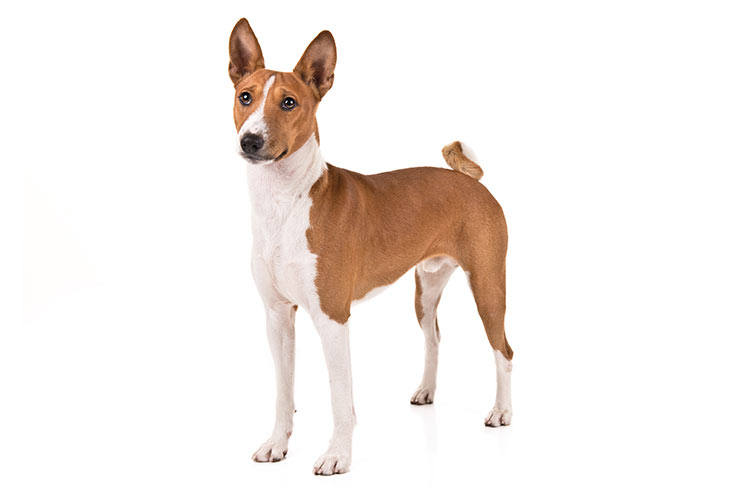
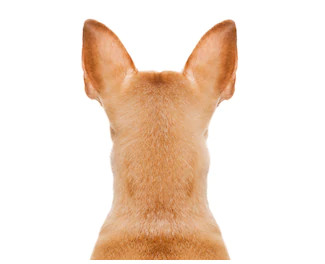
For demonstration purposes, in our current prototype we want to figure out if the network needs the face of a dog to recognize that it is a dog or not. | For demonstration purposes, in our current prototype we want to figure out if the network needs the face of a dog to recognize that it is a dog or not. | ||
| Line 102: | Line 102: | ||
[[File:Saliency_hond_back_crop.png|300px]] | [[File:Saliency_hond_back_crop.png|300px]] | ||
Another thing to notice from this demonstration is that our network is not good at classifying the race of dogs. In both cases it has misclassified the race of the dog. This tells us that if we want our network to be able to distinguish between different dog races we need to train it on more dog specific datasets. | Another thing to notice from this demonstration, is that our network is not good at classifying the race of dogs. In both cases it has misclassified the race of the dog. This tells us that if we want our network to be able to distinguish between different dog races we need to train it on more dog specific datasets. | ||
Yet another thing that engineers may want to take into account is how biased their data is. Here we'll try to show how colors affect the prediction of the network. <br> | |||
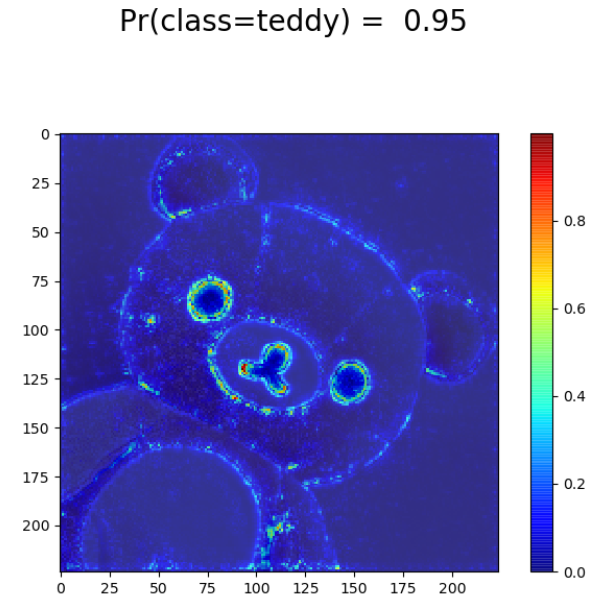
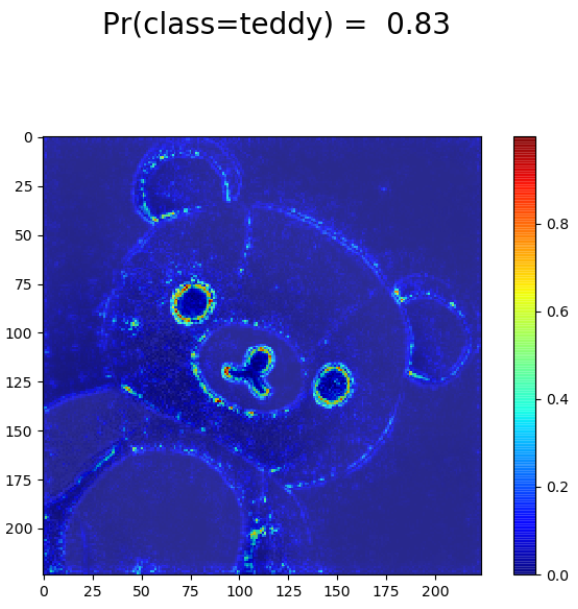
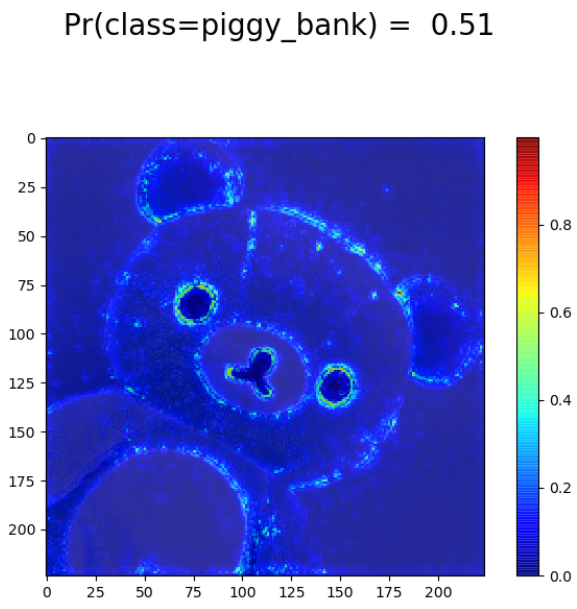
First, we have a teddy bear without filters. We can see that the network is very certain of its prediction. What happens if we apply a black-white filter on the image? We can see that the certainty of the prediction drops | First, we have a teddy bear without filters. We can see that the network is very certain of its prediction. What happens if we apply a black-white filter on the image? We can see that the certainty of the prediction drops quite a bit. It gets even worse when we apply a blue filter on the image. Now the prediction is completely wrong, the network predicts a piggy bank (although, it's far from confident). <br> | ||
Why is the network performing worse? An explanation may be that teddy bears usually have similar colors (beige/brown), so when a network is trained on these kind of colors, it will be less certain when you feed it an uncommon bear color. So it seems that there is actually a small bias in the training data. This is something that should be kept in mind when designing your own network. <br> | |||
On the second map, we can see that the network takes the ear into account whereas on the first map, the ears are not that important. You would think that by taking the ears into account, the network could make a better prediction but it seems like the opposite is the case. On the third map, the blue filter seems sufficient to entirely throw off the network. We can see that the mouth, nose and eyes are no longer the most important parts for the decision making of the network. Instead, there is a shift to the ears which | On the second map, we can see that the network takes the ear into account whereas on the first map, the ears are not that important. You would think that by taking the ears into account, the network could make a better prediction but it seems like the opposite is the case. On the third map, the blue filter seems sufficient to entirely throw off the network. We can see that the mouth, nose and eyes are no longer the most important parts for the decision making of the network. Instead, there is a shift to the ears which might be an explanation as to why the network predicts a piggy bank as these usually have similarly shaped ears. Especially the last example makes it clear why visualizing the prediction of a Neural Network is very helpful: without visualization it would be difficult to explain why the network would predict a piggy bank. | ||
[[File:Bear_without_filter.jpg|300px]] | [[File:Bear_without_filter.jpg|300px]] | ||
| Line 124: | Line 124: | ||
Students learning about convolutional neural networks in any setting can also benefit greatly from using our tool. Most courses focus on understanding how to implement neural networks and how the mathematics behind them work. Usually there is also practical work involved: trying to code a neural network and train and evaluate it on given data. | Students learning about convolutional neural networks in any setting can also benefit greatly from using our tool. Most courses focus on understanding how to implement neural networks and how the mathematics behind them work. Usually there is also practical work involved: trying to code a neural network and train and evaluate it on given data. | ||
Our tool would complement such a course by letting students play around with the network. Our tool can be used to understand more intuitively how the network operates. | Our tool would complement such a course by letting students play around with the network. Our tool can be used to understand more intuitively how the network operates. Below, we give an example of how we learned more about a network in our prototype tool. | ||
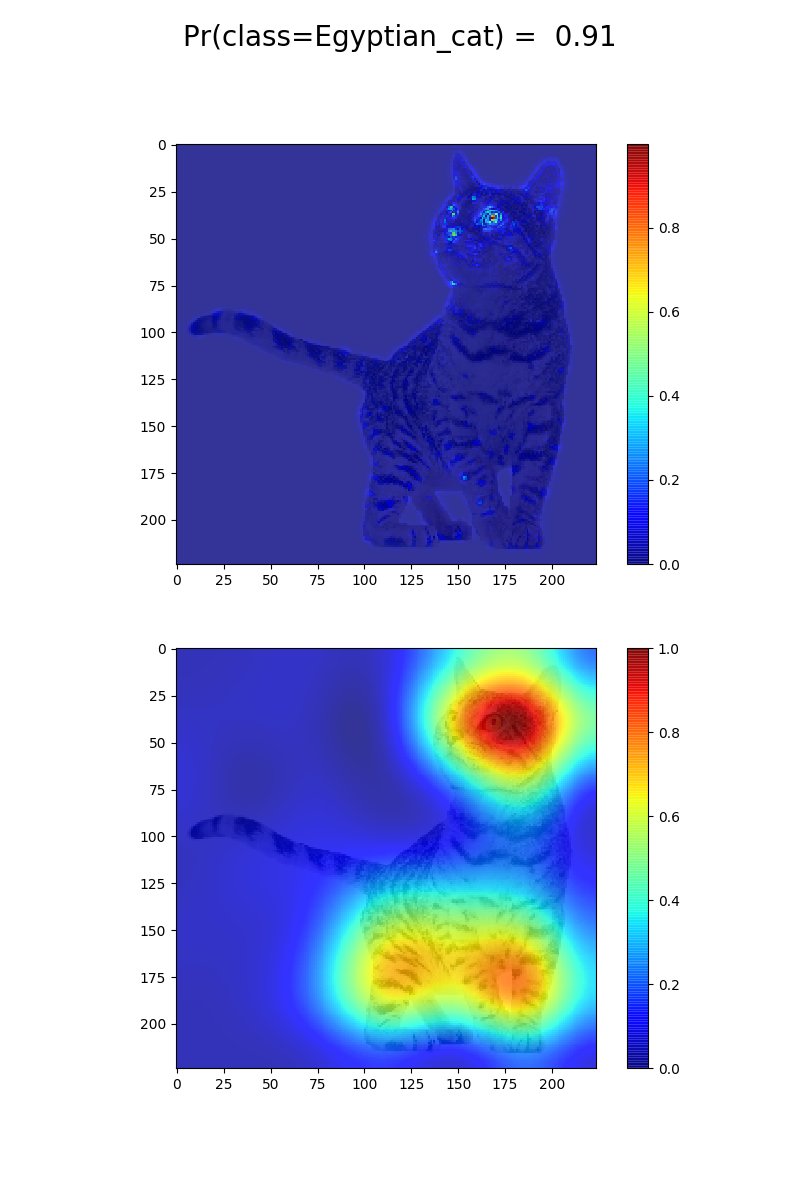
First we saw that the network looked mostly at the face of the dog | First we saw that the network looked mostly at the face of the dog (see the picture below). Then we also saw that the network looked mostly at the face of a cat to classify it. For the cat, the network also used the legs a bit, but mostly the head. We modified our cat image in multiple ways to see how the network would react. | ||
[[File:Dog.jpg|300px]] | [[File:Dog.jpg|300px]] | ||
| Line 136: | Line 136: | ||
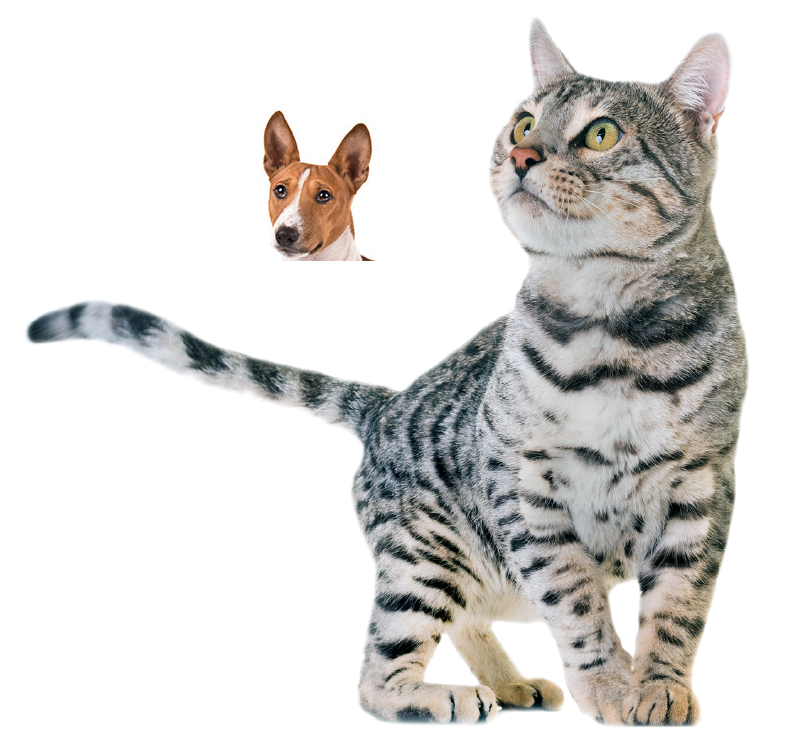
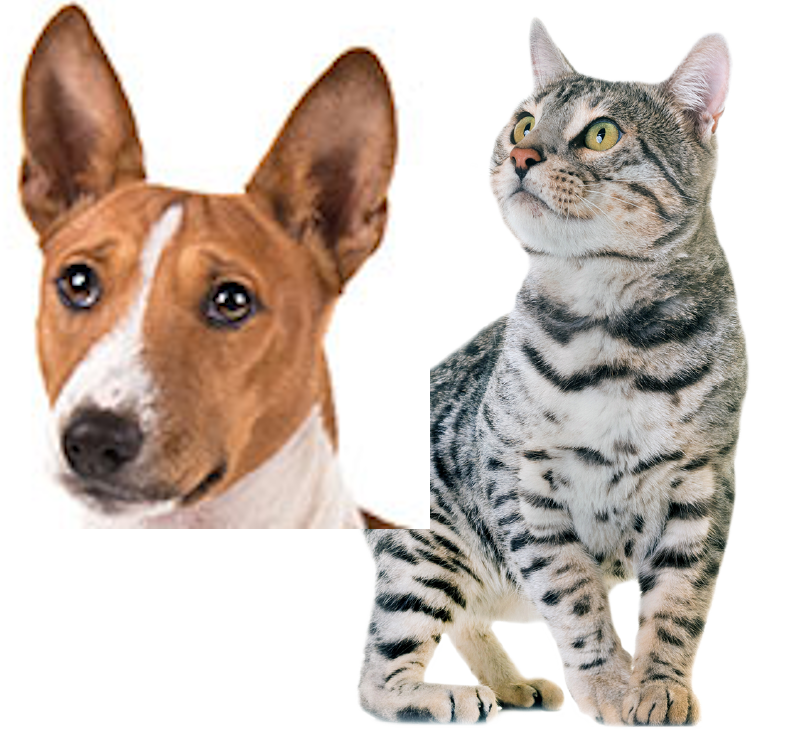
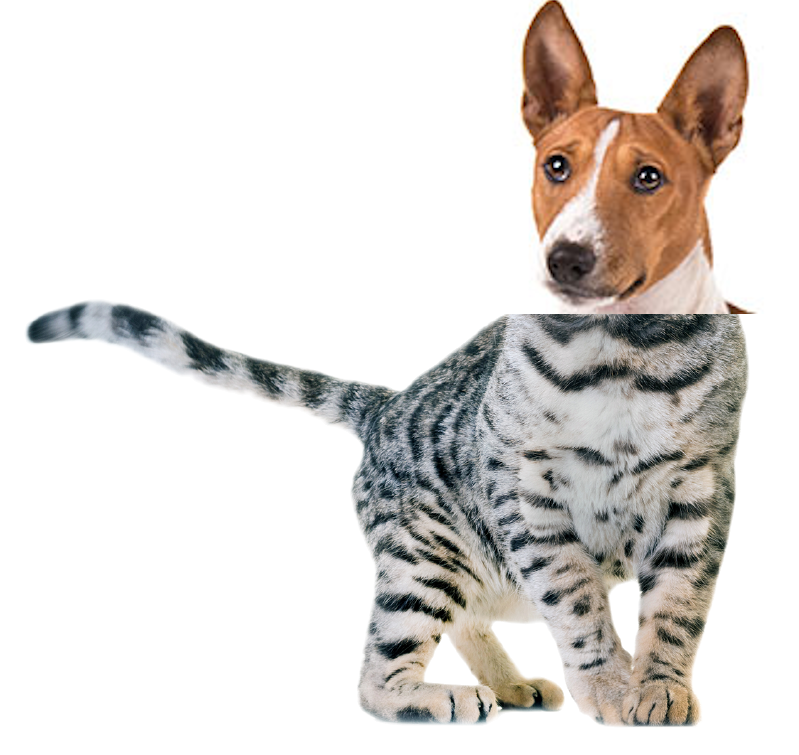
The first modification was putting the dog head over the cat head in the cat image | The first modification was putting the dog head over the cat head in the cat image, the dog head was made roughly the same size. Interestingly enough, the network then thought it was a dog. We did the same but this time we put the dog head over the empty space next to the cat head. This time the network thought it was a cat again. We then increased the size of the dog head and now the network thought it was a dog again. The relevant saliency images can be seen below. | ||
We learned a lot about how the network classifies dogs and cats. We learned that the head counts most to the neural network, not the location. We also learned that if more pixels are covered by something (in our case a dog head), the network values it more than if that same thing (head) is at exactly the same position but smaller. This is an interesting thing to learn about neural networks, that is hard to learn without playing with our tool. | We learned a lot about how the network classifies dogs and cats. We learned that the head counts the most to the neural network, not the location. We also learned that if more pixels are covered by something (in our case a dog head), the network values it more than if that same thing (head) is at exactly the same position but smaller. This is an interesting thing to learn about neural networks, something that is hard to learn without playing with our tool. | ||
Revision as of 13:44, 24 March 2020
Group Members
| Name | Student Number | Study | |
|---|---|---|---|
| Joris Goddijn | 1244648 | Computer Science | j.d.goddijn@student.tue.nl |
| Daniël Verloop | 1263544 | Computer Science | a.c.verloop@student.tue.nl |
| Ka Yip Fung | 1245300 | Computer Science | k.y.fung@student.tue.nl |
| Rik Maas | 1244503 | Computer Science | r.maas@student.tue.nl |
| Jeroen Struijk | 1252070 | Computer Science | j.j.struijk@student.tue.nl |
Problem Statement
Neural Networks are used extensively in a wide variety of fields:
- Large tech companies are using neural networks to analyze and cluster users of their services, this data is then used for targeted advertisement. This advertisement business is one of the most lucrative online business models.
- In health care, neural networks are used for detecting certain diseases, e.g. cancer. Recent studies have shown that neural networks perform well in the detection of lung cancer (Zhou 2002), breast cancer (Karabatak, 2009), and prostate cancer (Djavan, 2002). There are many more examples of researchers using neural networks to detect specific diseases.
- In businesses, neural networks are used to filter job applicants (Qin, 2018) (Van Huynh, 2019). It uses the information of an applicant and information about the job to predict how well the applicant fits the job. This way the business only has to take the best applicants in for interviews and can reduce the amount of manual labour needed.
- Neural networks are also used to detect cracks in the road (Zhang, 2016). Manually keeping track of road conditions is very costly and time consuming. Automated road crack detection makes it a lot easier to maintain roads.
- Neural networks are also able to recognize faces (Sun, 2015). Facial recognition systems based on neural networks are already heavily deployed in China (Kuo, 2019).
- In self driving cars, deep convolutional neural networks are used to parse the visual input of the sensors of the car. This information can be used to steer the car (Bojarski, 2016).
All in all, there are many use cases for neural networks. Research in modern large scale neural networks is very recent. The most promising progress in the field has been made in the last 10 years. The reason for the increase in popularity for neural networks is the increase in available data, because neural networks are only successful when they have a large amount of data to train on. Every day, more data gets produced on a massive scale by people using technology. In the future, more and more data will be created. As time progresses, more industries will be able to start using neural networks.
A big issue of modern neural networks is that it is a black box approach. Experts do not understand what is going on inside the neural network. Neural networks are given input data and are expected to produce output data. They do this extremely well, but what exactly happens in between is largely unknown. This is an issue when people use neural networks to make decisions with real, impactful consequences.
In this project, we will be focusing on convolutional neural networks applied to visual data. We have chosen to focus on neural networks applied on visual data, because currently neural networks have shown the most promising results in the field of image processing. Furthermore, many impactful use cases of neural networks mentioned before, revolve around visual data.
The main problem we are tackling is that many users of convolutional neural networks only see the end decision of the neural network, they do not get an explanation why the neural network gave the output it gave. We think this is a problem because we believe that users can get more use out of their neural networks if it provides more information than just the output of the network.
Objectives
We are going to make a web application in which users can see visualizations of the inner workings of a neural network. We will focus on showing visualizations of the individual layers of a neural network. The goal of our web application is to help users understand how their neural network is making decisions.
Users and what they need
We believe many different users can benefit from using our tool. Our main target user is people who are using convolutional neural networks for the analysis of visual input. Users use neural networks because they provide good results when analysing visual data. What neural networks currently do not provide, is a clear explanation of why they give the outputs that they give. Our users are people that can benefit from seeing images representing the inner works of a neural network.
We name several users and explain how they could use our tool. Note that this list is not extensive since convolutional neural networks are applied in an extremely large variety of situations, by a lot of different users.
- Doctors who are using images to determine whether a patient has a certain type of cancer. Detecting different types of cancer is a different process and requires different skills. We do not have enough domain knowledge to explain the differences between these processes. Detecting different types of cancer is also done by different types of medical experts. We try to provide information that is general enough such that it is useful in all these cases. It is interesting for a doctor to see which exact parts of an image have contributed most to the decision of the neural network. The whole reason for using a neural network is that it is not easy to come up with a decision for all experts based on seeing the input image. If the expert is also supplied with a visualization of which region of the image is the most important part, they should be able to get a better understanding of the reasoning of the neural network.
- Engineers that are developing systems to detect road cracks. These users are different to doctors since we assume the engineers creating these systems have more knowledge about neural networks. Engineers that are creating the neural networks will train several networks and test their performance. In testing the performance of their networks, they might not understand why their network outputs wrong answers at certain times. Our visualizations should help them understand which part of the image is the motivation for their network to provide an output. This could help the engineers come up with pre processing techniques that help the network in this specific area and improve overall performance.
- Governments using facial recognition to observe their citizens. Governments could use facial recognition neural networks to determine who committed a crime. It is very important for the people using the neural network that they can see why certain faces were matched. We think providing these users with images, showing which parts of a face were the reason for the neural network's decision could help them understand why the neural network came to this decision.
These 3 users all share that they are using a convolutional neural network for image analysis. The expertise of the user differs though. Doctors are not expected to know anything about neural networks. The only thing they need to know is to give them an input image and read the output. Engineers working on road crack detection are expected to know more about neural networks because they are designing them for their problem. The amount of information that these two different users are able to obtain using our tool will differ. We will make our tool as easy to use as possible and try to give many clear explanations. However, some types of visualizations are more suited for the advanced user. While other types of visualizations, are better for a user without much knowledge about neural networks. Our aim is to provide a wide toolset which can be beneficial for many different users, potentially more beneficial for one type of user than the other.
Our users require an environment in which the inner workings of a neural network is visualized in an intuitive way such that these inner workings become more understandable. They need to be able to select or upload the dataset and network they are working with. They then need to be able to select different types of visualizations in real time, there should be clear and easily understandable explanations for all the types of visualizations. For the visualizations that are based on an input image, the user needs to be able to upload their own input image.
New detailed Users
Engineers
Engineers creating neural networks for image recognition or image processing in general. They can use our tool to create a better understanding of the strengths and weaknesses of their network and how it works. They can use this knowledge to repeatedly improve their network until it holds a standard that they are satisfied with. The main way users can use our tool to help with this is by looking at important features. The saliency map that our tool shows, indicates very clearly what features the network is focusing on. Knowing these features can help engineers improve their networks in several ways. They can preprocess their test data to show certain features more clearly, they can modify their training dataset and they can also change the entire architecture of their network if their network is incapable of capturing key features even with a lot of data.
We give some examples of how our tools can be used by neural network engineers:
It is interesting to look at the saliency map of a certain class and look at what features the network values. If the data your network is intended to work for does not always have these features, engineers might want to extend the training dataset to make sure other features are also recognised. They could also limit the use of their neural network to only images that have these features.
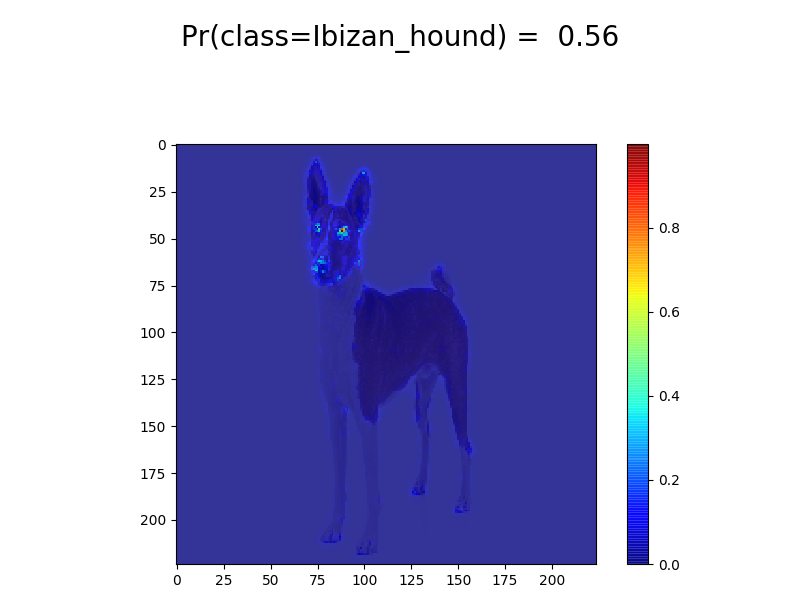
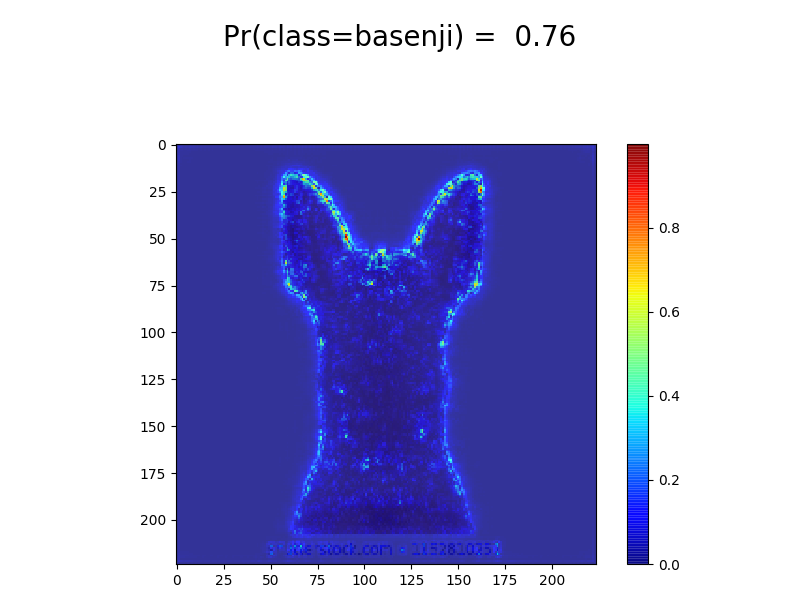
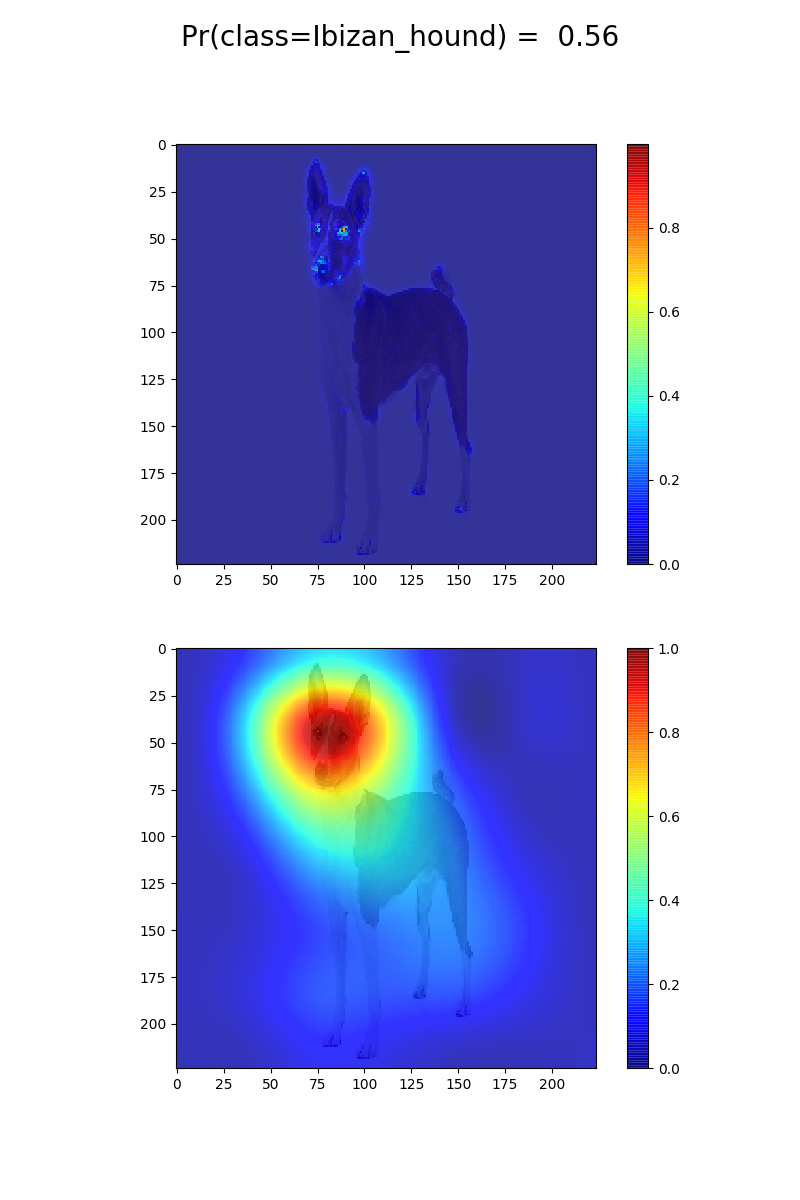
For demonstration purposes, in our current prototype we want to figure out if the network needs the face of a dog to recognize that it is a dog or not. We take a picture of a dog showing its face and body clearly, and a picture of just the back of the head of a dog. The network we use can classify both pictures as dogs (note that ibizan hound and basenji are dog races). We can use our saliency map to see how it does this. Note that on the saliency map of the full dog, a lot of emphasis is put on the eyes and the nose of the dog. On the other hand, the saliency map of the other picture shows that the network only looks at the shape of the dog. This means that the shape of the dog is enough for our network to recognize that it is a dog. We now know that we can use our network to classify dogs as long as an outline of the dog (or the face) is visible.
Another thing to notice from this demonstration, is that our network is not good at classifying the race of dogs. In both cases it has misclassified the race of the dog. This tells us that if we want our network to be able to distinguish between different dog races we need to train it on more dog specific datasets.
Yet another thing that engineers may want to take into account is how biased their data is. Here we'll try to show how colors affect the prediction of the network.
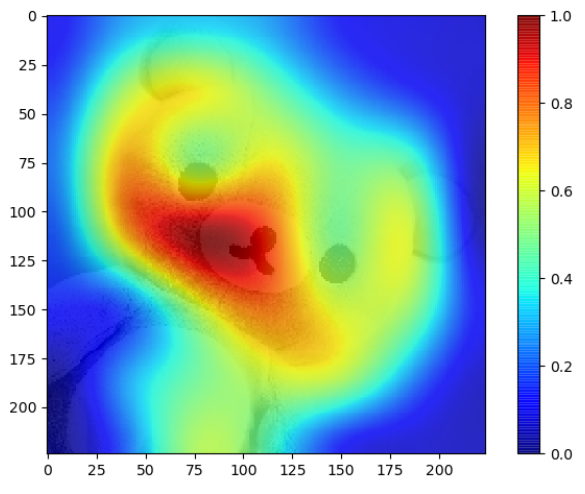
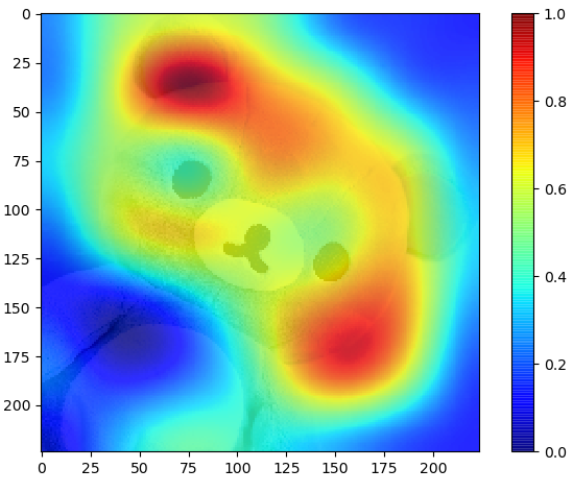
First, we have a teddy bear without filters. We can see that the network is very certain of its prediction. What happens if we apply a black-white filter on the image? We can see that the certainty of the prediction drops quite a bit. It gets even worse when we apply a blue filter on the image. Now the prediction is completely wrong, the network predicts a piggy bank (although, it's far from confident).
Why is the network performing worse? An explanation may be that teddy bears usually have similar colors (beige/brown), so when a network is trained on these kind of colors, it will be less certain when you feed it an uncommon bear color. So it seems that there is actually a small bias in the training data. This is something that should be kept in mind when designing your own network.
On the second map, we can see that the network takes the ear into account whereas on the first map, the ears are not that important. You would think that by taking the ears into account, the network could make a better prediction but it seems like the opposite is the case. On the third map, the blue filter seems sufficient to entirely throw off the network. We can see that the mouth, nose and eyes are no longer the most important parts for the decision making of the network. Instead, there is a shift to the ears which might be an explanation as to why the network predicts a piggy bank as these usually have similarly shaped ears. Especially the last example makes it clear why visualizing the prediction of a Neural Network is very helpful: without visualization it would be difficult to explain why the network would predict a piggy bank.
Students
Students learning about convolutional neural networks in any setting can also benefit greatly from using our tool. Most courses focus on understanding how to implement neural networks and how the mathematics behind them work. Usually there is also practical work involved: trying to code a neural network and train and evaluate it on given data. Our tool would complement such a course by letting students play around with the network. Our tool can be used to understand more intuitively how the network operates. Below, we give an example of how we learned more about a network in our prototype tool.
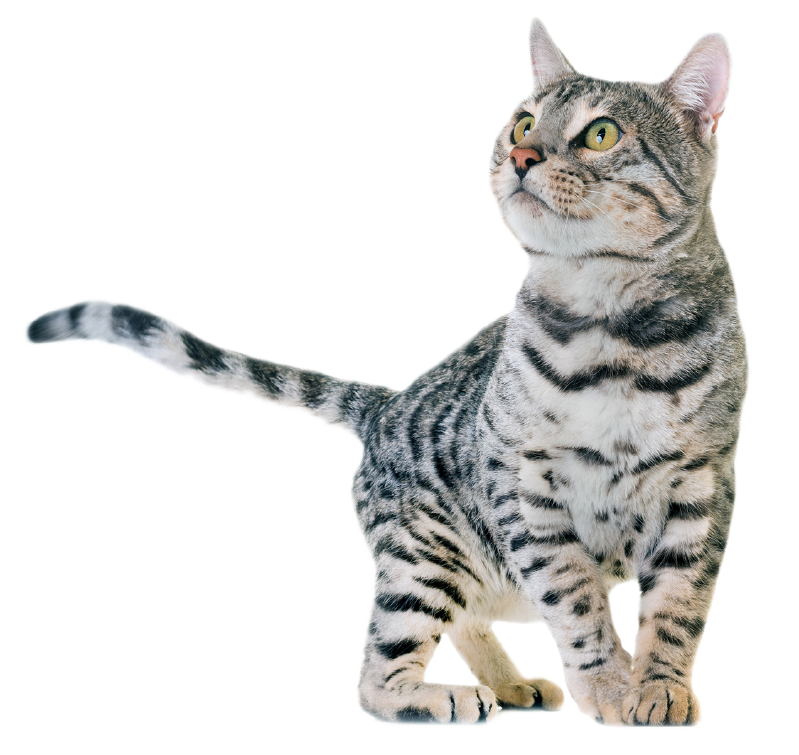
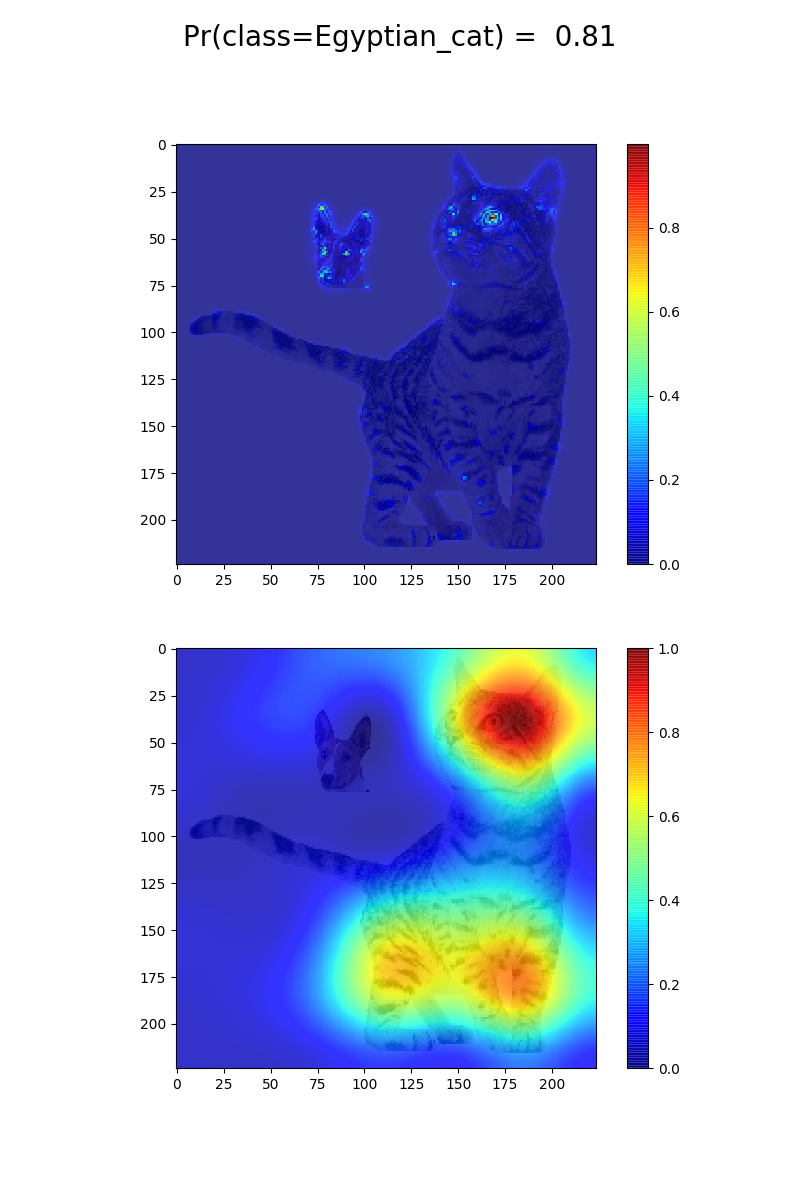
First we saw that the network looked mostly at the face of the dog (see the picture below). Then we also saw that the network looked mostly at the face of a cat to classify it. For the cat, the network also used the legs a bit, but mostly the head. We modified our cat image in multiple ways to see how the network would react.
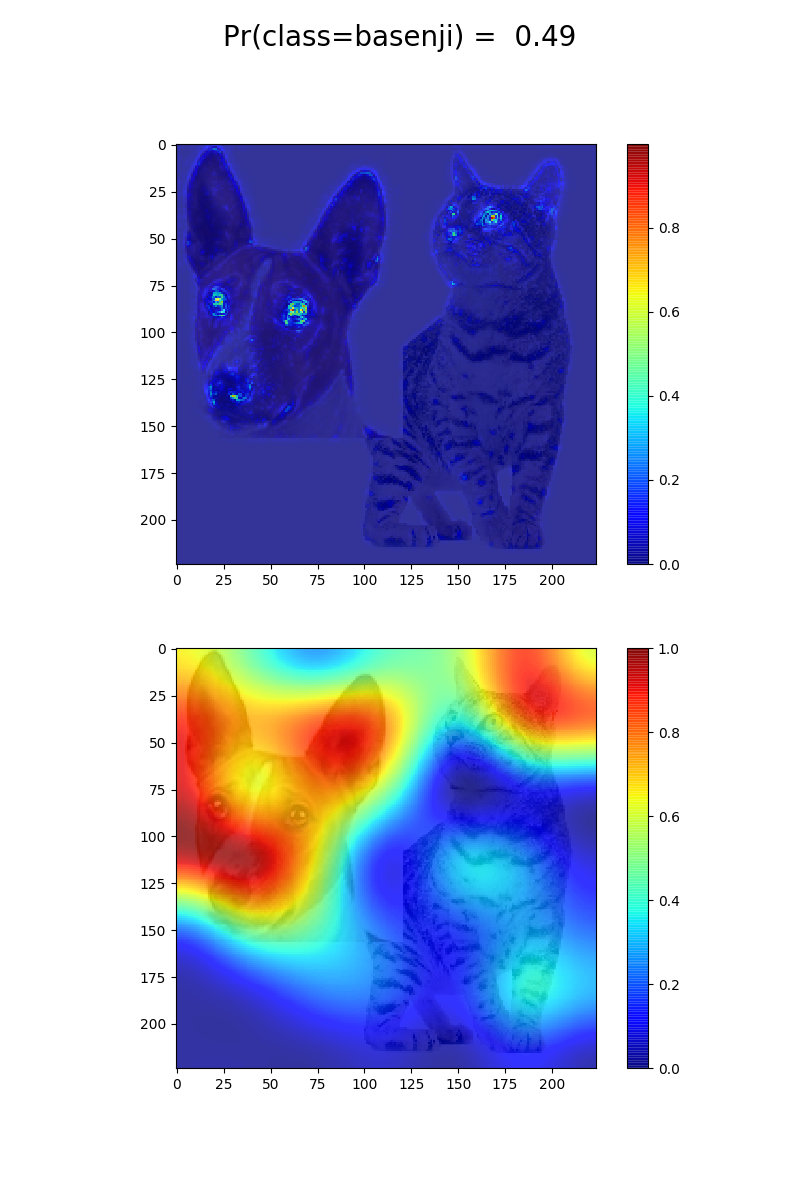
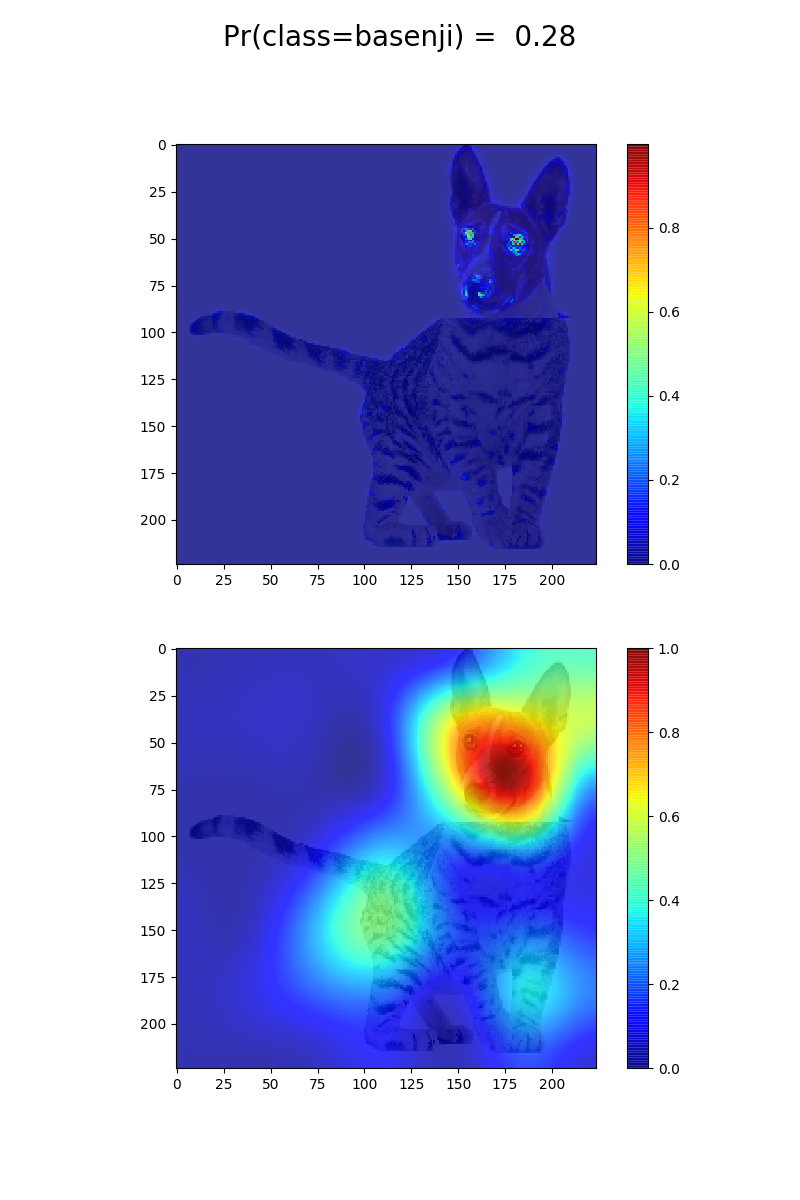
The first modification was putting the dog head over the cat head in the cat image, the dog head was made roughly the same size. Interestingly enough, the network then thought it was a dog. We did the same but this time we put the dog head over the empty space next to the cat head. This time the network thought it was a cat again. We then increased the size of the dog head and now the network thought it was a dog again. The relevant saliency images can be seen below.
We learned a lot about how the network classifies dogs and cats. We learned that the head counts the most to the neural network, not the location. We also learned that if more pixels are covered by something (in our case a dog head), the network values it more than if that same thing (head) is at exactly the same position but smaller. This is an interesting thing to learn about neural networks, something that is hard to learn without playing with our tool.
Saliency Mapping
Approach
We will use a website where we can visualize the activation of the layers in the neural network by uploading a picture/file. Based on the neural net, the website runs a forward pass on a trained network. This yields a layer activation which is returned to the user to gain information on how the neural net detect these objects.
The user will only have to select which network and dataset they want to understand. We then show visualizations and explanations. This happens on the front-end of our website. In the back-end we handle the requests and compute and create the actual visualizations which we then send back to the front-end to show the user.
We will need both front-end and back-end development.
Programming languages Front-end: Bootstrap and Vue
- Bootstrap with less. (CSS framework)
- Vue (Front-end javascript framework)
Back-end: Django and Keras.
- Network structures saved on the server-side. (Keras/python)
- Our own datasets on the server available to the user.
- Django (Back-end python framework)
Deliverables and Milestones
Week 3: Have a working website with at least 1 visualization.
- Functional front-end that has implemented the basic functionality needed for finalizing this project.
- Back-end must have a general framework for supporting several different networks/datasets.
- One visualization must be functional to the user.
Week 7/8: Website ready for deployment, finish the project.
- Extending our visualizations with choices for several working datasets/networks.
If time allows, we want to make it possible to the user to construct his own networks for simple neural network tasks.
We want to deliver a website that is finished and user friendly. Using the site, users are able to get a better understanding of the inner workings of a convolutional neural network. This is done through visualizing the computations and transformations on the input data. Wherever necessary, we will add text to further explain the visualizations to the user.
State of the Art
Examples of existing playground where one can visualize Neural Networks:
The following pages explore ways to visualize Neural Networks:
- http://cs231n.github.io/understanding-cnn/
- http://yosinski.com/deepvis
- https://distill.pub/2017/feature-visualization
Additionally, we have a lot of sources in the references paragraph along with a summary of each source, showing what has already been done (or could be done) in this field.
Task Division
For now, we have decided that Jeroen and Rik will take care of the back-end, Ka Yip and Daniël take care of the front-end and Joris will work on both (where necessary). We need a better overview of the tasks that have to be done before we can decide on a precise task division.
NOTE: Click an image to view in full quality because Wiki ruins the resolution.
Introduction Page
Introduction page of the website.
This is the first page that the user will see when opening the website. From this page, the user can proceed to the home page.
Home Page
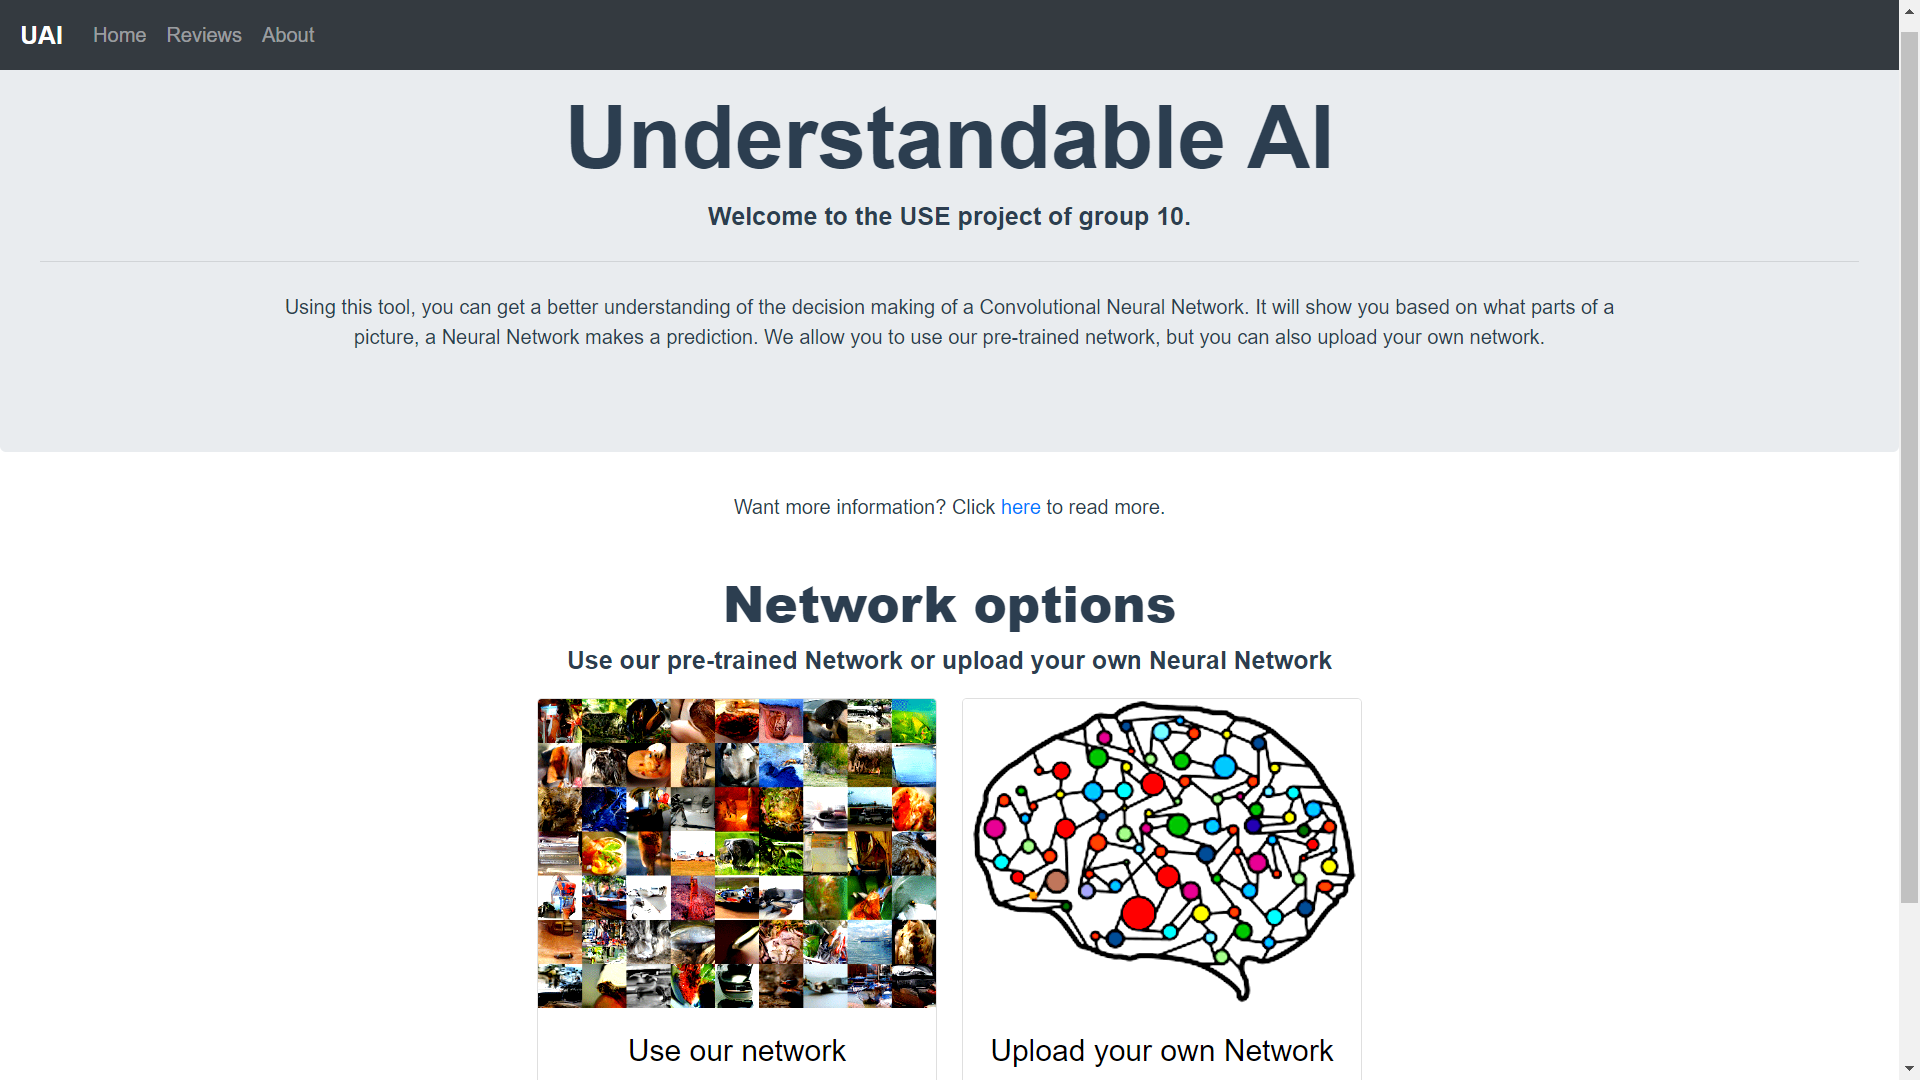
The home page is divided in 2 parts. In the first part, a description on the functionality of the tool is given. If the user wants to read more, he can click on the blue ‘here’ button. Then the explanation will expand and more information will be given: e.g. what (Convolutional) Neural Networks are, how the tool can be used and the target user.
In the second part, a few datasets are presented. The user can choose a dataset to visualize by clicking on the card of the dataset. Currently, only 1 dataset (ImageNet) is supported. ImageNet is an image database organized according to the WorldNet hierarchy (currently only the nouns), in which each node of the hierarchy is depicted by hundreds of thousands of images. When choosing the dataset, the user will enter the visualization page.
Visualization Page
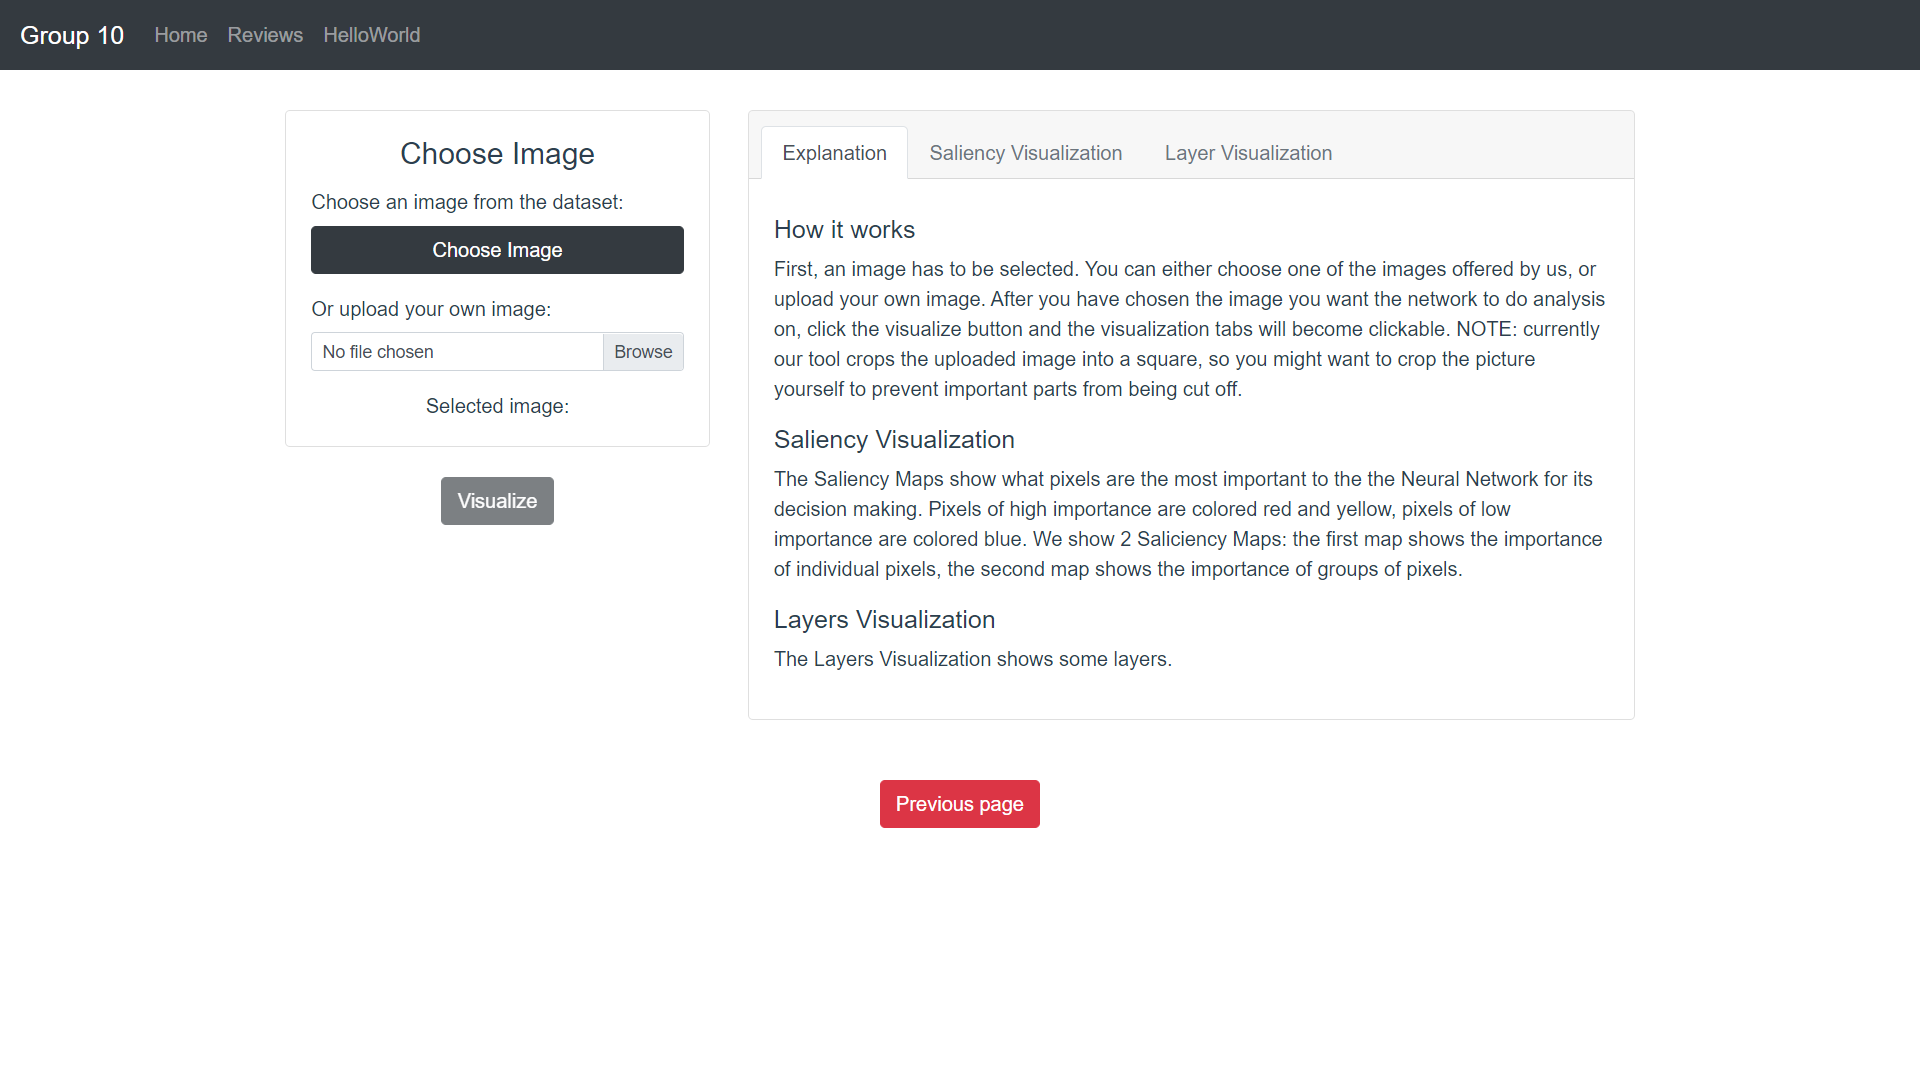
The visualization page when no image has been uploaded yet.
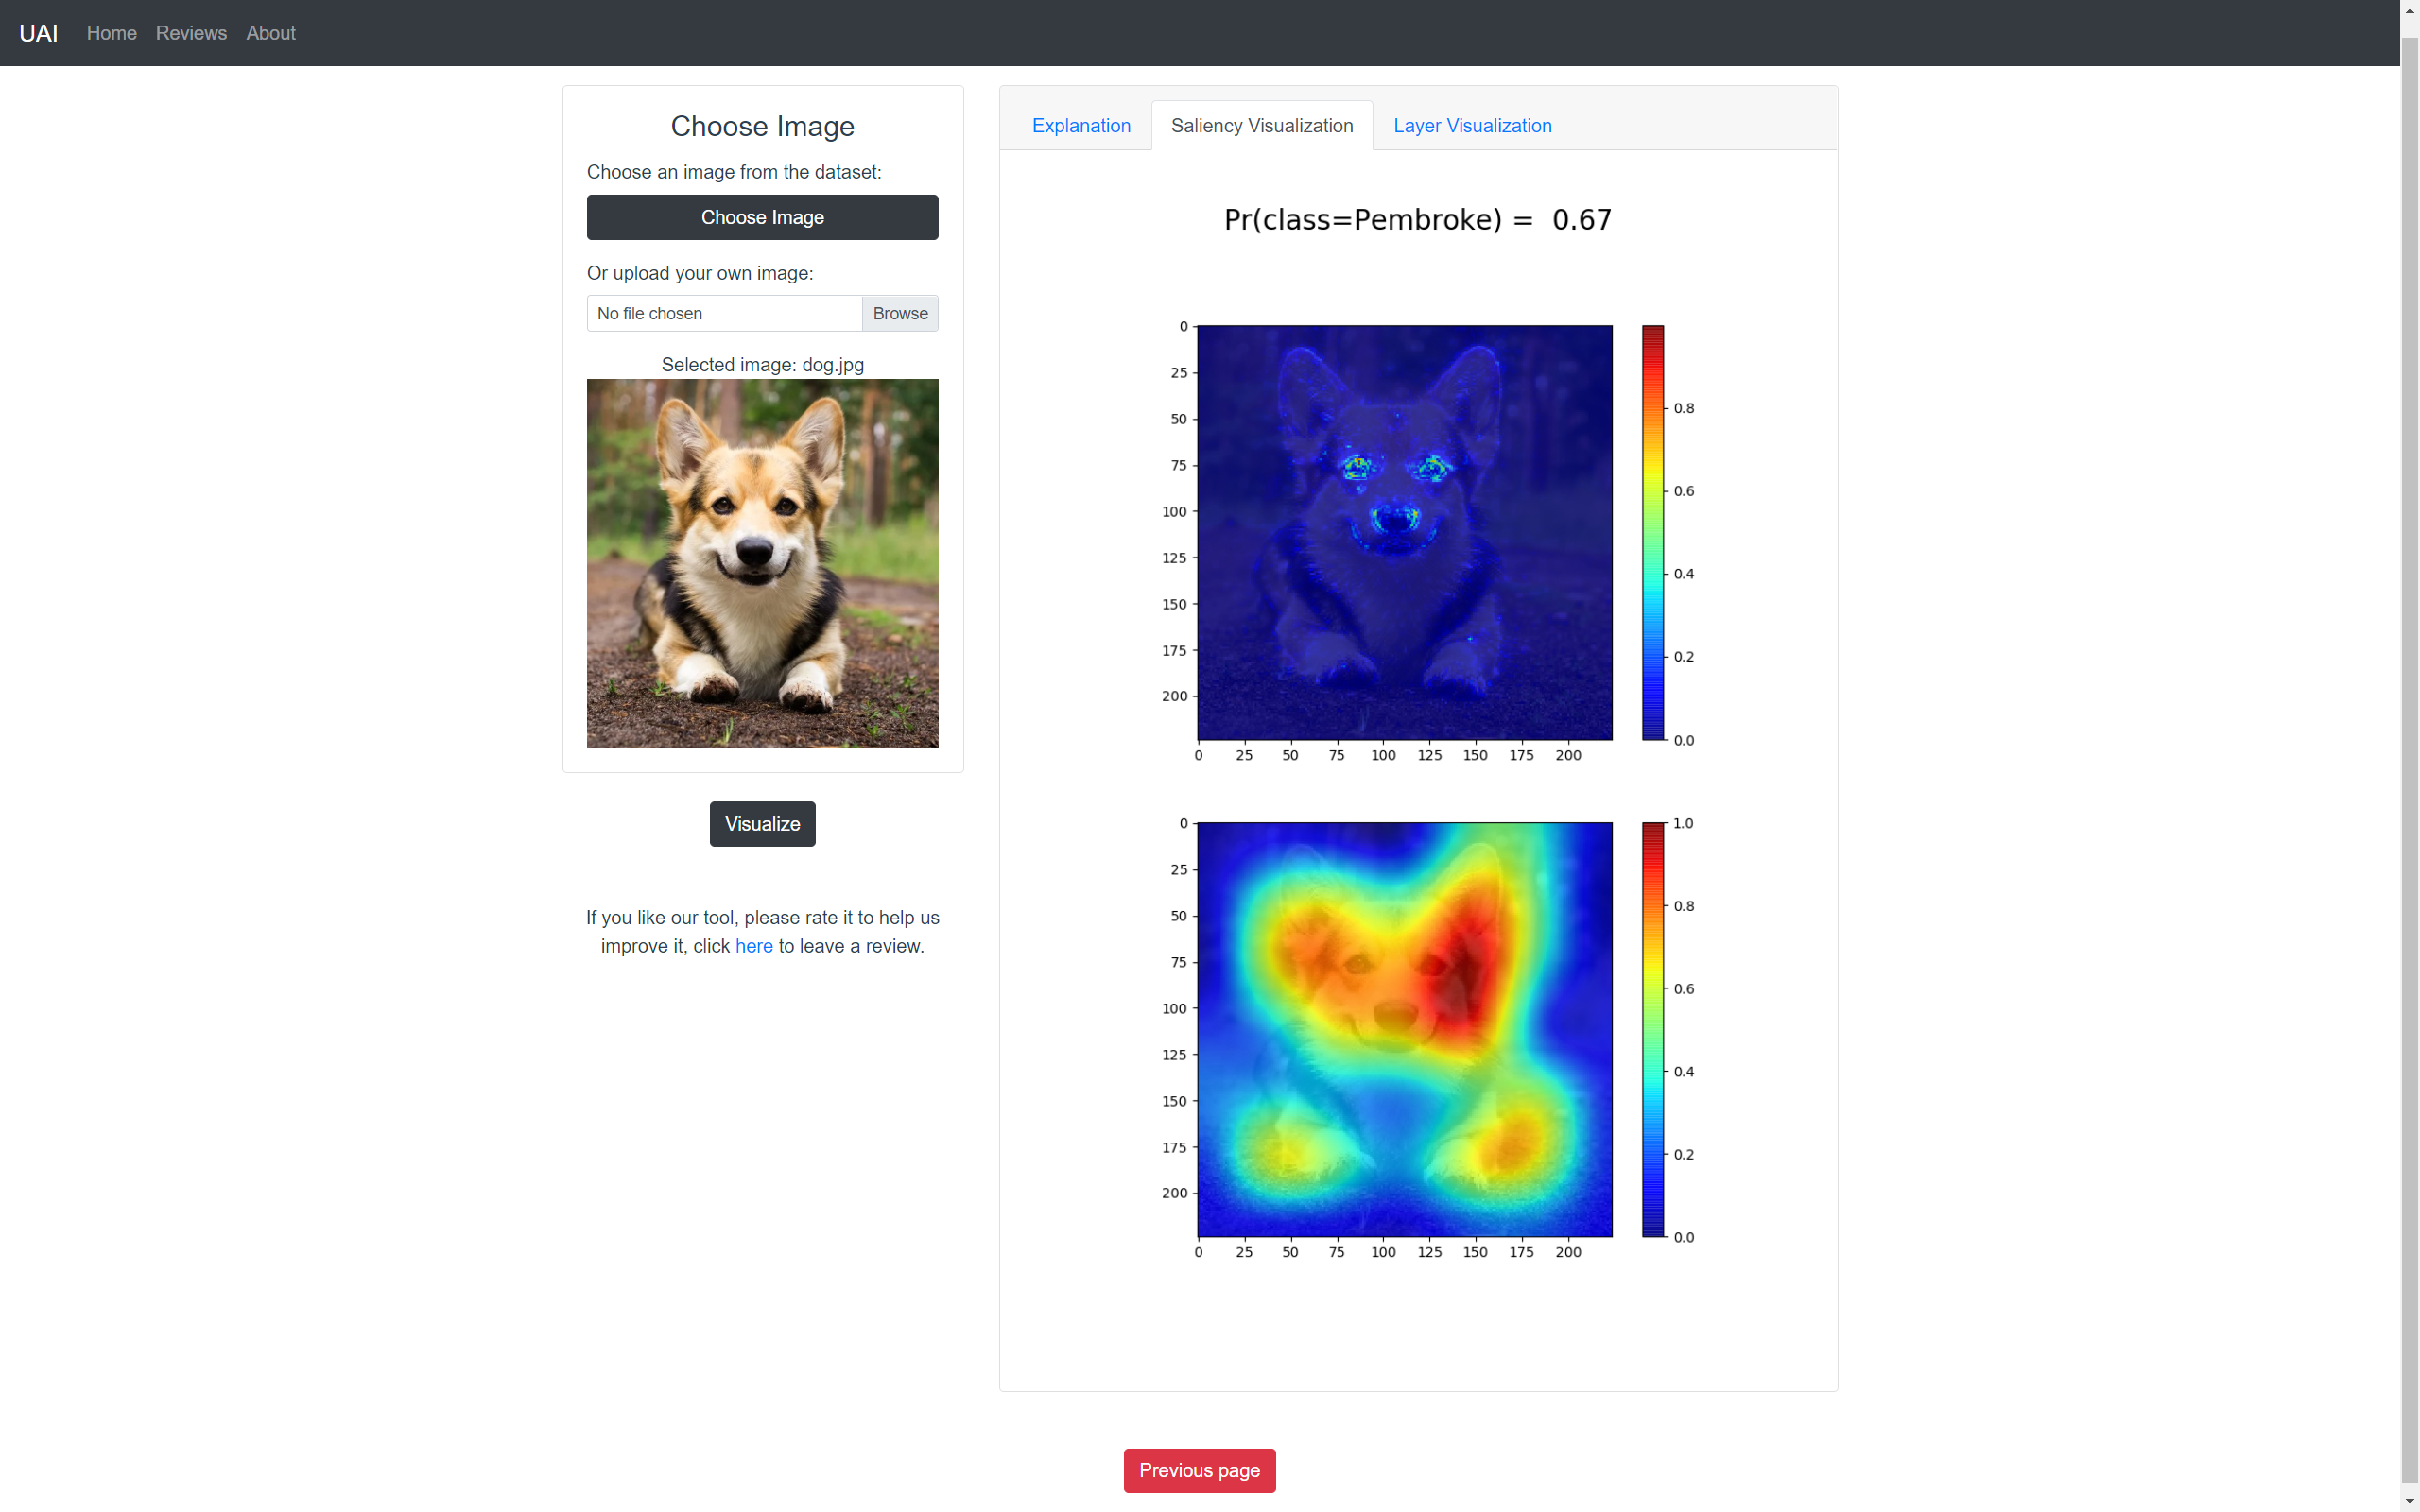
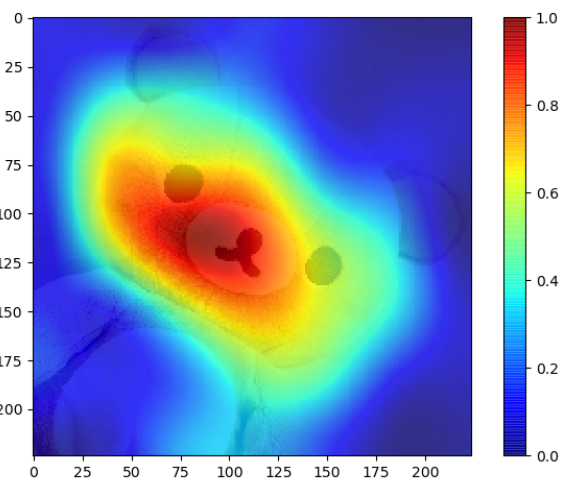
The Saliciency Map on the visualization page.
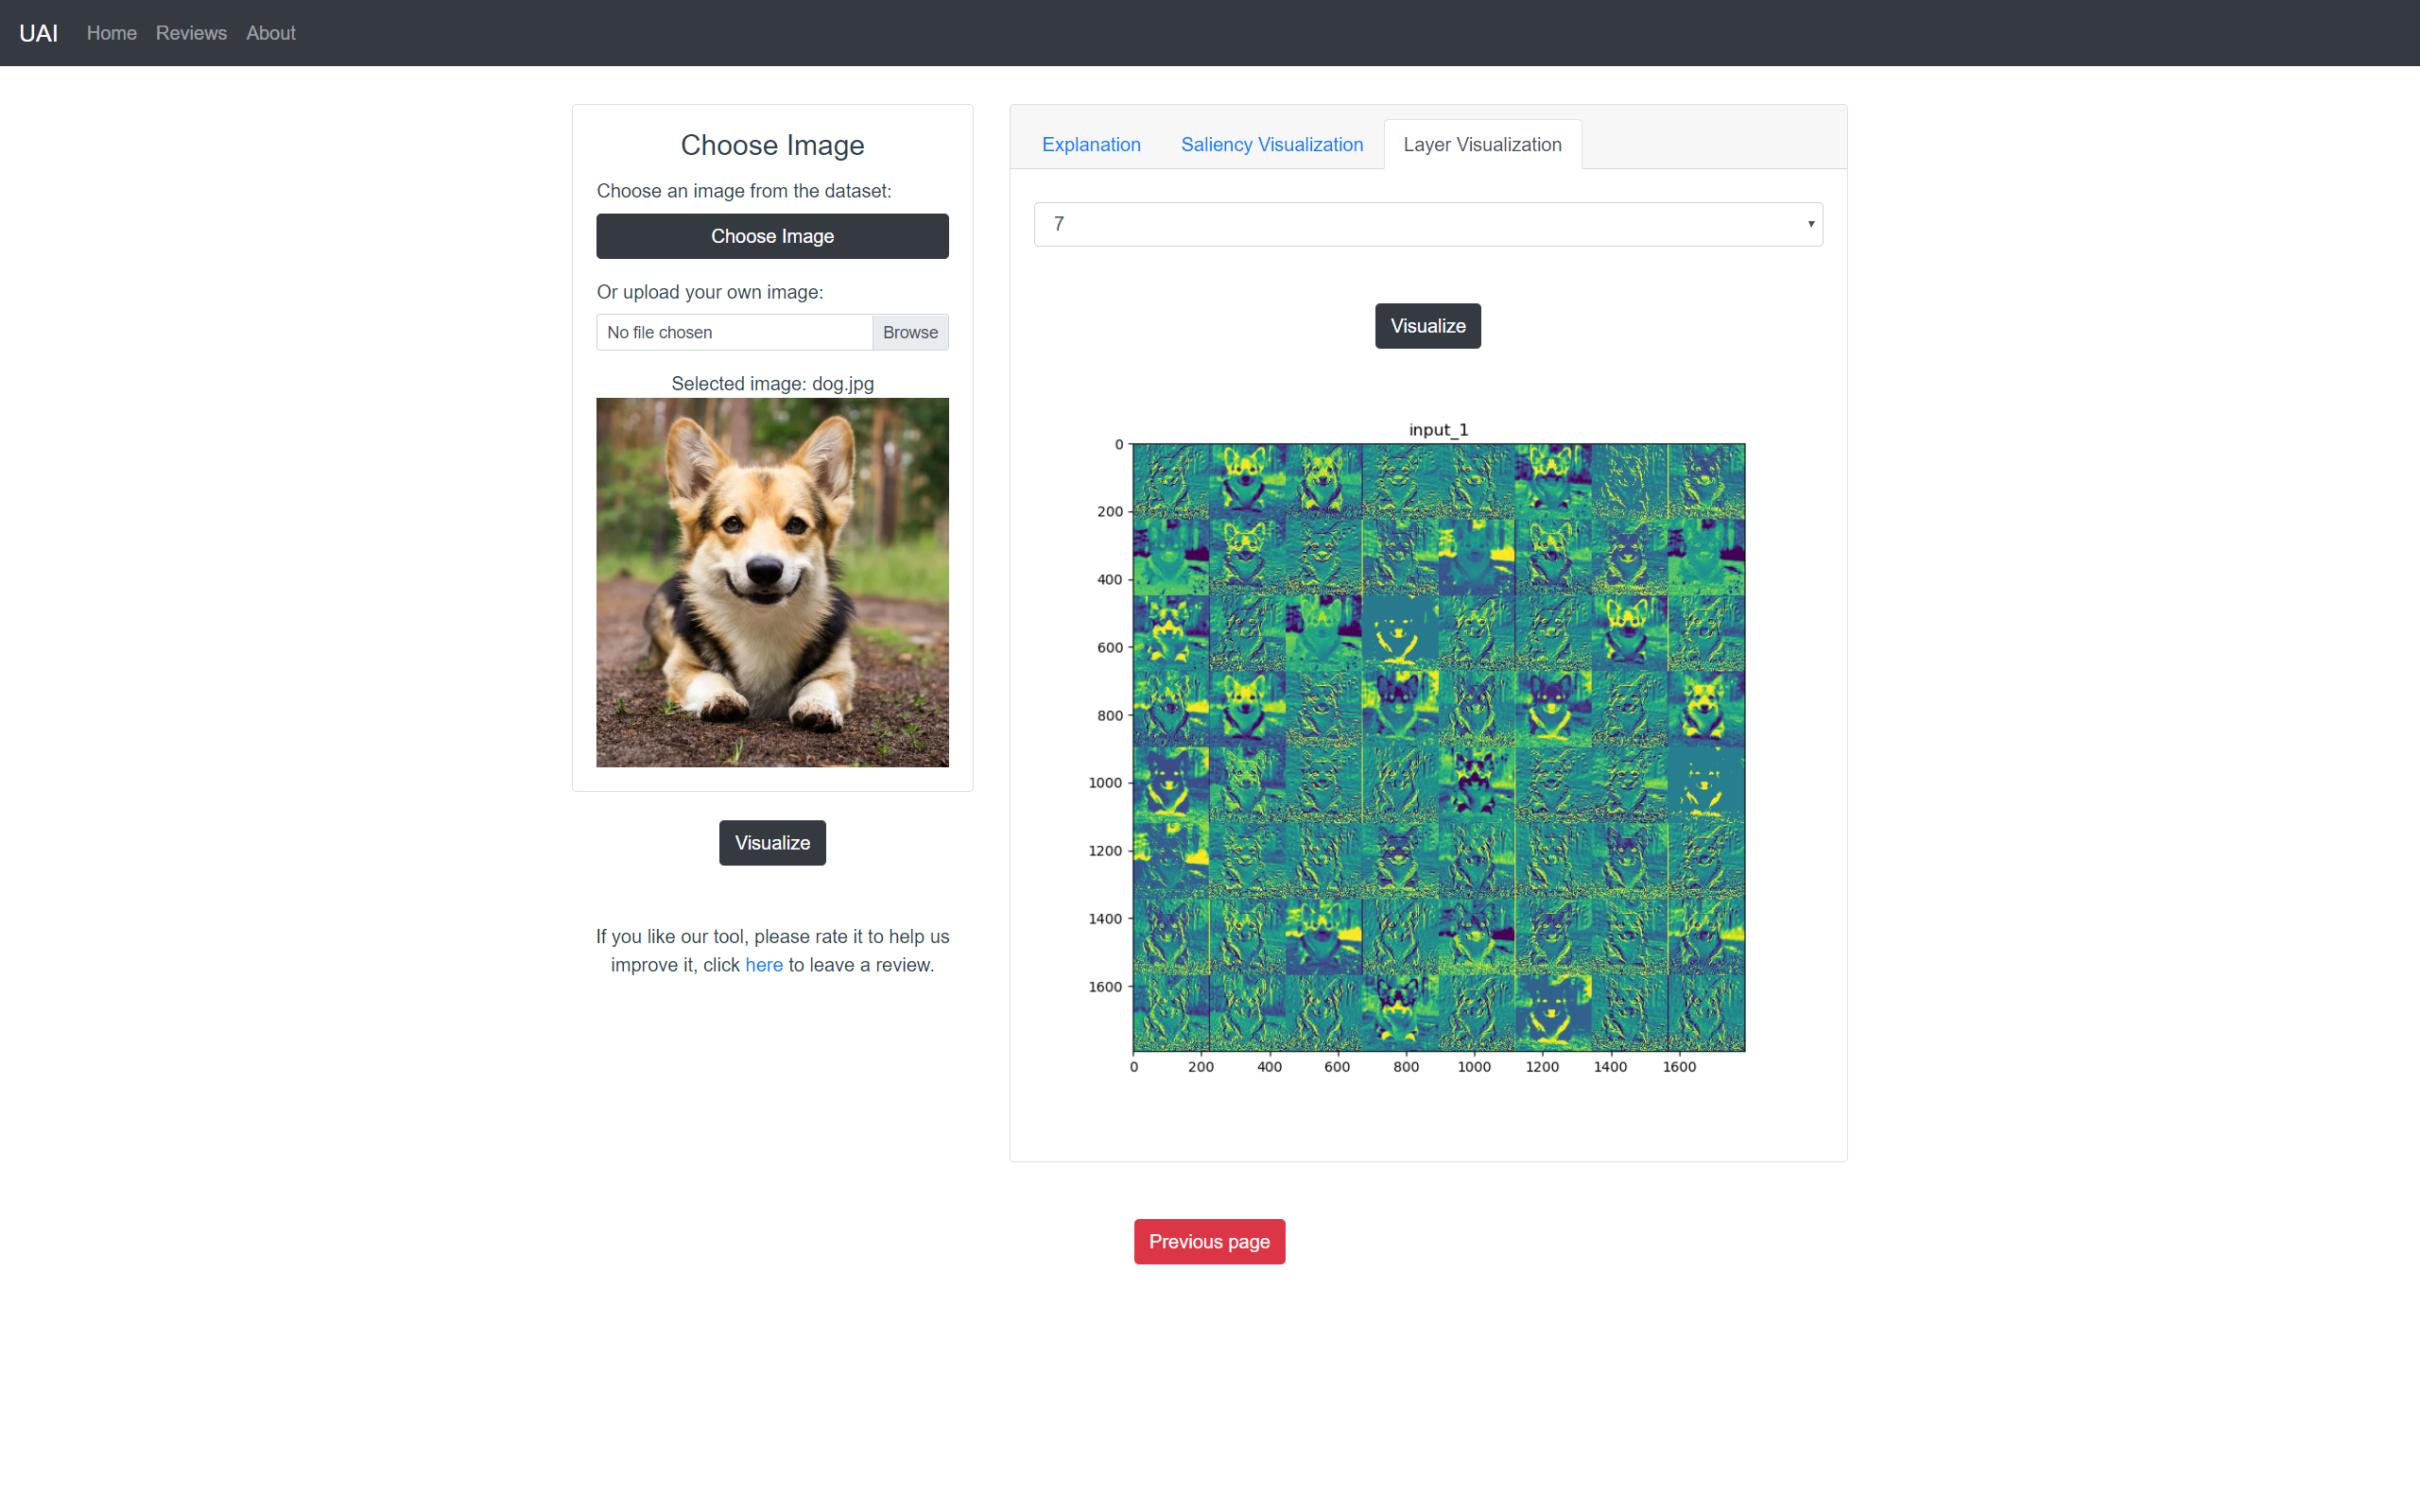
The Layer Visualization on the visualization page.
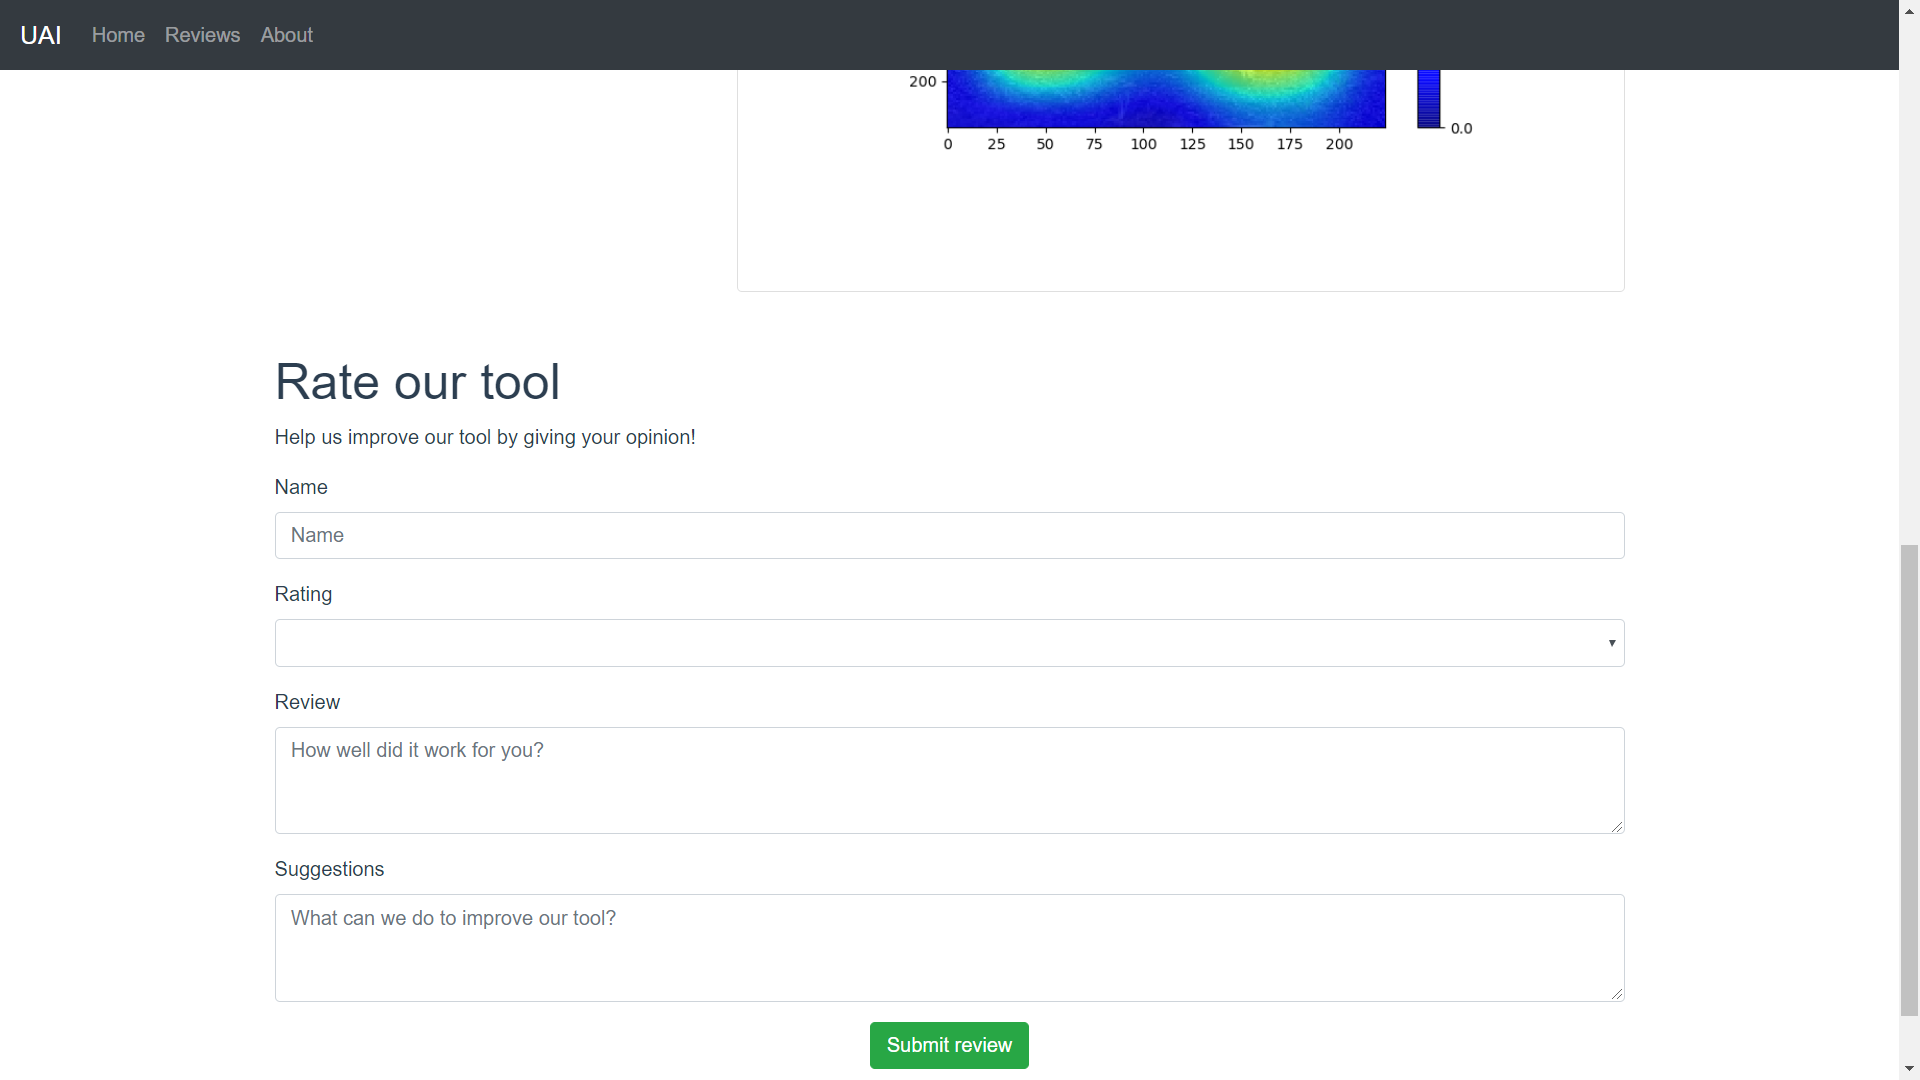
The review form that appears after the user has chosen an image to process.
The visualization page is also divided in 2 parts. On the left part, the user can choose an image to upload, the Neural Network will then run and try to predict what the object is on the uploaded image. For uploading, the user has 2 options: pick an image from our database by clicking ‘choose image’ or upload his own image by clicking ‘browse’. After picking an image, the ‘visualize’ button should be clicked. Then the network starts doing its work. On the right part, explanations of how the tool works and the visualizations themselves are given. After the user has clicked on ‘visualize’, the Saliciency Visualization and Layer visualization tabs become clickable. Clicking on the tabs show the respective visualizations, the Saliciency visualization also shows the prediction of the network. The Layer visualization show different layers which can be chosen by the user using the dropdown menu.
Additionally, after the user has chosen an image to process, a blue ‘here’ button will appear allowing the user to leave a review of the tool. The user can leave a rating , tell us about his opinion and possibly make suggestions. Clicking on the ‘submit’ button will send the review to our database.
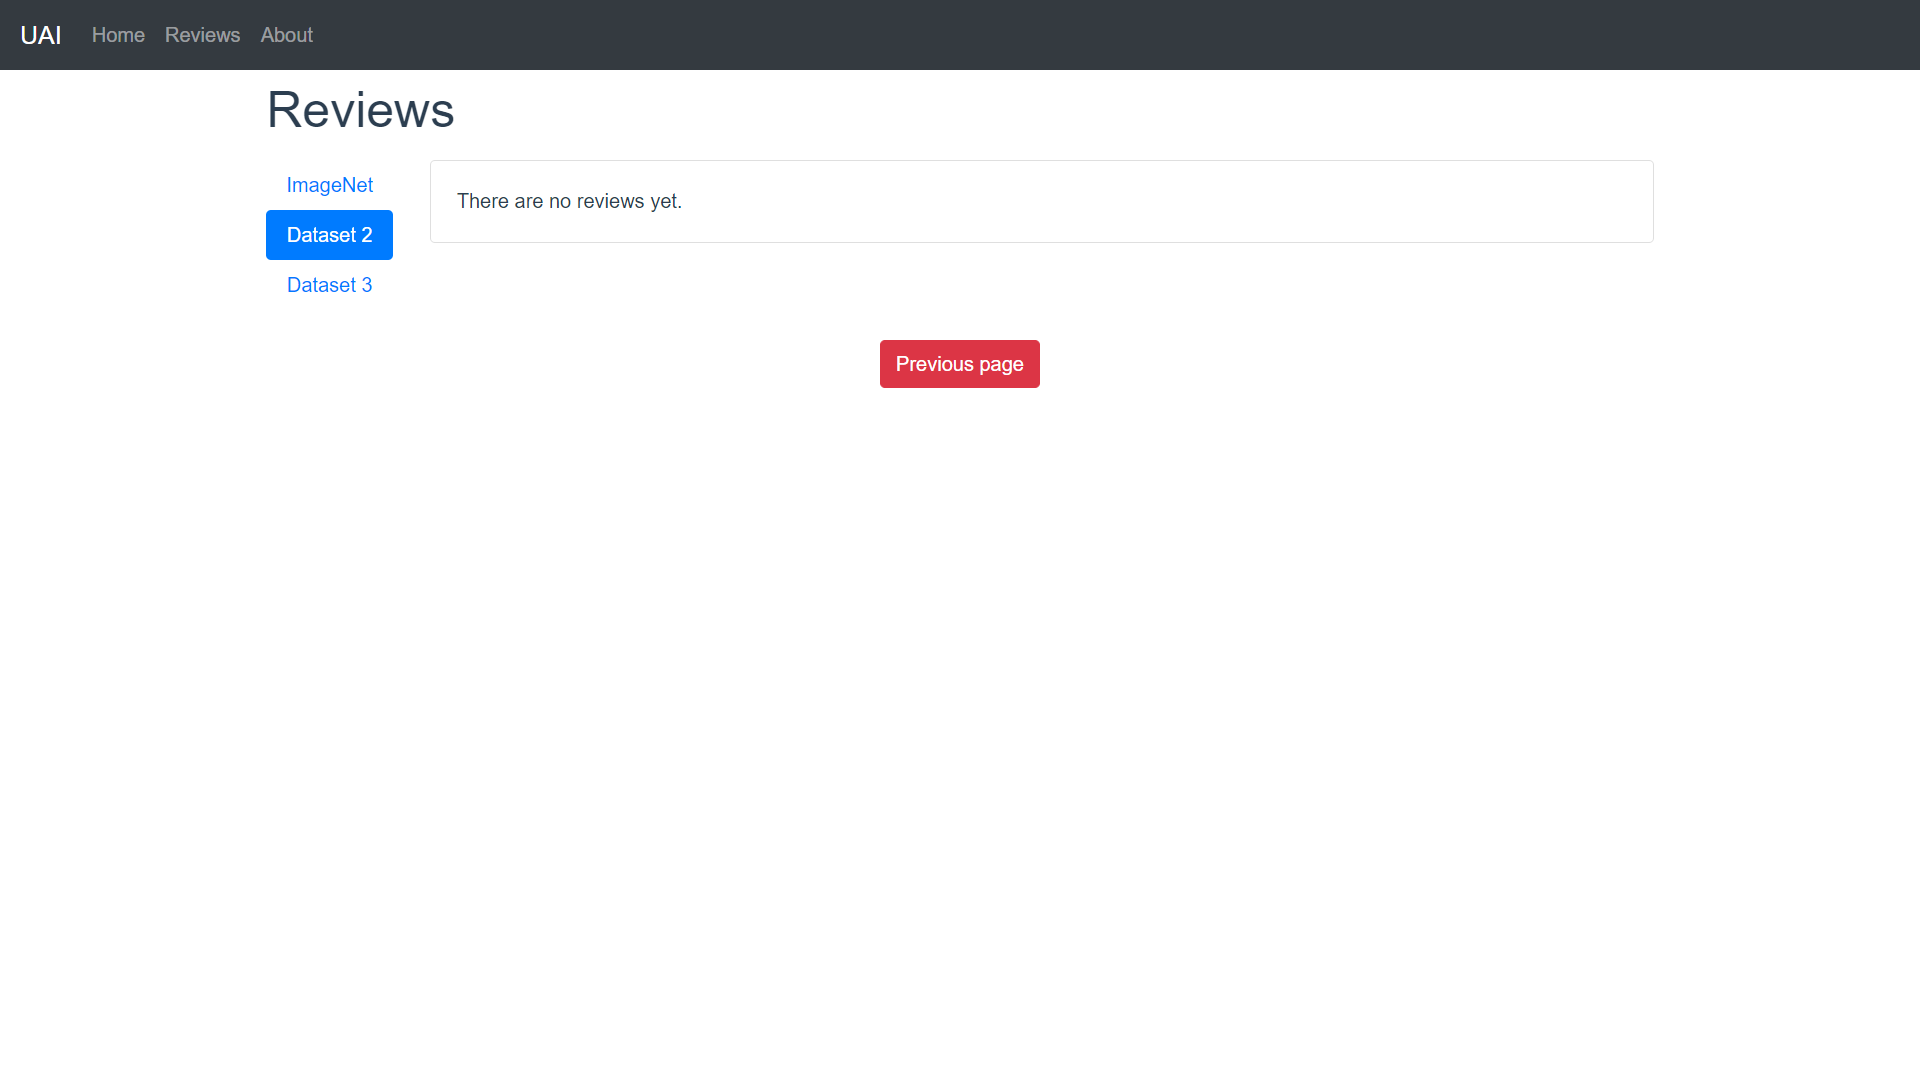
Reviews Page
This page is pretty self-explanatory: the reviews for each dataset are shown.
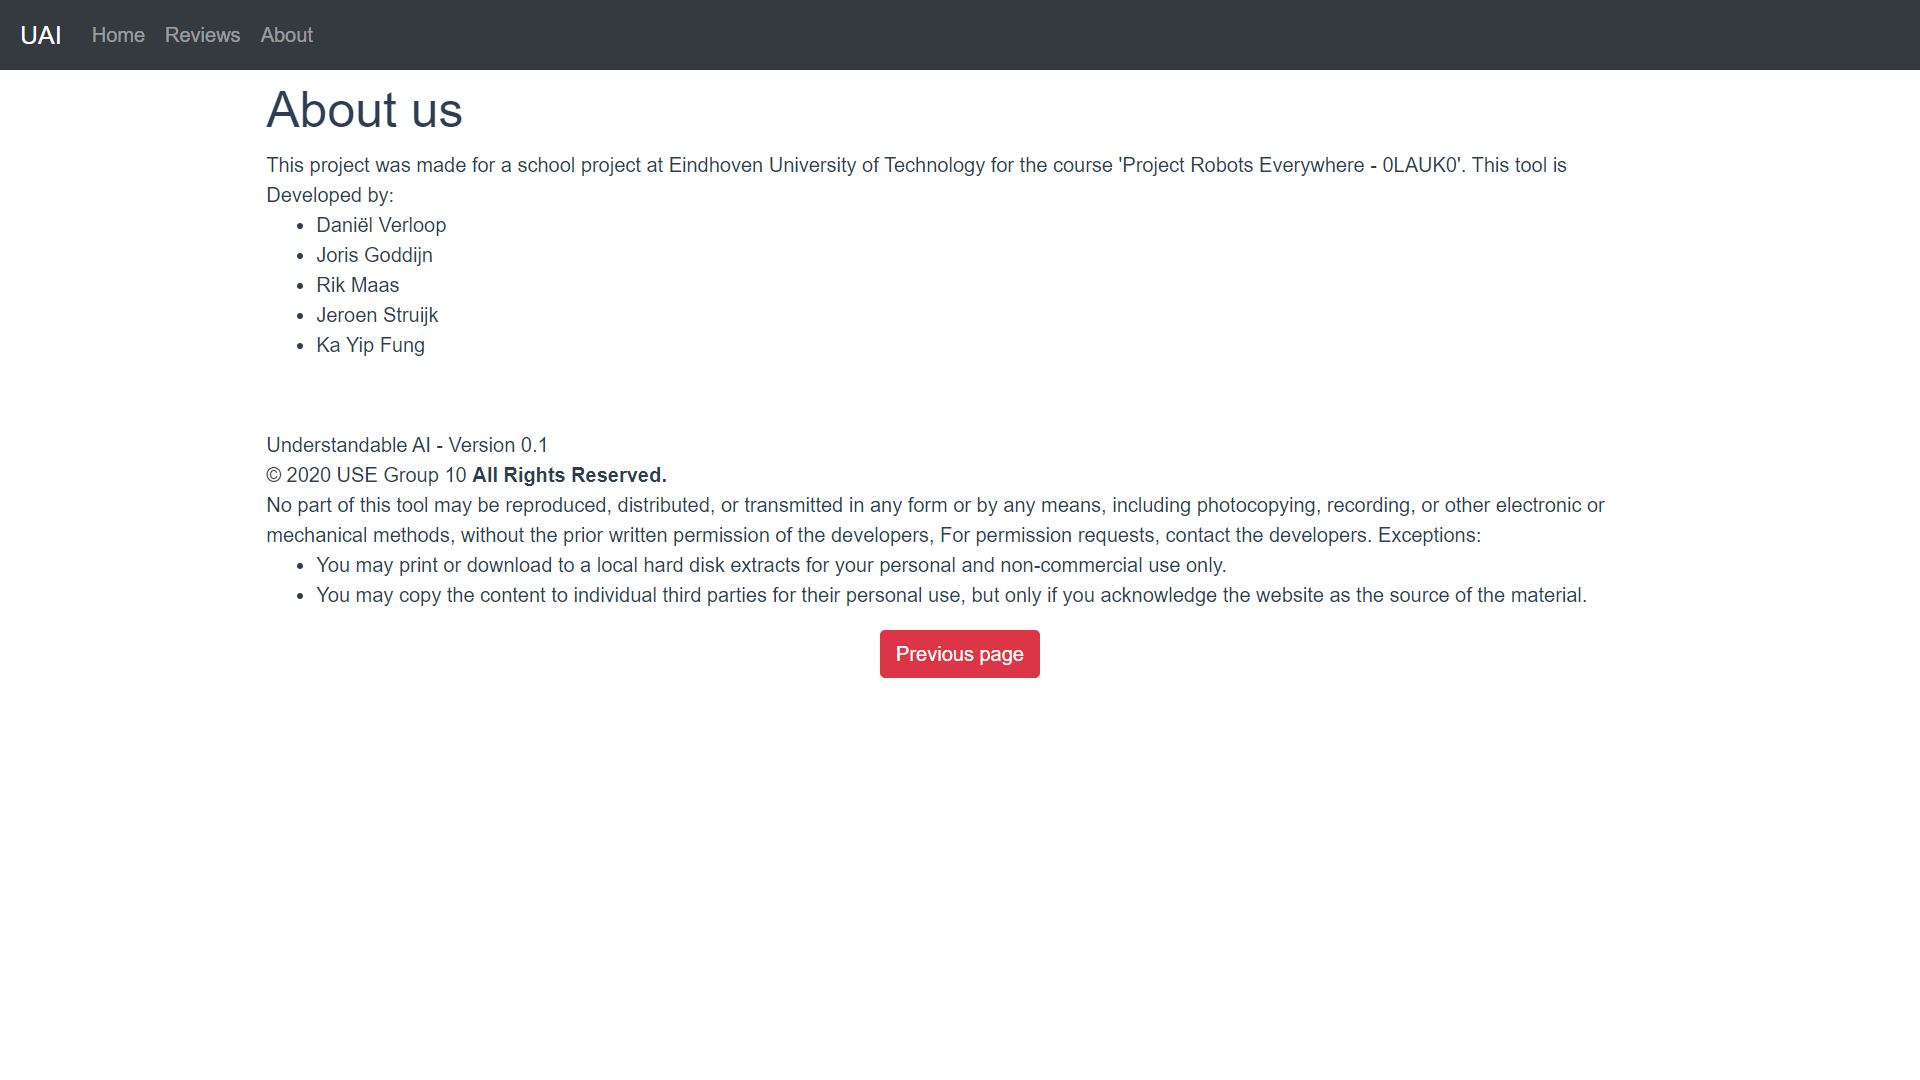
About Page
This page shows more information about the developers of the project and a disclaimer & copyright.
Design Decisions
Navigating from page to page is done using the navigation bar, which is shown at the very top of every page (except for the title page). We chose a horizontal navigation bar at the top because we think this is the easiest way for the user to easily switch to the different pages: Home, Reviews and About. Furthermore, all pages (except for the title page) have a red 'go back' button at the bottom of the page.
All navigation elements have a zooming animation when hovered over.
On the home page, we have decided to use cards in a grid layout because we think this makes it easy to see which datasets are available at a glance. Putting everything below each other would require the user to scroll down which we think is unnecessary. Cards are useful to our purpose because it shows exactly everything that we need it to show: The title of the dataset, a brief explanation of the dataset and an image. They also play nice with the zoom effect, synergizes well with the grid layout and are visually pleasing.
On the visualization page, we also used a grid layout with cards. On the left card, the user can upload the image. On the right card, we have a tab layout within the card. We could have put the explanation and the 2 visualizations below each order, but that would again require that the users scrolls up and down when he wants to switch visualizations. With a tab layout, the user can just click on the appropriate tab, which is more convenient. The visualizations page also lets the user leave a review after he’s done so he doesn’t have to go to the reviews page to leave a review. This is easier for the user because he does not have to remember which dataset he used as the system will automatically fill that in. The suggestion of leaving a review is designed to be minimal and not obnoxiously in your face.
References
Krizhevsky, A., Sutskever, I., & Hinton, G. E. (2012). Imagenet classification with deep convolutional neural networks. In Advances in neural information processing systems (pp. 1097-1105).
Summary: AlexNet. First attempt at using CNNs for image classification for the imagenet competition. Broke the world record. Relatively small neural network used.
Simonyan, K., & Zisserman, A. (2014). Very deep convolutional networks for large-scale image recognition. arXiv preprint arXiv:1409.1556.
Summary: VGGNet. A later larger CNN that again broke the record on the imagenet competition. Very deep architecture with many convolutional layers and pooling layers. Power from size.
He, K., Zhang, X., Ren, S., & Sun, J. (2016). Deep residual learning for image recognition. In Proceedings of the IEEE conference on computer vision and pattern recognition (pp. 770-778).
Summary: ResNet. New neural network that won the imagenet competition again. The idea behind ResNet was to propagate gradients by having ‘jumps’ in the network. A start to thinking about how neural networks work and what its bottlenecks are and how to develop those aspects.
Maaten, L. V. D., & Hinton, G. (2008). Visualizing data using t-SNE. Journal of machine learning research, 9(Nov), 2579-2605.
Summary: This paper presents a method of visualizing a high feature space in 2D. This can be useful for analysing and visualising a dataset the dataset on which a neural network is training.
Simonyan, K., Vedaldi, A., & Zisserman, A. (2013). Deep inside convolutional networks: Visualising image classification models and saliency maps. arXiv preprint arXiv:1312.6034.
Summary: This paper explains how to create saliency maps for a given input image and CNN. It works by applying a special backward pass through the network.
Zhou, Z. H., Jiang, Y., Yang, Y. B., & Chen, S. F. (2002). Lung cancer cell identification based on artificial neural network ensembles. Artificial Intelligence in Medicine, 24(1), 25-36.
Summary: This paper uses neural networks to detect lung cancer cells.
Karabatak, M., & Ince, M. C. (2009). An expert system for detection of breast cancer based on association rules and neural network. Expert systems with Applications, 36(2), 3465-3469.
Summary: This paper uses neural networks to detect breast cancer.
Djavan, B., Remzi, M., Zlotta, A., Seitz, C., Snow, P., & Marberger, M. (2002). Novel artificial neural network for early detection of prostate cancer. Journal of Clinical Oncology, 20(4), 921-929.
Summary: This paper uses neural networks to detect early prostate cancer.
Qin, C., Zhu, H., Xu, T., Zhu, C., Jiang, L., Chen, E., & Xiong, H. (2018, June). Enhancing person-job fit for talent recruitment: An ability-aware neural network approach. In The 41st International ACM SIGIR Conference on Research & Development in Information Retrieval (pp. 25-34).
Summary: Using neural networks to predict how well a person fits a job.
Van Huynh, T., Van Nguyen, K., Nguyen, N. L. T., & Nguyen, A. G. T. (2019). Job Prediction: From Deep Neural Network Models to Applications. arXiv preprint arXiv:1912.12214.
Summary: Neural networks for job applications.
Sun, Y., Liang, D., Wang, X., & Tang, X. (2015). Deepid3: Face recognition with very deep neural networks. arXiv preprint arXiv:1502.00873.
Summary: Using neural networks to recognize faces.
Kuo, Lily. “China Brings in Mandatory Facial Recognition for Mobile Phone Users.” The Guardian, Guardian News and Media, 2 Dec. 2019, www.theguardian.com/world/2019/dec/02/china-brings-in-mandatory-facial-recognition-for-mobile-phone-users.
Summary: News article covering use of facial recognition in China.
Bojarski, M., Del Testa, D., Dworakowski, D., Firner, B., Flepp, B., Goyal, P., ... & Zhang, X. (2016). End to end learning for self-driving cars. arXiv preprint arXiv:1604.07316.
Summary: Using CNN to steer self driving car based on camera images
Qin, Zhuwei & Yu, Fuxun & Liu, Chenchen & Chen, Xiang. (2018). How convolutional neural networks see the world - A survey of convolutional neural network visualization methods. https://arxiv.org/abs/1804.11191
Summary: Features learned by convolutional NN are hard to identify and understand for humans. This paper shows how CNN interpretability can be improves using CNN visualizations. The paper talks about several visualization methods, e.g. Activation Maximization, Network Inversion, Deconvolutional NN and Network Dissection based visualization.
Yu, Wei & Yang, Kuiyuan & Bai, Yalong & Yao, Hongxun & Rui, Yong. (2014). Visualizing and comparing Convolutional Neural Networks. https://arxiv.org/abs/1412.6631
Summary: This paper attempts to understand the internal working of a CNN, among others it uses visualization to do so.
Zeiler, Matthew D & Fergus, Rob. (2014). Visualizing and Understanding Convolutional Networks. https://link.springer.com/chapter/10.1007/978-3-319-10590-1_53
Summary: This paper introduces a visualization technique that gives insight to the function of feature layers and how classifier operates. It is said that using the visualizations, the network can be improved to outperform other networks.
Zintgraf, Luisa M. & Cohen, Taco S. & Welling, Max. (2017). A New Method to Visualize Deep Neural Networks. https://arxiv.org/abs/1603.02518
Summary: This paper presents a visualization method for the response of a NN to a specific input. It will for example highlight areas that show why (or why not) a certain class was chosen.
Zhang, Quanshi & Wu, Ying Nian & Zhu, Song-Chun. (2018). Interpretable Convolutional Neural Networks.http://openaccess.thecvf.com/content_cvpr_2018/html/Zhang_Interpretable_Convolutional_Neural_CVPR_2018_paper.html
Summary: This paper uses a different approach to make CNN more understandable. Instead of focusing on visualization, it proposes a method to modify a traditional CNN to make it more understandable.
https://machinelearningmastery.com/how-to-visualize-filters-and-feature-maps-in-convolutional-neural-networks/
Summary: Coding tutorial on how to visualize neural networks.
Yosinski, J., Clune, J., Nguyen, A., Fuchs, T., & Lipson, H. (2015). Understanding neural networks through deep visualization. arXiv preprint arXiv:1506.06579. https://arxiv.org/abs/1506.06579
Summary: introduces several new regularization methods that combine to produce qualitatively clearer, more interpretable visualizations.
Tzeng, F. Y., & Ma, K. L. (2005). Opening the black box-data driven visualization of neural networks (pp. 383-390). IEEE. https://ieeexplore.ieee.org/abstract/document/1532820
Summary: presents designs and shows that the visualizations not only help to design more efficient neural networks, but also assists in the process of using neural networks for problem solving such as performing a classification task.
Nguyen, A., Yosinski, J., & Clune, J. (2016). Multifaceted feature visualization: Uncovering the different types of features learned by each neuron in deep neural networks. arXiv preprint arXiv:1602.03616. https://arxiv.org/abs/1602.03616
Summary: introduces an algorithm that explicitly uncovers the multiple facets of each neuron by producing a synthetic visualization of each of the types of images that activate a neuron.The paper also introduces regularization methods that produce state-of-the-art results in terms of the interpretability of images obtained by activation maximization.
Olah, C., Mordvintsev, A., & Schubert, L. (2017). Feature visualization. Distill, 2(11), e7.
https://distill.pub/2017/feature-visualization/?utm_campaign=Dynamically%20Typed&utm_medium=email&utm_source=Revue%20newsletter
Summary: This article focuses on feature visualization. While feature visualization is a powerful tool, actually getting it to work involves a number of details. In this article, the writer examines the major issues and explores common approaches to solving them. The writer finds that remarkably simple methods can produce high-quality visualizations.
Leon A. Gatys, Alexander S. Ecker, Matthias Bethge (2016). Image Style Transfer Using Convolutional Neural Networks.
Summary: Paper about a neural network that can seperate and combine the style and content of natural images, which provide new insights into the deep image representations learned by Convolutional Neural Networks and demonstrate their potential for high level image synthesis and manipulation.
Patrice Y. Simard, Dave Steinkraus, John C. Platt (2003) Best Practices for Convolutional Neural Networks Applied to Visual Document Analysis.
Summary: Neural networks are a powerful technology for classification of visual inputs arising from documents. However, there is a confusing plethora of different neural network methods that are used in the literature and in industry. This paper describes a set of concrete best practices that document analysis researchers can use to get good results with neural networks.
Mohammad Rastegari , Vicente Ordonez, Joseph Redmon , Ali Farhadi (2016). XNOR-Net: ImageNet Classification Using Binary Convolutional Neural Networks.
Summary: Paper in which two approximations of standard Convolutional Networks, using binary filters and input to convolutional layers, are proposed and compared to networks with full precision weights by running them on the ImageNet task. The approximations result in both big memory and runtime savings.
Hubert Cecotti and Axel Gräser (2011). Convolutional Neural Networks for P300 Detection with Application to Brain-Computer Interfaces.
Summary: Paper that proposes use of a Convolutional Neural Network to analyse brain activities and in this way detecting P300 brain waves.
Yunjie Liu, Evan Racah, Prabhat, Joaquin Correa, Amir Khosrowshahi, David Lavers, Kenneth Kunkel, Michael Wehner, William Collins (2016). Application of Deep Convolutional Neural Networks for Detecting Extreme Weather in Climate Datasets.
Summary: In this paper, the authors developed a deep Convolutional Neural Network (CNN) classification system and demonstrated the usefulness of Deep Learning technique for tackling climate pattern detection problems.
[Rowley et al., 1998] Henry A. Rowley, Shumeer Baluja, and Takeo Kanade. Neural network based face detection.
Summary: this paper talks about convolutional neural networks that can detect faces. From this we can take how these layers are structured and how each layer can be visualized.
J.Abdul Jaleel, Sibi Salim, and Aswin.R.B. Artificial neural network based detection of skin cancer.
Summary:Here they talk about neural nets that detect skin cnacer even more reliable then humans in a early stage, something that might safe lives.
B. Lo, H.P. Chan, J.S. Lin, H Li, M.T. Freedman, and S.K. Mun. Artificial convolution neural network for medical image pattern recognition.
Summary:This is a paper that is more broad in the different deseases that it can find using CNN's.
A. Canziani & E. Culurciello, and A. Paszke. An analysis of deep neural networks for practical applications
Summary:In this paper they describe neural nets that can detect more 'normal' objects. They do this with the imagenet dataset.
L. Zhang, F. Yang, Y.D. Zhang, and Y.J. Zhu. Road crack detection using deep convolutional neural networks.
Summary:A paper that goes in detail of CNN's that detect certain road conditions like cracks that are hard to find by humans.
Logbook
WEEK 1
| Name | Total hours | Break-down |
|---|---|---|
| Joris Goddijn | 5 | Lecture (2h), Meeting (1.5h), Update Wiki+Document (1.5h) |
| Daniël Verloop | 4.5 | Lecture (2h), Meeting (1.5h), Update Wiki+Document (1h) |
| Ka Yip Fung | 5 | Lecture (2h), Meeting (1.5h), Update Wiki+Document (1.5h) |
| Rik Maas | 5 | Lecture (2h), Meeting (1.5h), Update Wiki+Document (1.5h) |
| Jeroen Struijk | 3.5 | Lecture (2h), Meeting (1.5h) |
WEEK 2
| Name | Total hours | Break-down |
|---|---|---|
| Joris Goddijn | 14 | Meeting(2h), Research references 6-13 (4h), Rewrite problem statement objectives and users (3h), Learning Django basics (4h), Updating wiki (1h) |
| Daniël Verloop | 14 | Meeting(2h), Learning Language(3h), Initializing vue project(3h), Website-design(6h) |
| Ka Yip Fung | 13 | Meeting (2h), Learning Vue basics (3h), Working on website design (7h), Updating Doc/Wiki (1h) |
| Rik Maas | 15 | Meeting (2h), Learning Django basics (5h), working on saliency maps (8h) |
| Jeroen Struijk | 17 | Meeting (2h), Learning Django basics (5h), working on layer visualizations (10h) |
WEEK 3
| Name | Total hours | Break-down |
|---|---|---|
| Joris Goddijn | ||
| Daniël Verloop | ||
| Ka Yip Fung | ||
| Rik Maas | ||
| Jeroen Struijk |
