File:Helmholtzregion.png: Difference between revisions
Jump to navigation
Jump to search
Model-generated plot. Where there’s blue, there’s no Helmholtz motion. The other colors indicate note flattening effect. The darker red, the bigger the flattening. |
(No difference)
|
Latest revision as of 13:59, 11 October 2010
Model-generated plot. Where there’s blue, there’s no Helmholtz motion. The other colors indicate note flattening effect. The darker red, the bigger the flattening.
File history
Click on a date/time to view the file as it appeared at that time.
| Date/Time | Thumbnail | Dimensions | User | Comment | |
|---|---|---|---|---|---|
| current | 13:59, 11 October 2010 | 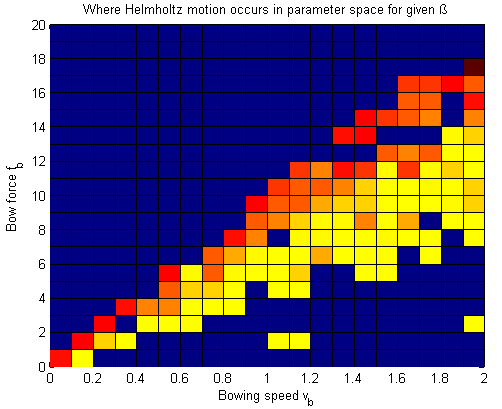 | 502 × 409 (8 KB) | S081437 (talk | contribs) | Model-generated plot. Where there’s blue, there’s no Helmholtz motion. The other colors indicate note flattening effect. The darker red, the bigger the flattening. |
You cannot overwrite this file.
File usage
The following 2 pages use this file: