PRE2017 4 Groep9: Difference between revisions
| (18 intermediate revisions by 2 users not shown) | |||
| Line 1: | Line 1: | ||
= | =Part 1: The Plan= | ||
==Deliverables and milestones == | ==Deliverables and milestones == | ||
| Line 66: | Line 66: | ||
Literature study will be followed by formulating problem statement, users and requirements. The provided solution will aim in increasing safety of spectators during football events. Algorithm will be provided to estimate probability of dangerous incident during the event. Besides, solution of hardware will be described, that in combination with designed algorithm will lead to increased safety. | Literature study will be followed by formulating problem statement, users and requirements. The provided solution will aim in increasing safety of spectators during football events. Algorithm will be provided to estimate probability of dangerous incident during the event. Besides, solution of hardware will be described, that in combination with designed algorithm will lead to increased safety. | ||
= | =Part 2 = | ||
== Deliverables & Milestones == | == Deliverables & Milestones == | ||
| Line 164: | Line 164: | ||
===Enterprise=== | ===Enterprise=== | ||
= | Since designed system was our idea it was decided that out group will be Enterprise part in this case In order to evaluate market need for this product undertakings where done to contact possible customers to evaluate product, however no response was received. | ||
=Part 3= | |||
==Deliverables== | ==Deliverables== | ||
| Line 221: | Line 223: | ||
The biggest use will be done from the age data. It clearly shows that the most populated is age group 21-40, therefore age will be used as one of the most important parameters. This data is easily validated by checking ID card of participant of the event (ID card is required during participation in this kind of event). Second data that will have significant influence on the algorithm is criminal record of the participants. Research showed that members of the research sample have tendency to recidivism, therefore huge pressure will be put in implementing this knowledge in the algorithm. | The biggest use will be done from the age data. It clearly shows that the most populated is age group 21-40, therefore age will be used as one of the most important parameters. This data is easily validated by checking ID card of participant of the event (ID card is required during participation in this kind of event). Second data that will have significant influence on the algorithm is criminal record of the participants. Research showed that members of the research sample have tendency to recidivism, therefore huge pressure will be put in implementing this knowledge in the algorithm. | ||
= | =Part 4 = | ||
== Deliverables & Milestones == | == Deliverables & Milestones == | ||
=== Deliverables === | === Deliverables === | ||
| Line 249: | Line 251: | ||
In addition to the "risk group" distribution it needs to be considered how busy is the stadium entrance. Three cases were assumed; the crowd at the entrance is small, moderate or large. | In addition to the "risk group" distribution it needs to be considered how busy is the stadium entrance. Three cases were assumed; the crowd at the entrance is small, moderate or large. | ||
= | == Matlab simulation == | ||
Matlab simulation file was created to demonstrate performance of the algorithm. To increase simplicity of the demonstration dailog boxes are being used to input data. In future this data will be obtained by scanning barcode from the ticket. All parameters in the simulation are temporary and can be further adjusted with development of algorithm. Current version of the simulation can be found under [[Media:Algorithm.m | link]]. ''Algorithm.m'' contains also simulations validation of the algorithm performance, based on probability calculations. | |||
=Part 5= | |||
==Deliverables and milestones== | ==Deliverables and milestones== | ||
| Line 290: | Line 296: | ||
[[File:Percentages.png]] | [[File:Percentages.png]] | ||
With this algorithm and using the acquired data, the number of people that would be considered as a part of "moderate risk group" and then the number of people that would be considered as a part of "high risk group" were calculated using the Matlab simulation. | |||
'''Moderate risk group:''' <math>0.23 * 0.65 * 0.056 * 0.999176 * 18000 = 150.5718</math> | |||
From the calculation it can be seen that statistically during a Birmingham City FC match about 150 people of this algorithm variation (support sector, age 21-50, support group member, no records) would be considered as moderate risk and the security would be advised to pay more attention to them during a security check. That number of people would definitely not have a negative effect on the crowd flow. | |||
'''High risk group:''' Going through the algorithm similar way as for the moderate risk group the percentage of people that would be considered as a high risk was calculated to be around 0,0799% of the number of people attending the match. This gives us a number of about 14 people that must be searched in detail, with no exceptions. That number would definitely not have a negative effect on the crowd flow, same as in the moderate risk group. | |||
=Part 6= | |||
==Deliverables and milestones== | |||
'''Deliverables''' | |||
* Ideas for future development and algorithm modification | |||
===Software updates=== | |||
Every system needs regular updates in order to work properly. Sometimes some bugs can occur and affect the output, making the system imprecise and worthless. In that kind of situation, additional corrections and fixes are necessary, implementing them as fast as possible so the system can again work properly. In the case of our algorithm, all the statistics that are used to validate the estimation of given points at every step were obtained from the most recent databases. It was pointless to take statistics from a period that was 7 years ago because the validation of the algorithm would not work for the present time situation. That is why the statistics that the system is based on should be updated at least every 2 years in order to get a correct final output for every checked person. | |||
===Personalize the algorithm for a specific country=== | |||
In the conducted research, all the statistics and percentages were obtained for the countries of England and Wales. So the created system works only when it is implemented in those particular countries. Similar solution could be used in other football leagues. Countries like Poland, Serbia or Bulgaria have a much bigger problem with hooliganism than England and Wales. But the databases and required statistics are not easily acquired there. If the system of keeping football-related crimes records would be implemented there as well as in England and Wales, there would not be much problem to create a personalized algorithm. | |||
===Adding more decision steps=== | |||
Based on research, it was decided that four things are crucial when calculating a persons' "risk level". So the algorithm is relatively simple, because it only operates around this for steps. But if additional research was conducted, the algorithm would have more steps, which would make it more complex. Aspects like gender or skin color could be added if proper research would prove their relativity. Again, additional steps implemented into the algorithm could differ based on the country of its implementation. | |||
===Combining the algorithm with the security guards knowledge=== | |||
There are already some people that work in the field that is being explored during this project. They sit by the sectors, observing unusual behavior of the football fans. They have certain rules, but they mostly rely on their own intuition, which is very hard to implement into the computer system and AI. The most efficient way would be to combine the algorithm and knowledge of the stadium workers. It would be pointless to completely replace people with the AI, it would be the best solution to make them work together. | |||
=References = | =References = | ||
| Line 302: | Line 333: | ||
Baić, Valentina, Zvonimir Ivanović, and Stevan Popović. "SOCIO-DEMOGRAPHIC CHARACTERISTICS OF VIOLENT FAN GROUPS AT FOOTBALL MATCHES." Acta Kinesiologica: 37. | Baić, Valentina, Zvonimir Ivanović, and Stevan Popović. "SOCIO-DEMOGRAPHIC CHARACTERISTICS OF VIOLENT FAN GROUPS AT FOOTBALL MATCHES." Acta Kinesiologica: 37. | ||
C. Nelson et al., "Experimental designs for testing metal detectors at a large sports stadium," 2015 IEEE International Symposium on Technologies for Homeland Security (HST), Waltham, MA, 2015, pp. 1-7. | |||
C. Nelson, V. Chaudhary, J. Edman and P. Kantor, "Walk-through metal detectors for stadium security," 2016 IEEE Symposium on Technologies for Homeland Security (HST), Waltham, MA, 2016, pp. 1-6. | |||
B. Sorte, V. Patil and M. Bhamare, "Motion detection using optical flow and standard deviation," 2016 International Conference on Automatic Control and Dynamic Optimization Techniques (ICACDOT), Pune, 2016, pp. 295-300. | |||
S. A. Miraftabzadeh, P. Rad, K. K. R. Choo and M. Jamshidi, "A Privacy-Aware Architecture at the Edge for Autonomous Real-Time Identity Re-Identification in Crowds," in IEEE Internet of Things Journal. | |||
Huang, Haikun, Ni-Ching Lin, Lorenzo Barrett, Darian Springer, Hsueh-Cheng Wang, Marc Pomplun and Lap-Fai Yu. “Automatic Optimization of Wayfinding Design.” IEEE transactions on visualization and computer graphics (2017): n. pag. | |||
Patrick Brown, "Factors Affecting the Probability of Arrests at an NFL Game". | |||
Tamara Pavasovic Trost & Nikola Kovacevic (2013) Football, hooliganism and nationalism: the reaction to Serbia's gay parade in reader commentary online, Sport in Society, 16:8, 1054-1076. | |||
Gebert, Steffen, David Hock, Thomas Zinner, Phuoc Tran-Gia, Marco Hoffmann, Michael Jarschel, Ernst-Dieter Schmidt, Ralf-Peter Braun, Christian Banse and Andreas Köpsel. “Demonstrating the optimal placement of virtualized cellular network functions in case of large crowd events.” SIGCOMM (2014). | |||
Li D., Chen X., Sun Q. (2018) The Study of Population Evacuation Problems. In: Arezes P. (eds) Advances in Safety Management and Human Factors. AHFE 2017. Advances in Intelligent Systems and Computing, vol 604. Springer, Cham. | |||
Jiaming LiuXingqun QiYimeng XuYanda ChenChuang Zhang (2018) Queuing Strategy Optimization with Restricted Service Resources. | |||
A. Melrose, P. Hampton, P. Manu, Safety at Sports Stadia, Procedia Engineering, Volume 14,2011, Pages 2205-2211, ISSN 1877-7058. | |||
Passos, C., da Silva, M.H., Mol, A.C.A. et al. Design of a collaborative virtual environment for training security agents in big events, Cogn Tech Work (2017) 19: 315. | |||
Frosdick, Steve & Newton, Robert. (2006). The Nature and Extent of Football Hooliganism in England and Wales. Soccer & Society. 7. 403-422. | |||
Sources database | Sources database | ||
https://www.dropbox.com/sh/h1h4kainupheur0/AADrlm7xJLwKwV8EZWMUw5bVa?dl=0 | https://www.dropbox.com/sh/h1h4kainupheur0/AADrlm7xJLwKwV8EZWMUw5bVa?dl=0 | ||
Latest revision as of 18:36, 25 June 2018
Part 1: The Plan
Deliverables and milestones
Deliverables:
- Problem Statement and Objectives
- Users
- User requirements/ Needs
- Approach, milestones, deliverables
- Task division
- State of Art Literature Study
- Wiki Update
Milestones:
- Research history of stadium accidents, caused by football hooliganism
- Current approach and existing solutions
Literature Study and State of Art
Phenomenon description, hooliganism and pyrotechnics
Hooliganism definition
There is no precise definition of ‘football hooliganism’. It lacks legal definition, precise demarcation of membership and is used to cover a variety of actions which take place in more or less directly football-related contexts. To account for some of the phenomenon’s main features, a distinction should be drawn between spontaneous, relatively isolated incidents of spectator violence and the behaviour of socially organized or institutionalized fan (hooligan) groups which engage in competitive violence, principally with other hooligan groups.3 This distinction is historically observable through a shift from a pattern in which attacks on match officials and opposing players predominated over attacks on rival fans, to a pattern in which inter-fan group fighting and fighting between fans and the police became the predominant form of spectator disorderliness. This shift has taken place in various European countries, but at different times. (Spaaij, 2005)
Pyrotechnics, opinion of hooligans
Over 2/3 of the hooligans (68.75%) sometimes participated in firing of pyrotechnics. They agreed with the expression of the supporters “no pyrotechnics, no party”. Only 12.50% of the hooligans did not participate in pyrotechnics, and the rest of the hooligans (18.75%) had a different point of view and used the pyrotechnics every match. (Scholz, 2016)
Pyrotechnics, danger and basic principle
Pyrotechnics are fireworks that are ignited by lighting the magnesium. They produce light effects and a lot of smoke (Zeus 2013). The fans use pyrotechnics called ‘bengalisches Feuer’ or Bengalos which is a type of flare. Fans smuggle them into the stadium as they are illegal. Since the flares can be as small as a lipstick, they are hard to detect by security personnel; women can smuggle them in easily (Fritz 2012).
Bengalos are normally used on boats for rescue missions on oceans or seas. Once the Bengalo is ignited, it cannot be extinguished by either sand or water and can burn at over 1000 degrees Centigrade even when the flame has finished burning (RPO 2012). This is what makes the flare so dangerous in an enclosed space with thousands of people in the immediate surroundings. Officials are worried because of fire safety issues and even the possibility of death in an area filled with people and no quick way to escape. In addition, the smoke from setting off the flare can cause an added health hazard when inhaling it. Fans sometimes use the smoke coming from these pyrotechnics to storm the field of play before the match is even over (Fritz 2012). (Adams, 2013)
Increasing stadium violence on the example of European countries
When Poland is concerned, there has been a significant increase in violence at football matches of the domestic championship in that country. Interestingly, the number of incidents decreased at football matches, belonging to higher rank of championship, primarily due to technically well equipped stadiums, and good police work, and violence is transferred to the lower ranks of the competition, where the infrastructure is worse. As for the violence at football matches of the international character, there have been no significant changes, i.e. the situation is the same as in the previous period. In Poland, the violence is most often manifested in three ways: the use of pyrotechnic devices, prearranged violence (primarily scheduled fights and clashes outside the stadium between different hooligan groups), and verbal violence.
Violence in the stadiums in Serbia has remained almost at the same level as before. The number of incidents has decreased by 26%, but the acts of violence have become more violent and more serious. The report noted that Serbia and Bulgaria are the only countries without adequate security services in the stadiums, in charge of the security of the fans in addition to police. In Serbia, this problem arose because of the lack of laws governing the specified area, so there is no legal document that defines the role of security services. The most common forms of manifesting violence are the following: the use of pyrotechnic devices, prearranged violence (primarily scheduled fights and clashes outside the stadium between different hooligan groups), and the verbal violence that leads to incidents. An interesting observation was that there was a change in the form of manifestation of violence. There is an increased number of violent acts towards owners and management of teams, and violence between supporters of the same club or the supporters of different factions of the same club. Similar to the extreme Italian fan groups, the supporters in Serbia are also organized within groups, while larger groups of supporters (those of Red Star, Partizan and Vojvodina) have several factions, among which violent conflicts often arise because of the leadership in the stadiums, which are often transferred to the streets of major cities. ( Milojević, S., and B. Janković. , 2012)
Stadium violence, most common forms
Annual Report1of the Standing Committee2of the Council of Europe for implementationof the European convention on violence and improper behaviour of spectators on sports events, especially football matches.The report noted that different states are threatened by various forms of violence at football matches, but the most common are these three forms:
- the use of pyrotechnics;
- pre-arranged violence (primarily scheduled fights and clashes outside the stadium between different hooligan groups), and
- violence related to alcohol use and violence committed by persons who are intoxicated by alcohol.
( Milojević, S., and B. Janković. , 2012)
Problem Statement
Violence and usage of pyrotechnics during football matches is increasing problem in whole Europe. Due to that fact, health and life of spectators attending sports events are put in danger. Implementing our solution for security check and tracking activity of hooligans aims in increasing safety on the sports venues.
Users
Main users/ target audience: Attenders of sport events.
Generalizable to: Middle class families attending the football games, as a group who is mostly scared and put in danger due to hooligan activities. Moreover, maximizing attendance of this social group has positive influence on the club budget (merchandise sale, match day income).
Objectives
- Creating algorithm allowing invigilation of hooligans
- The solution, that is ethically correct and does not break the law
- The solution that does not require remarkable investments
- The solution that does not significantly affect crowd flow during the event
Approach
Literature study will be followed by formulating problem statement, users and requirements. The provided solution will aim in increasing safety of spectators during football events. Algorithm will be provided to estimate probability of dangerous incident during the event. Besides, solution of hardware will be described, that in combination with designed algorithm will lead to increased safety.
Part 2
Deliverables & Milestones
Deliverables
- Research: Crowd management and queuing strategy
- Research: Security check on stadiums
- Research: Virtual Reality training for security
- User Society and Enterprise aspects
- USE scenarios
Milestones
- What would be a base risk percentage?
- On which aspects would the algorithm operate?
Crowd management and queuing strategy
Crowd management plays a crucial role during various types of mass events (e.g. music, sport) as it has a significant influence on the overall safety of the event's participators. There are many techniques that are meant to rise the efficiency of the crowd flow while keeping the safety measures on the level that allows the security to pay enough attention to each passing participant of the event.
Effective crowd control techniques
- Wayfinding optimization – it is crucial to design and optimize the wayfinding approach for the newcomers. It is common to enhance the crowd flow by putting directional signs that help participants find the desired entrance.
- Queue management – since waiting in line can cause tension among a large group of impatient, tired and excited participants, crowd control issues can arise. It is important to keep the crowd entertained and distracted (e.g. in-line merchandise, promotional videos).
- Temporary closures – due to some maintenance, cleaning or renovation some sections or areas could be closed off. It is important to clearly mark the alternative routes and instructions for the participants (e.g. signage combined with physical barriers).
- Rapid deployment – when an unexpected situation happens, it is important for the staff to be prepared and quickly resolve the issue that occurred (e.g. overflowed toilets).
- Customer flow management – to keep the crowd under control, it is essential to set the desired direction of the crowd flow throughout the entire facility (e.g. museums, operas). It helps to maintain a highly controlled environment that is better prepared for unexpected incidents.
Queuing theory is a field of mathematical study that focuses on waiting lines and queues. A queueing model is constructed so that queue lengths and waiting time can be predicted. Queuing theory was proposed by Danish mathematician A.K. Erlang in 1909. Through the 100 years of its development, queuing theory is nowadays commonly used in practice during mass events, supermarkets or toll gates.
Security checks on stadiums
Following the tragedies that happened on the football stadiums, a significant attention was put into the improvement of security measures on those objects of mass attendance. Especially during the championship finals or derby games, the level of security needs to be increased as the risk of some incident occurring while the game is played is greater than during a regular match. Most common security measures that are implemented during a stadium security check are:
- Tickets and documents authentication
- Walk-through metal detectors and handheld metal detectors
- Detailed search of participant's bags and belongings (if present)
- Additional search (if security decides it is necessary)
- Security cameras placed all over the facility
Metal detectors that are commonly used during a security check can be distinguished into two different types: walk-through detectors and handheld detectors. The walk-through metal detectors are undoubtedly more accurate and successful than the handheld detectors, as their sensitivity can be increased or decreased. However, by increasing the security level and the sensitivity there is a great risk that the crowd flow going through the security check would drop rapidly. From the experiments that were conducted on the walk-through metal detectors it was confirmed that the accuracy and the success rate depend on many various aspects. Most important of them are: the height on which object is located; the type of metal that the object is made of; the speed with which a person passes through the detector. So, it is crucial to find a balance that will allow the security to keep the participants of the event safe, but at the same time make sure it will not cause additional hours of waiting in lines and therefore many negative reviews and opinions about the event in overall. In many places, like airports or government facilities, the walk-through metal detectors are used alongside the handheld detectors. Often, when the security is alerted by the walk-through detector, that an undesired object is present, the security asks if the person is sure that all metal objects have been removed. If the answer is yes and walk-through detector still alarms the security, the additional inspection with a handheld metal detector is conducted. Meanwhile, when the person is checked by metal detectors, his/hers bags and belongings are also deeply searched by other security members to assure that no dangerous objects (e.g. pyrotechnics) are brought into the stadium area.
Crowd management and security measures based on the Luzhniki Stadium example
According to the security plans that are almost at its finish of implementation, Luzhniki Stadium will have close to 1600 security cameras installed around the stadium in addition to the existing 400 cameras. Around 1300 cameras will be installed inside the stadium, giving the overall number of cameras at nearly 3000. Video surveillance is meant to be a key feature of the stadium security system during the 2018 World Cup. Alongside the great number of cameras, also 900 various sensors, scanners, monitors and detectors will be installed at the stadium. In addition, 6 check points for vehicles, 39 inspection lines, 7 pedestrian check points and 427 entrance points for visitors.
Virtual Reality Training
There are several ways to define virtual reality. Simply, VR is a computer-generated scenario that simulates experience through senses and perception. Its objective is to give the user the feeling of living inside a virtual world in real time. Created environment can be similar to the real world or it can be fantastical, creating an experience not possible in ordinary physical reality.
Virtual Reality has many applications. Besides videogames it is also used in various types of training. Since VR can simulate real spaces for training purposes, it can be used to provide learners with a virtual environment where they can develop their skills without the real-world consequences of failing. It has been used in primary education, military, astronaut training, flight simulations and driver training.
It could be an excellent idea to also implement the Virtual Reality technology in security training to ensure that large events participants' safety is in even better hands. Such a training was already conducted as an experiment during 2014 FIFA World Cup and Rio 2016 Olympic Games. However, the training was focused on identification of radioactive materials that were carried by the suspects.
Steps for VR training:
- Modeling the environment where situation occur.
- Avatars modelling.
- Implementation of the environment and definition of available functionalities.
Environment modelling for the experiment was based on the Maracana Stadium model. The modelling process starts with adding a topographic image of the stadium and its neighborhoods, for reference. Next, the technique of poly-modelling was used to shape the stadium in the virtual reality. Then, the textures and colors were added to provide more fidelity to the original.
Terrain modelling was performed by using Unity 3D in order to insert the necessary objects and edifications. For instance, adding Bellini's statue at the stadium entrance, which gives the users a better immersion of the experience.
Avatars modelling is necessary for providing interaction between the user and the developed environment. Besides the generic avatars representing the audience, there are also specific avatars that represent the security agents and suspects. Agents like firefighters, police officers or agents from the local control center can act in different ways, according to the user's will.
Implementation of functionalities considers adding some basic animations like walking, running, jumping and adding necessary features for the training of agents. For instance, the Policeman would have a functionality to arrest a suspect, and the firefighter would use the radiation detector on that suspect. Agents can also communicate which each other.
Interface that was created for the experiment had to fulfill some requirements that state as follows:
- Simplicity - the commands for the execution of tasks are easy to use;
- Support - the user is always in control of actions;
- Familiarity - input keys are similar to those used in the gaming world;
- Awareness - built objects and their controls are always visible to the user;
- Availability - user has access to agents and their functionality at any time;
- Affinity - scenario, objects and functionalities are very close to the reality of agents.
User Society and Enterprise aspects
USE Scenario's
User
Our product will be dedicated to parties organising big sport events such as football games with a possibilities of the hooliganism incidents. Application of our system can positively influence attendance, reduce number of fines due to inappropriate behaviour of fans and improve safety on the stadium. Example of User perspective scenarios are going to be considered.
Poland Cup Final, 2018
The football game was held on the beginning of the may 2018 on the neutral National Stadium in Warsaw. Two competing teams where Arka Gdynia and Legia Warsaw. Event was organised by Polish Football Association(PZPN). To prevent any unwanted accidents there where three different ticket sales organised. First two designed for supporters clubs of each team, second was open for supporters that are not formally associated with any of clubs. Moreover, fans from different sales sectors had no possibility to share a sector. Fans where instructed to arrive to security check three hours earlier, due to high danger of incidents. Supporters of Arka ,on purpose decided to arrive at the security gates just before the first whistle. Both police and organiser was aware that this group of supporters was composed of people with criminal record willing to use pyrotechnics on such an important game and regular supporters from Gdynia. Due to lack of possibility to distinguish two groups of supporters, police and PZPN, decided to lower the security standards for faster crowd flow. This had highly unwanted turnout. Supporters of Arka, used numerous smoke flairs during the game and attempted to shoot Legia's goalkeeper using flair launcher. The game was stopped few times to wait for smoke to be blown by the wind.
Implementing new way of crowd management technique could prevent occurrence of this kind of incidents.
Society
Society aspect in this topic can be understood broadly. We could look from the perspective of families visiting sports events, sportsman who is affected by fans behaviour. When taking the problem more broadly, without any doubts it can be said that hooliganism is mirror of the social groups in particular country. We can distinguish division in field of:
- right or left wing political approach, for example Herri Norte Taldea (Atletic Bilbao) vs Biris Norte (Seville FC),
- religion, for example Roman Catholic Casuals(Celtic Glasgow) vs Her Majesty's Service( FC Rangers),
- job of supporters (Derby van Spakenburg),
- local competition, for example Frontline(Borussia Dortmund) vs SFCV( Schalke 04).
Families with children
In numerous countries football events are judged by prism of hooliganism. Due to the frequent incidents, in the social view attending football matches is dangerous and reckless for families with children. In may countries football events are associated with supporters groups who are willing to use pyrotechnical means and are often correlated with violent acts. This is excluding families from sports events. Switching the model for more family-friendlily can have positive output on development of kids and will enable one more perspective to spend free time in family atmosphere.
Enterprise
Since designed system was our idea it was decided that out group will be Enterprise part in this case In order to evaluate market need for this product undertakings where done to contact possible customers to evaluate product, however no response was received.
Part 3
Deliverables
- Research in the field of stadium incidents demography
- Implementation of the algorithm with consideration of statistical data
Milestones
- First version of the algorithm
Research (Baić, V., Ivanović, Z., & Popović, S. , 2017)
Introduction
It is hard to expressly and uniformly define demography of hooligan groups in different societies. Violent behaviour on the stadiums is very often not related to sport. In the contemporary society hooliganism is related to the position and status in society, their potential environment and social fulfilment. It is worth to point out that is only a part of sport related hooliganism. In the Serbian scientific publication criminal justice and procedural aspect of this phenomenon are mostly encountered. Anglo-Saxon literature brings up also socio-anthropological and psychological aspects of characterisation the hooligan groups. In the literature members of are mostly characterized as men, in age up to 27 years, usually members of the lower social classes. They are willing to cheer cult of masculinity. Studies also confirm significant relationship between stadium hooliganism and poverty. That does not correlate with previous criminal record of this groups. Potential links with the criminal behaviour are usually complex and indirect.
In a nutshell, hooligans groups are group that is hardly defined by means of one term or certain set of features. However common factors among group that was investigated could be noticed. This features are going to be further investigated.
Methods
Cited paper included 139 male participants in the age 16-40, members of 18 fan groups from Serbian city Novi Sad. Research group members where supporters of four major football clubs Vojovodina, Red Star, Partizan and Novi Sad. Choice of this groups was motivated and consulted with the local police department, that monitored violence and misbehaviour in the period 2011 - 2016. Mentioned supporters groups where named as the most influential.
Research results
Age
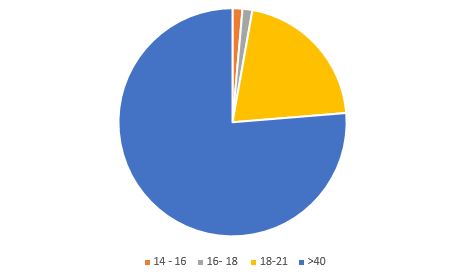
Research show that from 139 group members, only 1.4% belong to the group of younger minors( 14-16). Similarly only 1.4% of researched people where older minors (age 16- 18). Senior juveniles have 20.9% stake in the group. The significant majority are people in the age 18-40. They are 76.3% of the whole group.
Residence characteristic
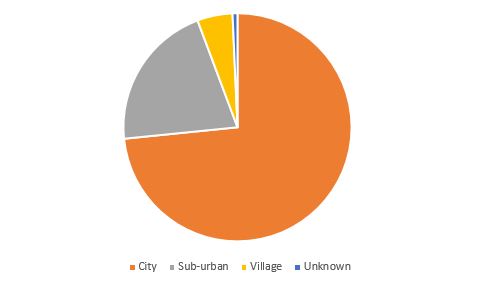
Survey result show that majority of the groups are residents of the city area (73.4%) and sub-urban area(20.9%). Minority of the fan groups members are living in the villages (5%).
Level of education
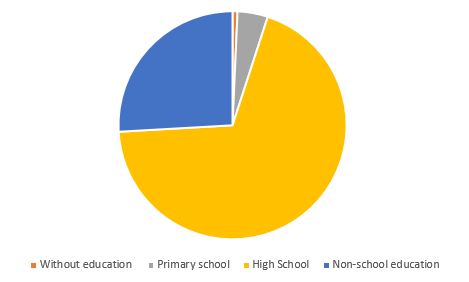
Education level can be considered as one of the indicators of the social status. Result of research show that there is equal representation of level of education among research group. Through the analysis of data pertaining to school education, it was found that 0.7% of the population of fan groups were without any education, 4.3% have completed primary school, and most of them have completed secondary education 69.1%.
Employment
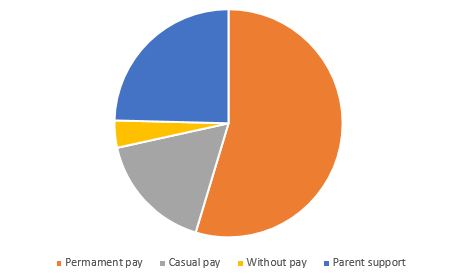
No equality can be found between incidence of certain categories of the employment on the research sample of fans. The analysis of data related to employment showed that 56.1% of the fan groups are unemployed, 7.2% were employed and 17.3% occasionally season dependently-employed.
The age structure of the members of fan groups as perpetrator of crimes
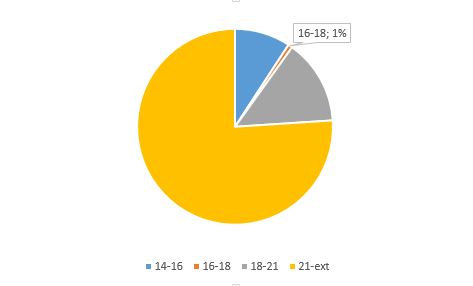
A much smaller number of crimes is committed by young adults as well as younger juveniles, and at least by older juveniles. Survey results also show that younger minors committed 9.1% of criminal offenses, older juveniles commited 1.8% of crimes, young adults 13.9%, while 75.2% (859) criminal offenses were committed by adults.
Composition of misdemeanors by members of fan groups
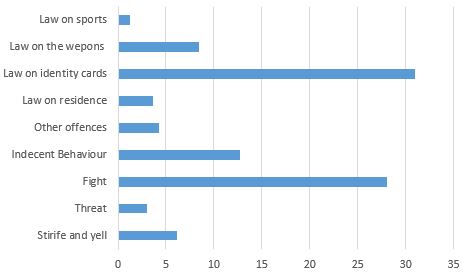
The analysis of data revealed that of the members of fan groups commited 31% misdemeanors, concerning violations of the Law on Identity Cards, 28% fight, 12.7% of offences relating to indecent behaviour, 8.4% misdemeanors concerning violations of the provisions of the Weapons and ammunition, 3.6% misdemeanors concerning violations of the Law on residence, 3% of threats, 1.5% of offences related to violations of the provisions of the Law on sports and 1.3% of offences related to violations of the provisions of the transport of explosive materials.
Conclusions and facts to be used in the algorithm
Results of the research can be beneficial for the outcomes of the project. First of all, part of the data has to be dropped due to hard accessibility. On the chart depicting place of the occupation of the supporters it can be clearly noticed that, significant number of the researched supporters resident the city areas. While implementing the algorithm it will be not possible to relay on this data. This information is not gathered by the clubs during ticket sales. Secondly, verification of this data can cause troubles. In Europe tendency can be observed, that registration address is being removed from the Identity Cards (ID cards) so this information can be easily manipulated. Another factor that will not be included in the algorithm is education. First of all due to modern, full of wars (last war ended in 2001), history of Serbia (where data was gathered) was decided to be not representable. Since the biggest part of the research was born in the years 1977-1994, we assumed that their education could be affected by wars that Serbia or Yugoslavia where part of (continuously from 1991 to 2001). Besides hard Serbian history, similarly to data regarding place of residence, this data is also hard to verify.
The biggest use will be done from the age data. It clearly shows that the most populated is age group 21-40, therefore age will be used as one of the most important parameters. This data is easily validated by checking ID card of participant of the event (ID card is required during participation in this kind of event). Second data that will have significant influence on the algorithm is criminal record of the participants. Research showed that members of the research sample have tendency to recidivism, therefore huge pressure will be put in implementing this knowledge in the algorithm.
Part 4
Deliverables & Milestones
Deliverables
- Algorithm flow chart;
- Different level risk groups distribution;
- MATLAB code - Algorithm prototype
Milestones
- Prototype functionality and improvements
Algorithm flow chart
Based on the literature and articles acquired in "Week 3" it was deducted which information about the participant can prove useful in calculating the risk level of misbehavior and estimating the need for a additional search during security check. The algorithm operates on the information that can be acquired straight from the participants ticket, in cooperation with the event organisators and local police database. The given output will be based on several aspects. These aspects are as follows:
- Is the subject sitting in regular or support sector? (Ticket information)
- What age is the subject? (Information acquired when first registering)
- Is the subject a member of a support group? (Club cooperation)
- Does the subject have a criminal record? (Police database, outside source)
While proceeding with the steps of the risk algorithm, the subject will be given in each case an estimated amount of "risk points" which will add up and will result in an output. The created flow chart for the risk algorithm (cases together with the amount of risk points) is shown below.
Risk groups
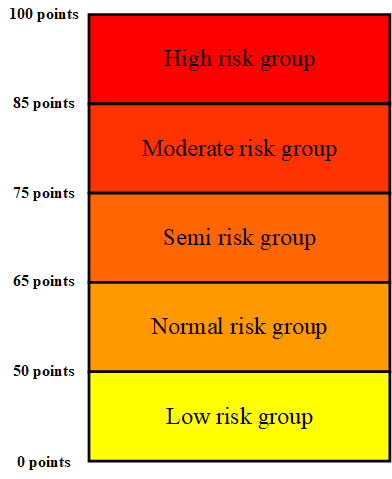
In order to ensure that the additional check will not have a negative effect on the crowd flow and the overall event experience, based on the risk points that were acquired by the subject, he/she will be placed in the one of the created "risk level" groups. According to the given group, the algorithm will calculate the probability of the subject being taken into additional search. The created "risk groups" figure together with estimated thresholds is shown below.
In addition to the "risk group" distribution it needs to be considered how busy is the stadium entrance. Three cases were assumed; the crowd at the entrance is small, moderate or large.
Matlab simulation
Matlab simulation file was created to demonstrate performance of the algorithm. To increase simplicity of the demonstration dailog boxes are being used to input data. In future this data will be obtained by scanning barcode from the ticket. All parameters in the simulation are temporary and can be further adjusted with development of algorithm. Current version of the simulation can be found under link. Algorithm.m contains also simulations validation of the algorithm performance, based on probability calculations.
Part 5
Deliverables and milestones
Deliverables
- Research: Football-related arrests and banning orders in a country of choice
- Model validation
There are some official football statistics regarding the arrests and banning orders among football fans who attend English and Welsh club matches. The most recent ones are from the season 2016/2017 and they are based on information provided by UK Football Policing Unit (UKFPU). The statistics on football-related arrests are submitted by the 43 police forces in England and Wales and BTP, whilst information on banning orders was taken from the Football Banning Order Authority’s (FBOA, part of UKFPU) records.
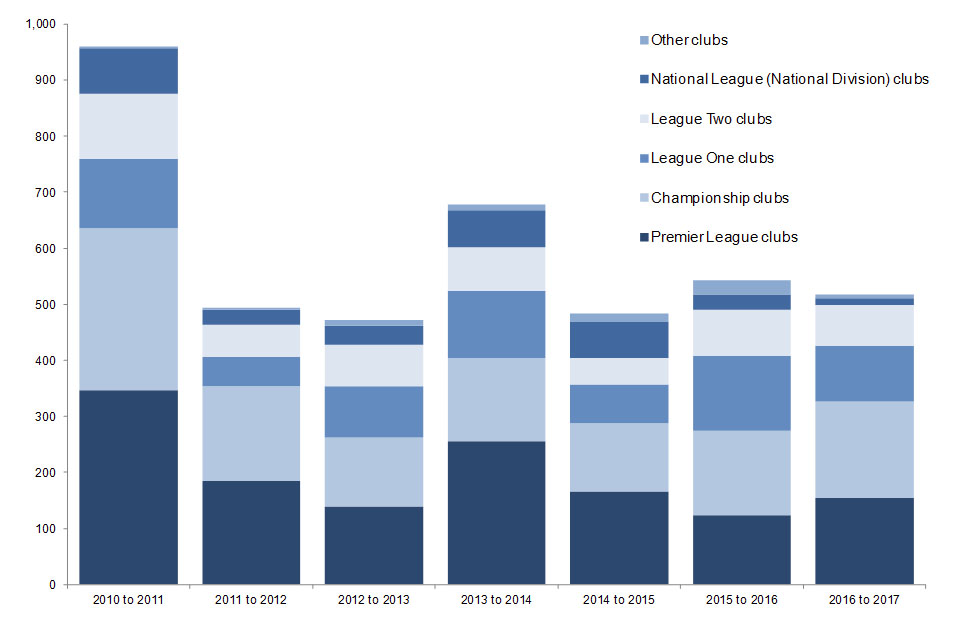
Banning orders in season 2016/2017
Of the 1,929 football banning orders that were in force as at 7 August 2017, 517 were new banning orders issued in the 2016 to 2017 season. What is more, 33% of all new football banning orders were issued to supporters of Championship clubs (171 new football banning orders) followed by 30% issued to supporters of Premier League clubs (155 new football banning orders). This is the second consecutive season in which the highest proportion of new banning orders have been issued to supporters of Championship clubs, increasing by 14% from the previous season. Number of new football banning orders issued each season in England and Wales by club supported, from 2010 to 2011 season to 2016 to 2017 season is presented in the figure below.
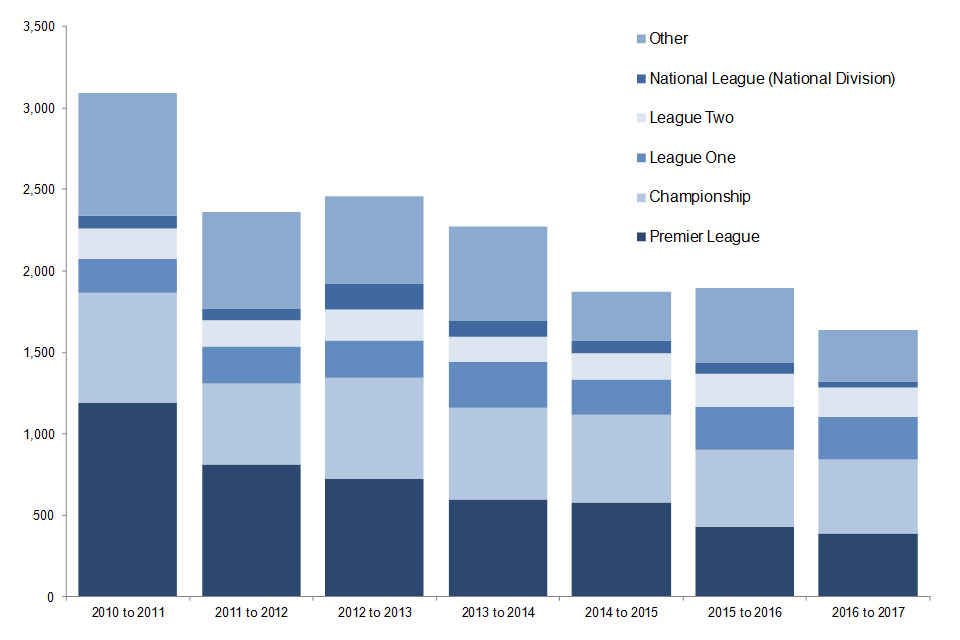
Of the 1,638 football-related arrests in season 2016/2017, the largest proportion occurred in connection with Championship matches, 28% (455). This is the second season in which fans of clubs in the Championship account for the highest proportion of all football-related arrests. Figure below shows the number of football-related arrests over the last 7 seasons ranging from 3,089 to 1,638, so a 47% decrease of 1,451 arrests.
More Birmingham City fans were arrested than any other club, as in the previous season, with 72 arrests. About a third of these arrests were for public disorder. They were followed by fans of West Ham United (67), Leeds United (61), Aston Villa (52) and Manchester City (47). In the previous season, more Birmingham City fans were arrested with 74 arrests, followed by fans of Millwall (69), Leeds United (68), Manchester City (66) and Arsenal (60).
Of the 1,638 football-related arrests in the 2016 to 2017 season, the 3 most common offence types were public disorder (31%), violent disorder (21%) and alcohol offences (16%). These have ranked within the top 3 offence types in each of the last 7 seasons.
Birmingham City Football Club example
The home ground of Birmingham City Football Club is St Andrew’s stadium of which seating capacity is around 30,000. In season 2016/2017 the total attendance during all 23 Championship matches summed up to about 430 000 participants, which given an average of about 18 700 participants per match. Since the total capacity is around 30 000 seats and on average around 18 700 fans attend the match, it can be assumed that the stadium is filled on average in approximately 60%.
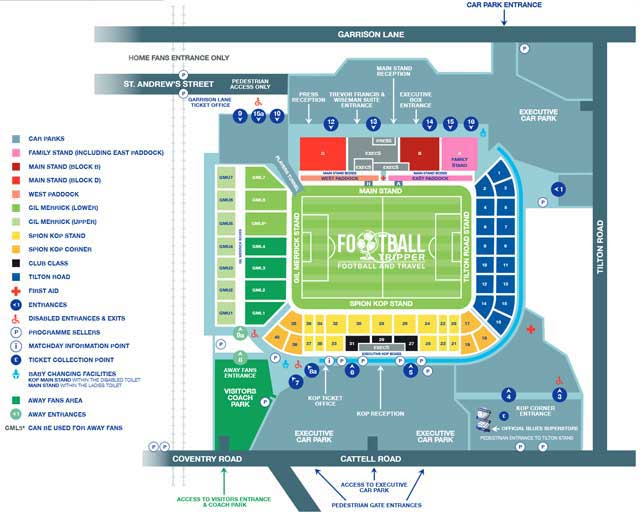
In our model validation, we are mostly interested in stadium sectors that are attended by families or most passionate football fans. Considering the schematics of the St Andrew’s stadium (shown in the figure below) it can be seen that for our model we should be mostly interested in The Garrison Lane Main Stand (located on the North side) and Tilton Road End (located on the East side).
The Garrison Lane Main Stand is capable of seating 5,000 and it is used to accommodate club guests and the media, as well as families visiting St Andrews. In this case, we are interested in the families.
Tilton Road End can accommodate 7,000 fans across a single-tier, and it often attracts some of the most passionate blues fans. So this is a stadium sector that should be able to offer a good validation for our model.
Considering the average attendance compared to the stadium capacity, it is assumed that on both sectors 60% of available seats are occupied.
Algorithm calculations considering statistics
From the various information acquired from the government databases, club supporters sites and questionnaires conducted by some organisations, the percentages calculated for each aspect of the model and its risk calculation are presented in the figure below.
With this algorithm and using the acquired data, the number of people that would be considered as a part of "moderate risk group" and then the number of people that would be considered as a part of "high risk group" were calculated using the Matlab simulation.
Moderate risk group: [math]\displaystyle{ 0.23 * 0.65 * 0.056 * 0.999176 * 18000 = 150.5718 }[/math] From the calculation it can be seen that statistically during a Birmingham City FC match about 150 people of this algorithm variation (support sector, age 21-50, support group member, no records) would be considered as moderate risk and the security would be advised to pay more attention to them during a security check. That number of people would definitely not have a negative effect on the crowd flow.
High risk group: Going through the algorithm similar way as for the moderate risk group the percentage of people that would be considered as a high risk was calculated to be around 0,0799% of the number of people attending the match. This gives us a number of about 14 people that must be searched in detail, with no exceptions. That number would definitely not have a negative effect on the crowd flow, same as in the moderate risk group.
Part 6
Deliverables and milestones
Deliverables
- Ideas for future development and algorithm modification
Software updates
Every system needs regular updates in order to work properly. Sometimes some bugs can occur and affect the output, making the system imprecise and worthless. In that kind of situation, additional corrections and fixes are necessary, implementing them as fast as possible so the system can again work properly. In the case of our algorithm, all the statistics that are used to validate the estimation of given points at every step were obtained from the most recent databases. It was pointless to take statistics from a period that was 7 years ago because the validation of the algorithm would not work for the present time situation. That is why the statistics that the system is based on should be updated at least every 2 years in order to get a correct final output for every checked person.
Personalize the algorithm for a specific country
In the conducted research, all the statistics and percentages were obtained for the countries of England and Wales. So the created system works only when it is implemented in those particular countries. Similar solution could be used in other football leagues. Countries like Poland, Serbia or Bulgaria have a much bigger problem with hooliganism than England and Wales. But the databases and required statistics are not easily acquired there. If the system of keeping football-related crimes records would be implemented there as well as in England and Wales, there would not be much problem to create a personalized algorithm.
Adding more decision steps
Based on research, it was decided that four things are crucial when calculating a persons' "risk level". So the algorithm is relatively simple, because it only operates around this for steps. But if additional research was conducted, the algorithm would have more steps, which would make it more complex. Aspects like gender or skin color could be added if proper research would prove their relativity. Again, additional steps implemented into the algorithm could differ based on the country of its implementation.
Combining the algorithm with the security guards knowledge
There are already some people that work in the field that is being explored during this project. They sit by the sectors, observing unusual behavior of the football fans. They have certain rules, but they mostly rely on their own intuition, which is very hard to implement into the computer system and AI. The most efficient way would be to combine the algorithm and knowledge of the stadium workers. It would be pointless to completely replace people with the AI, it would be the best solution to make them work together.
References
Spaaij, Ramón. "The prevention of football hooliganism: A transnational perspective." Actas del X Congreso Internacional de Historia del Deporte. Seville: CESH. 2005.
SCHOLZ, PETR. "Czech Football Hooligans Behavior." Journal of Physical Education and Sport 16.Suppl. 2 (2016): 1089-1094.
Adams, Pascal. "Fans, the Bundesliga and the standing room debate. A Study of the German football stadium experience." (2013).
Milojević, S., and B. Janković. "Police measures and actions in confronting football hooliganism in some European countries." Archibald Reiss Days (2012): 613-629.
Baić, Valentina, Zvonimir Ivanović, and Stevan Popović. "SOCIO-DEMOGRAPHIC CHARACTERISTICS OF VIOLENT FAN GROUPS AT FOOTBALL MATCHES." Acta Kinesiologica: 37.
C. Nelson et al., "Experimental designs for testing metal detectors at a large sports stadium," 2015 IEEE International Symposium on Technologies for Homeland Security (HST), Waltham, MA, 2015, pp. 1-7.
C. Nelson, V. Chaudhary, J. Edman and P. Kantor, "Walk-through metal detectors for stadium security," 2016 IEEE Symposium on Technologies for Homeland Security (HST), Waltham, MA, 2016, pp. 1-6.
B. Sorte, V. Patil and M. Bhamare, "Motion detection using optical flow and standard deviation," 2016 International Conference on Automatic Control and Dynamic Optimization Techniques (ICACDOT), Pune, 2016, pp. 295-300.
S. A. Miraftabzadeh, P. Rad, K. K. R. Choo and M. Jamshidi, "A Privacy-Aware Architecture at the Edge for Autonomous Real-Time Identity Re-Identification in Crowds," in IEEE Internet of Things Journal.
Huang, Haikun, Ni-Ching Lin, Lorenzo Barrett, Darian Springer, Hsueh-Cheng Wang, Marc Pomplun and Lap-Fai Yu. “Automatic Optimization of Wayfinding Design.” IEEE transactions on visualization and computer graphics (2017): n. pag.
Patrick Brown, "Factors Affecting the Probability of Arrests at an NFL Game".
Tamara Pavasovic Trost & Nikola Kovacevic (2013) Football, hooliganism and nationalism: the reaction to Serbia's gay parade in reader commentary online, Sport in Society, 16:8, 1054-1076.
Gebert, Steffen, David Hock, Thomas Zinner, Phuoc Tran-Gia, Marco Hoffmann, Michael Jarschel, Ernst-Dieter Schmidt, Ralf-Peter Braun, Christian Banse and Andreas Köpsel. “Demonstrating the optimal placement of virtualized cellular network functions in case of large crowd events.” SIGCOMM (2014).
Li D., Chen X., Sun Q. (2018) The Study of Population Evacuation Problems. In: Arezes P. (eds) Advances in Safety Management and Human Factors. AHFE 2017. Advances in Intelligent Systems and Computing, vol 604. Springer, Cham.
Jiaming LiuXingqun QiYimeng XuYanda ChenChuang Zhang (2018) Queuing Strategy Optimization with Restricted Service Resources.
A. Melrose, P. Hampton, P. Manu, Safety at Sports Stadia, Procedia Engineering, Volume 14,2011, Pages 2205-2211, ISSN 1877-7058.
Passos, C., da Silva, M.H., Mol, A.C.A. et al. Design of a collaborative virtual environment for training security agents in big events, Cogn Tech Work (2017) 19: 315.
Frosdick, Steve & Newton, Robert. (2006). The Nature and Extent of Football Hooliganism in England and Wales. Soccer & Society. 7. 403-422.
Sources database
https://www.dropbox.com/sh/h1h4kainupheur0/AADrlm7xJLwKwV8EZWMUw5bVa?dl=0

