PRE2017 3 Groep10: Difference between revisions
| Line 90: | Line 90: | ||
From Rotterdam a circle of approximately 48 can be drawn and from that a location can be chosen where the parcel delivery truck has to deliver. From the traffic rush hour maps it seems that in the direction of Utrecht the most traffic jams takes place. Selecting a location in that direction will lead to the extreme where the delivery truck needs the most time. | From Rotterdam a circle of approximately 48 can be drawn and from that a location can be chosen where the parcel delivery truck has to deliver. From the traffic rush hour maps it seems that in the direction of Utrecht the most traffic jams takes place. Selecting a location in that direction will lead to the extreme where the delivery truck needs the most time. | ||
Before proceeding the analysis, a few important notices should be made. The first notice is that the delivery in Utrecht also can be made by approximately 4 other distribution centers; Amsterdam, Den Haag | Before proceeding the analysis, a few important notices should be made. The first notice is that the delivery centers are placed very concentrated in area's where a lot of traffic jams take place. This is a very strategically way to deal with the demands in very population dense area's. A second notice is that because the distribution centers are placed in the strategic way it is done now, analyzing an extreme where the truck has to delivery a package exactly 48 km in the direction of a high potential traffic jam is not possible. The reason for this is that the location from a distribution center can be done by an other distribution center. . | ||
the delivery in Utrecht also can be made by approximately 4 other distribution centers; Amsterdam, Den Haag | |||
But because Google maps doesn't include the average of traffic jams but instead takes the current traffic jam situation. This should be included in the conclusion. | But because Google maps doesn't include the average of traffic jams but instead takes the current traffic jam situation. This should be included in the conclusion. | ||
In the maps below is a circle drawn that is exactly 48 km To select a location that is exactly 48km crow flies is hard so we approximate by selecting a street that is near the edge of the 48 km circle. | In the maps below is a circle drawn that is exactly 48 km To select a location that is exactly 48km crow flies is hard so we approximate by selecting a street that is near the edge of the 48 km circle. | ||
Revision as of 17:00, 14 March 2018
Introduction
Online shopping is becoming increaslingly popular [1], this means that parcel delivery is becoming more and more important in daily life. Nowadays parcels are delivered one by one by people, however, with drones becoming more sophisticated, drones might be able to improve this process.
Problem statement
Can the everyday delivery method of packages be improved by means of drones?
Objectives:
- Human aspect; who is responsible when something goes wrong?
- Delivery method; How accurate can a drone pick up and deliver packages?
- Transport efficiency; what is the time gain of trucks vs drones? Including airspace restrictions.
Stakeholders
Users
The Buyer:
easy and cheap delivery
Society
Neighbourhoods:
Privacy
Enterprise
Supplier:
quick, cheap, safe
Approach, milestones and deliverables
Approach
For this project the work was split in three parts, the literature study, the survey and the models.
The literature study was performed to learn more about the state of the art of drones.
The survey was done to find out how users think about the current parcel delivery system, where they would like to see improvements and which parts of the delivery system are annoying to them.
Several different possible drone delivery systems were modeled, these models give the advantages and disadvantages of these systems, these results were then combined with the results of the survey to determine the best solution.
Milestones
Several milestones were defined to measure our progress during the project. For the literature, the goal is to have at least 25 articles studied and summarised. For the survey the goal is to have at least 75 surveys filled out. For the models, the goal is to be able to have absolute numbers for amongst others the time-gain and costs.
Deliverable
Our deliverable is a report in which all our findings can be found, as well as the results from the survey and the models.
Who’s doing what?
- Pam: responsible for the survey
- Thibeau: responsible for model of truck-drone delivery
- Marc & Nol: responsible for model of beehive system
- David: responsible for the wiki
Assumptions
Backed up assumptions Group 10
Delivery methods
An attempt to improve the current parcel-delivery system by the use of drones can possibly be done in different ways. During this project, the main focus is on three methods that have been researched by Amazon.com already. These three methods are: 1) Distribution centres (aka Beehives) that send out drones. 2) Truck-drone combinations for 'last-mile-delivery'. 3) Zeppelin as distribution centre using drones.
All three methods are explained in detail, also the comparison is made between each method and the current delivery approach.
Current Delivery system
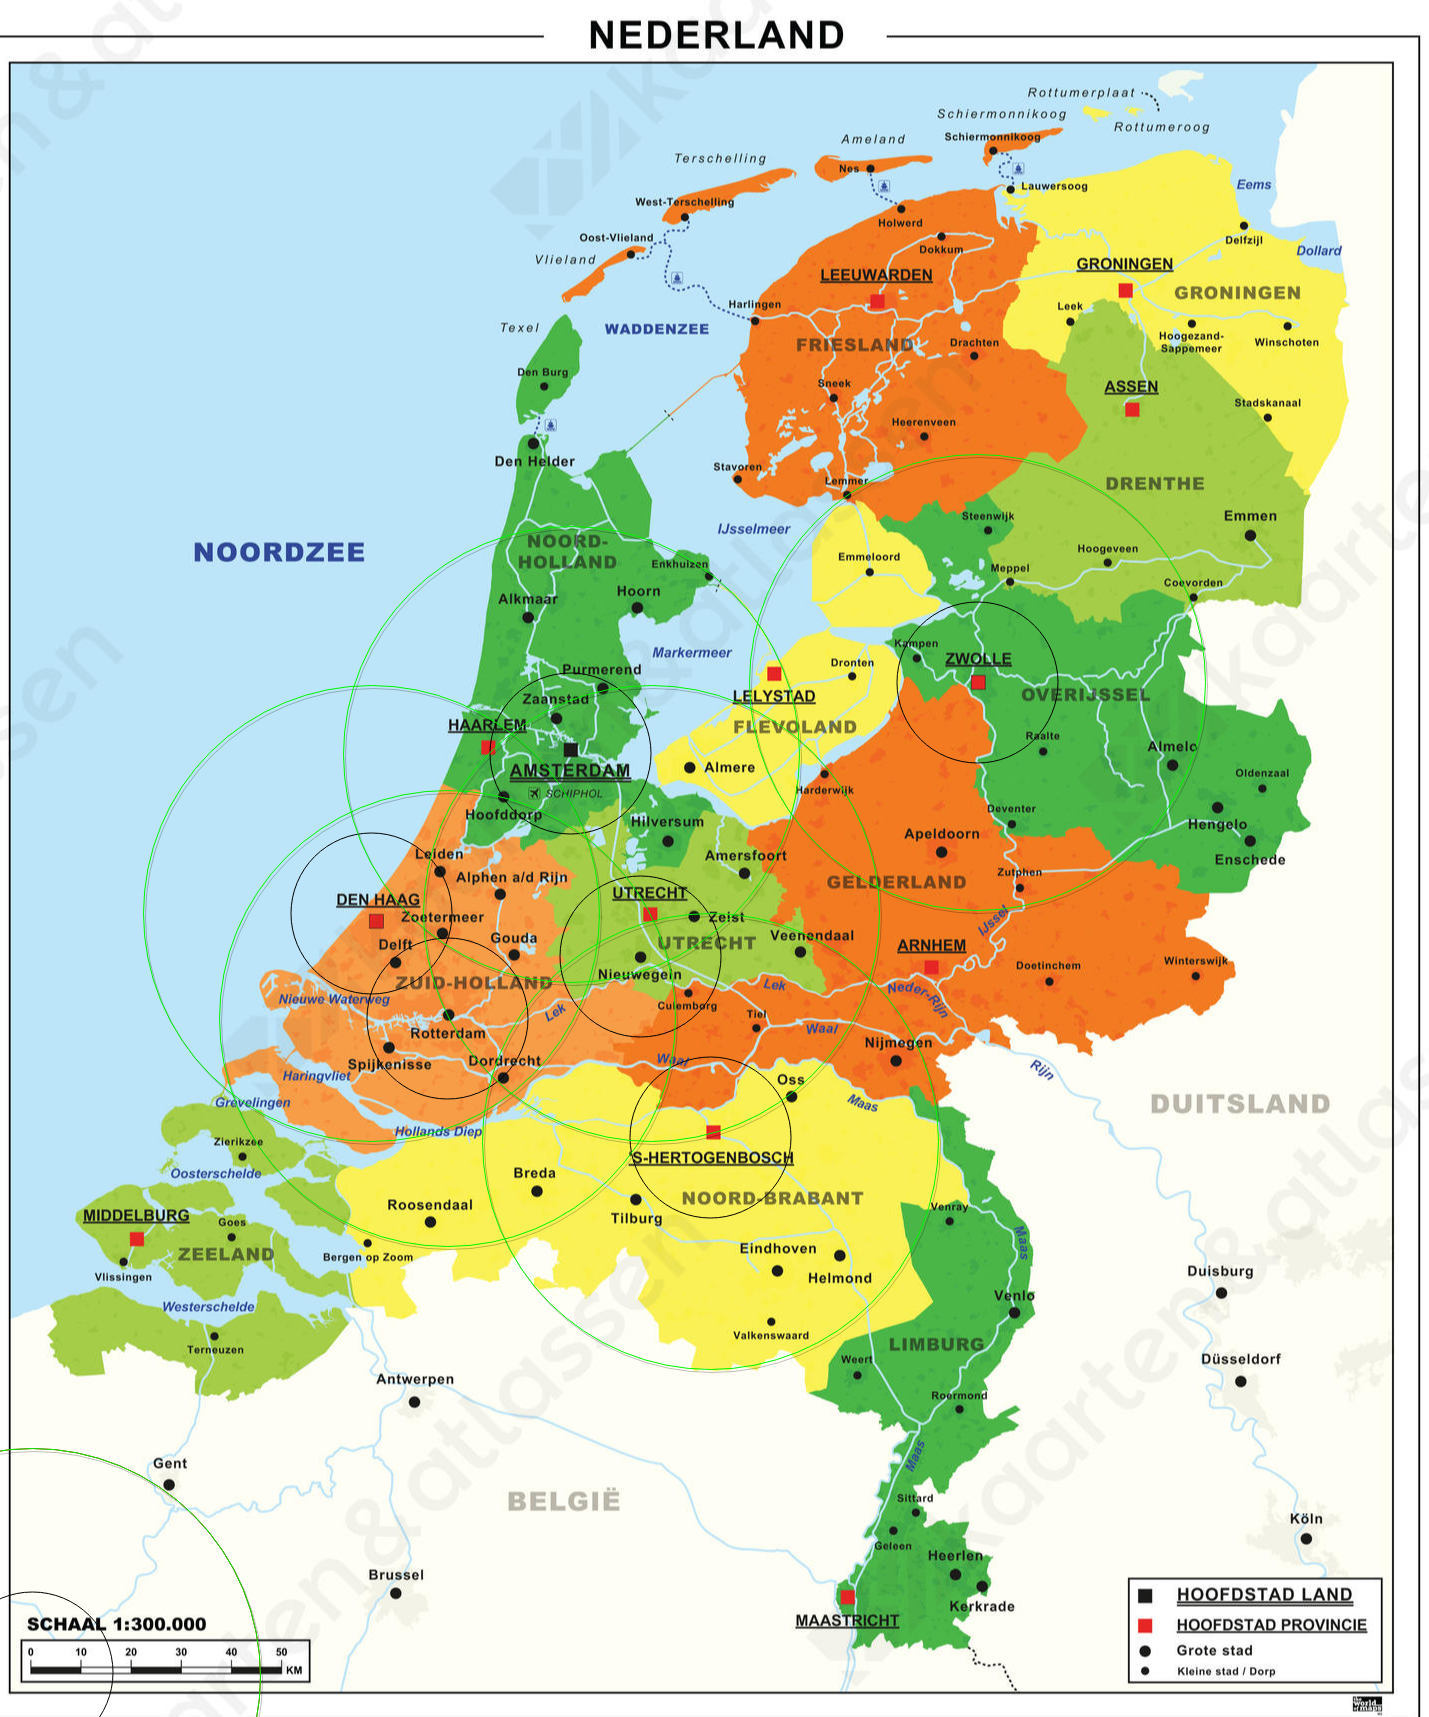
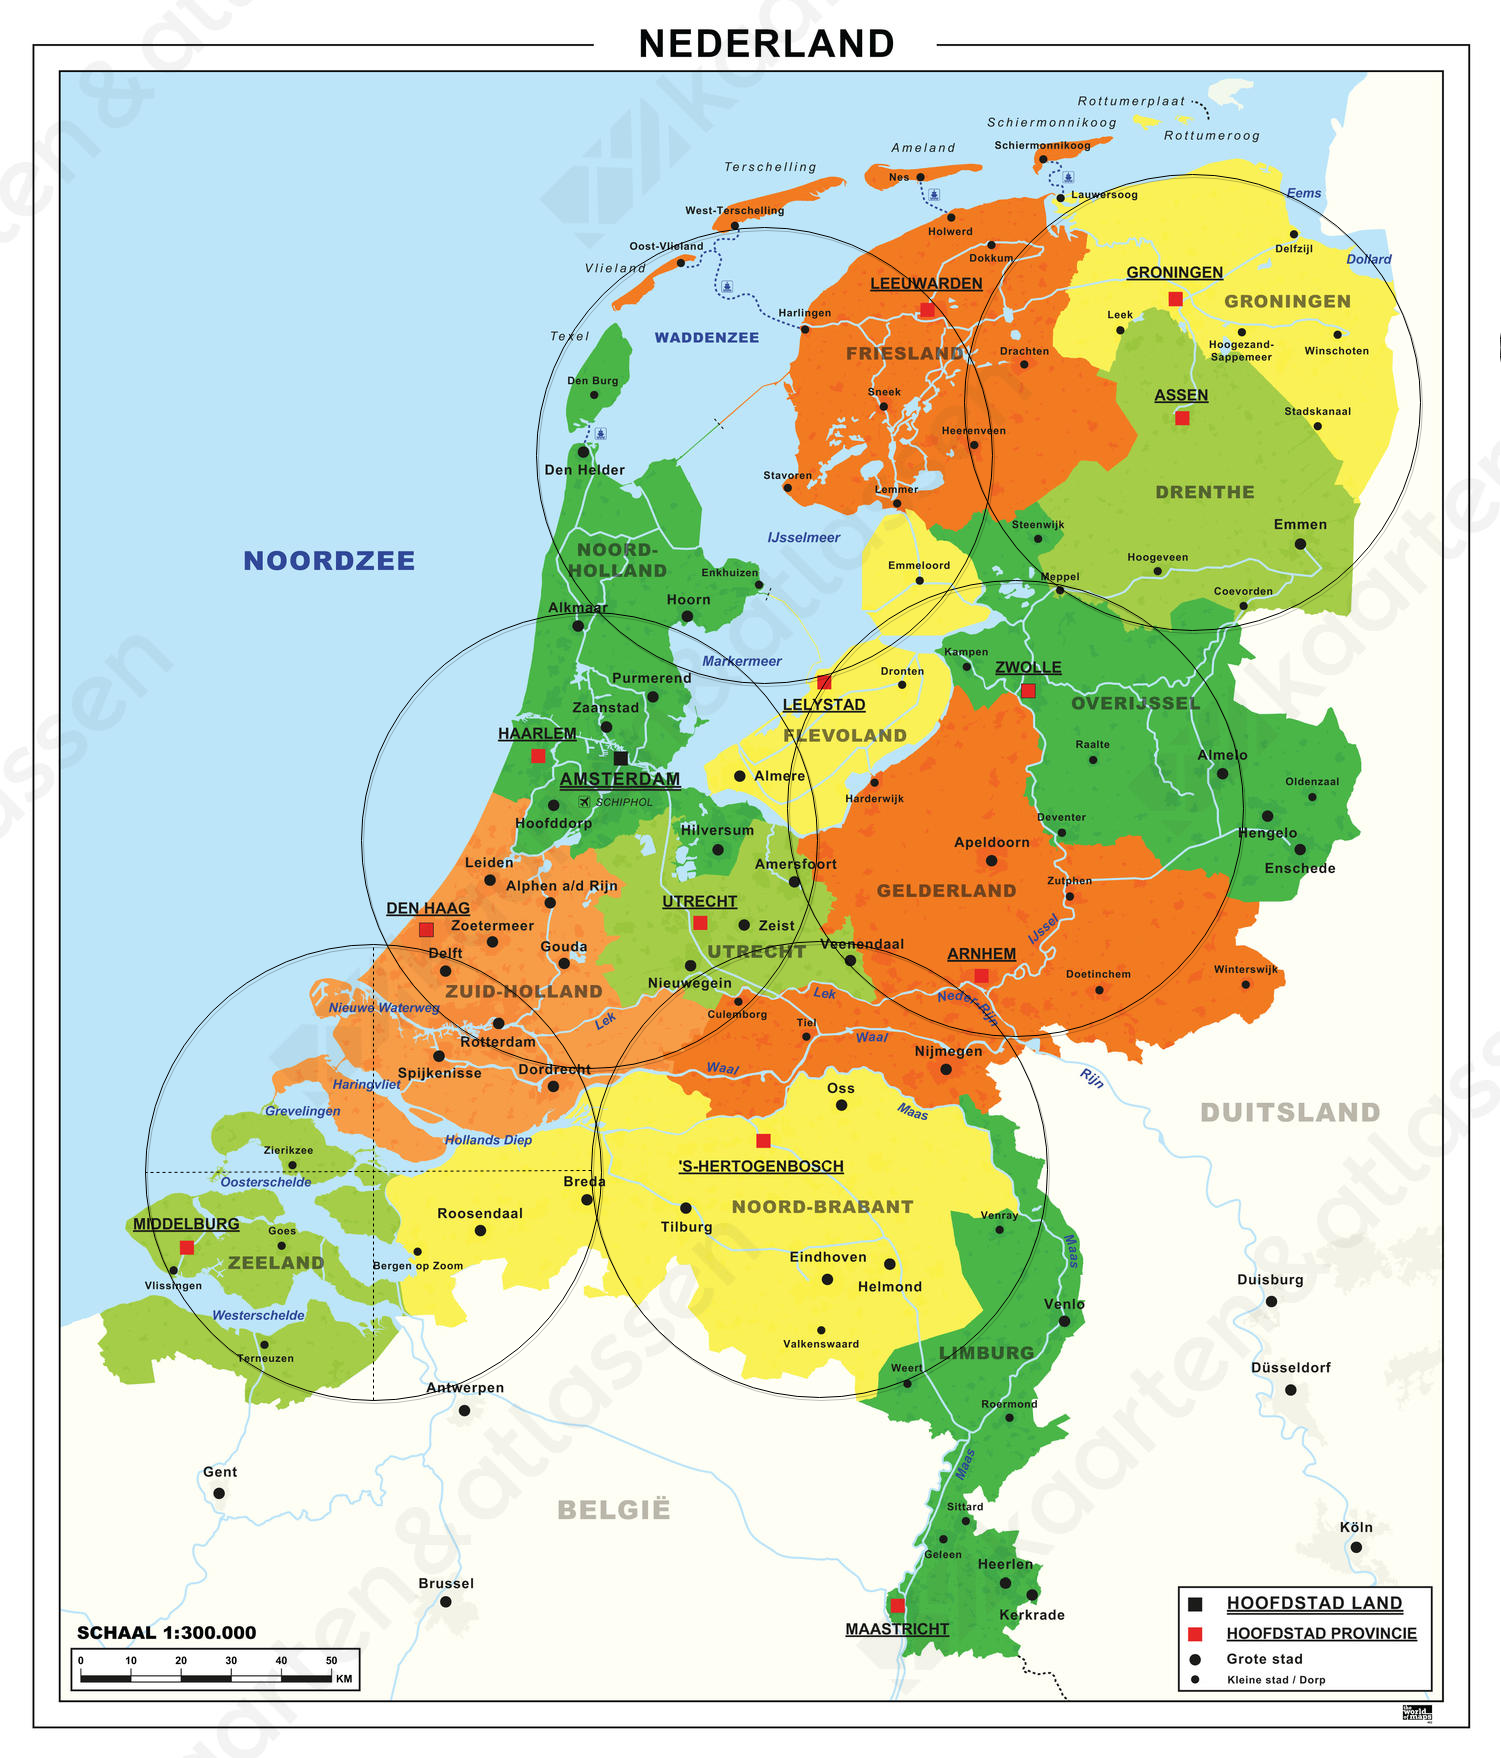
For the current delivery systems the trivial method of parcel delivery trucks is used. These trucks start from distribution centers that are currently scattered by PostNL. The locations are according to the website of PostNL[2] placed in or near the cities:
- Amsterdam (postcodegebied 1000-2199) liniepad
- Den Haag (postcodegebied 2200-2899) Forepark
- Nieuwegein (postcodegebied 3400-4299 & 6500-6999)Mobilisatiedok 4
- Rotterdam (postcodegebied 2900-3399 & 4300-4999) Terbregseweg 300
- Den Bosch (postcodegebied 5000-6499)De Steenbok 2, 5215 ME
- Zwolle (postcodegebied 7000-9999)Anthony Fokkerstraat 2, 8013 NS
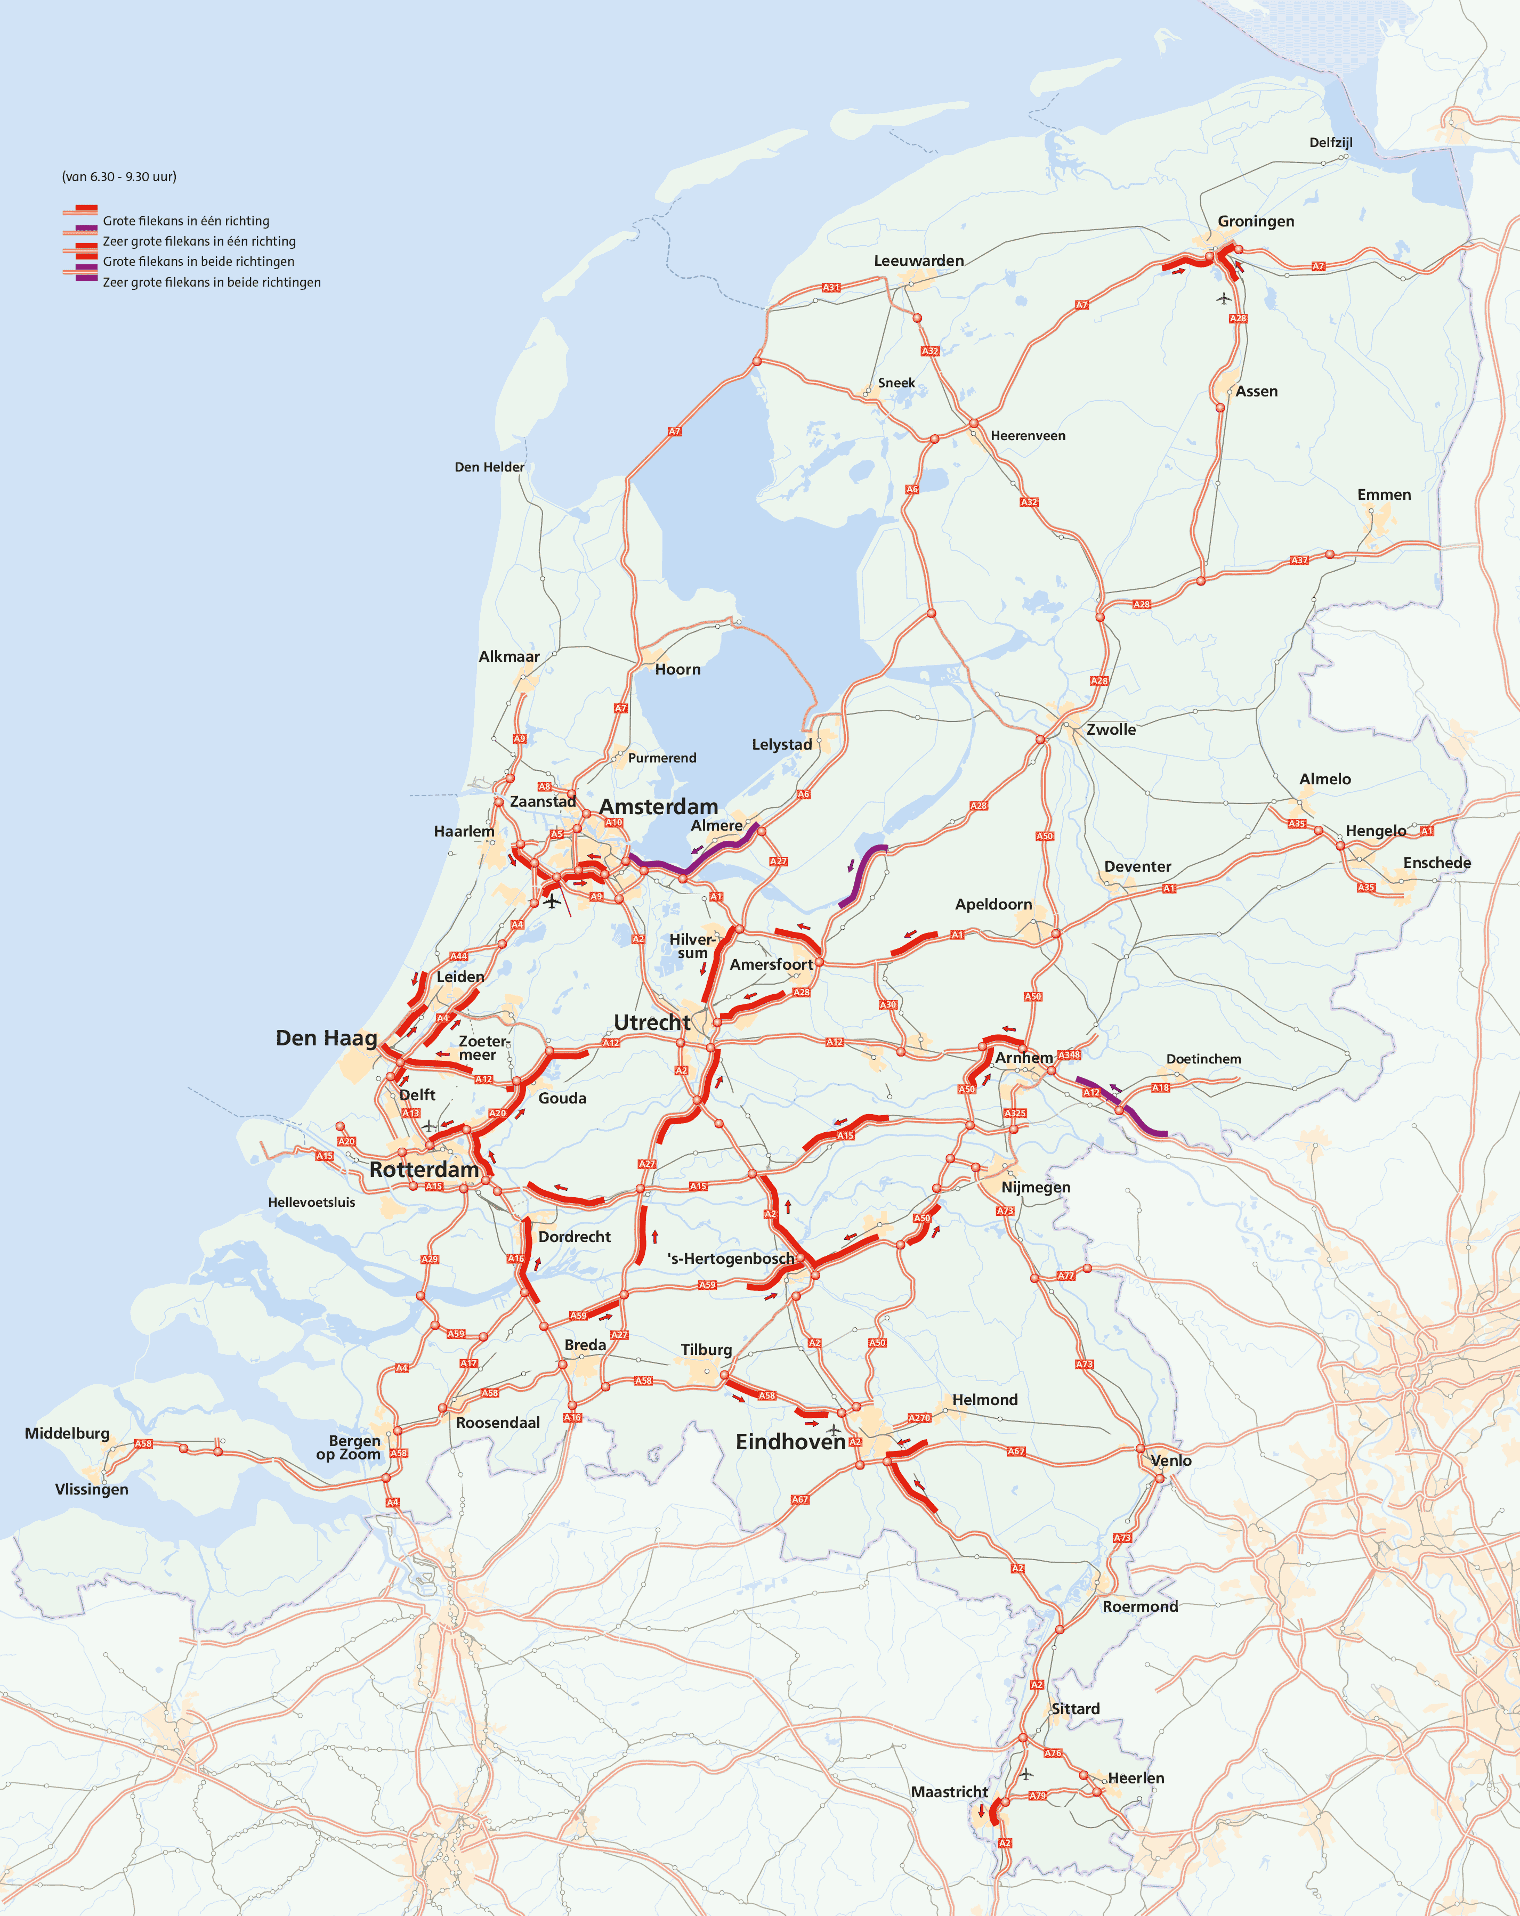
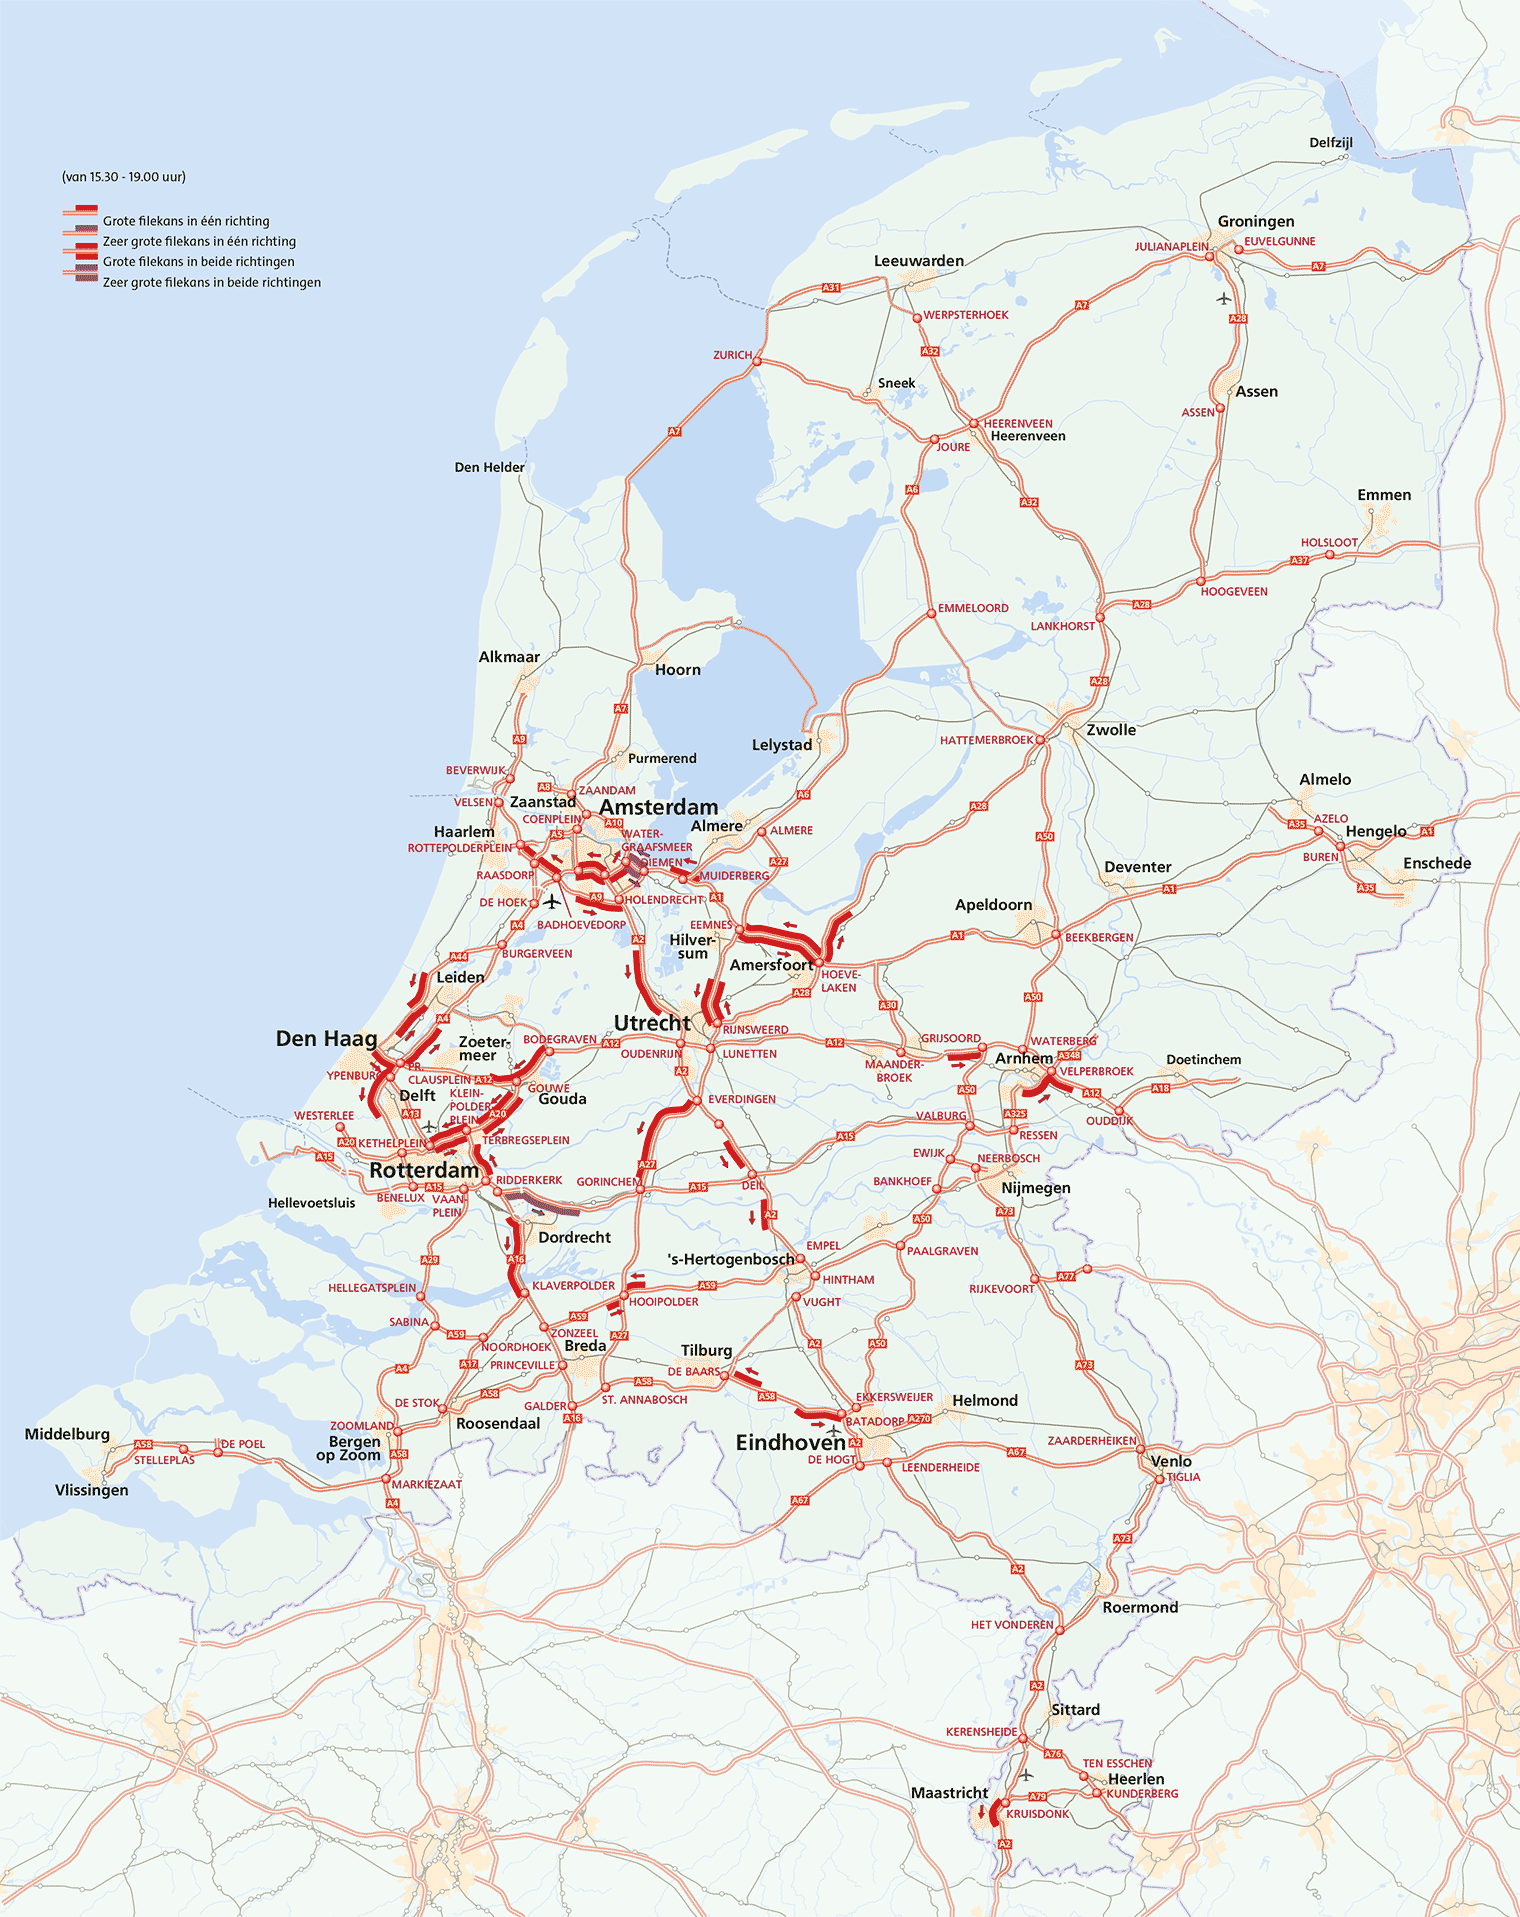
In order the get a analysis on how much time a parcel delivery truck takes when delivering a package, a time delivery interval should be derived showing both extremes in time. This way a quantitative conclusion can be drawn on the time efficiency of delivery trucks From the assumption that the delivery drones will have a radius of 48 Km it can be calculated what the time efficiency of the current delivery system is by checking the travel time of 2 cities of extremes. To see which city is the busiest and which is the least busiest, the following 2 maps show the traffic in the rush hours.
From these maps it can be easily concluded that Zwolle is the least busiest traffic city. For the busiest cities it is a little bit harder to point out the busiest city but it looks like Rotterdam is the busiest when morning and evening rush hour are both taken into consideration. From Rotterdam a circle of approximately 48 can be drawn and from that a location can be chosen where the parcel delivery truck has to deliver. From the traffic rush hour maps it seems that in the direction of Utrecht the most traffic jams takes place. Selecting a location in that direction will lead to the extreme where the delivery truck needs the most time.
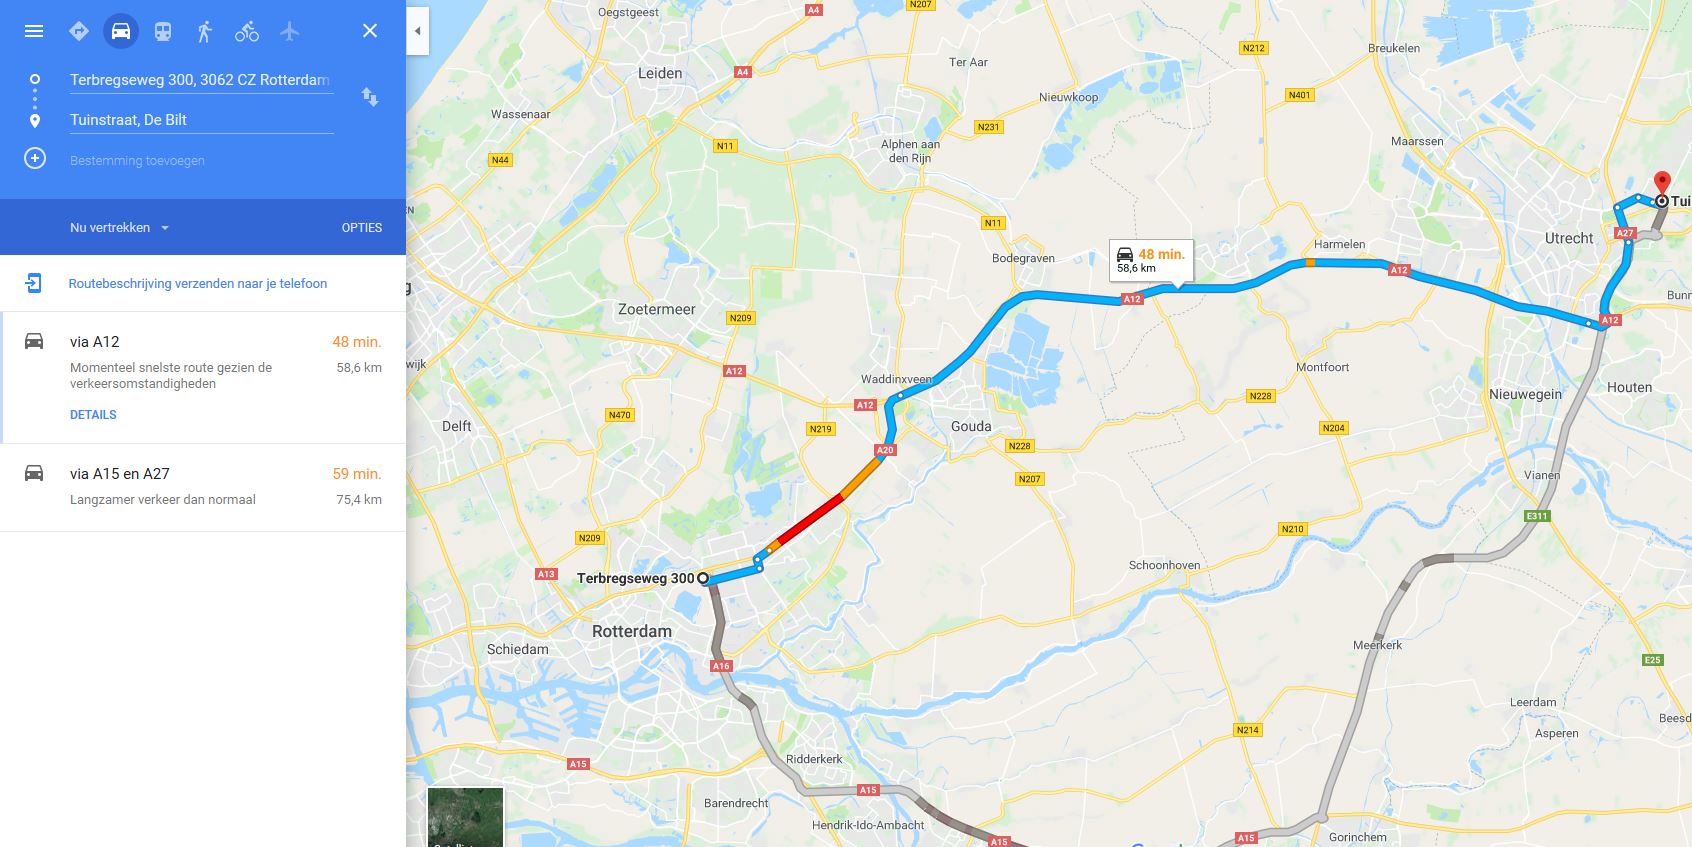
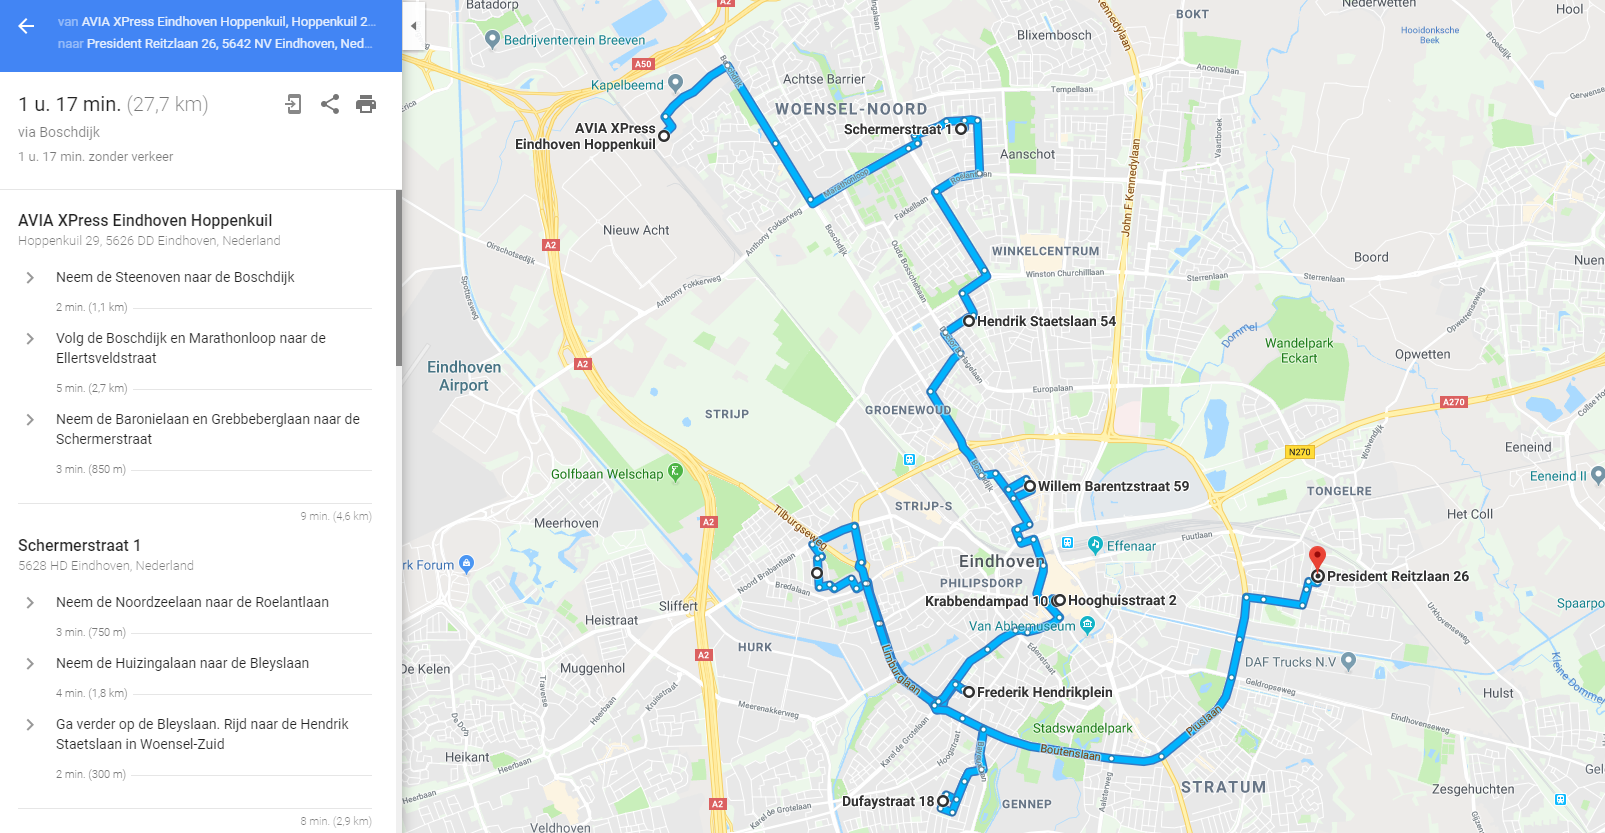
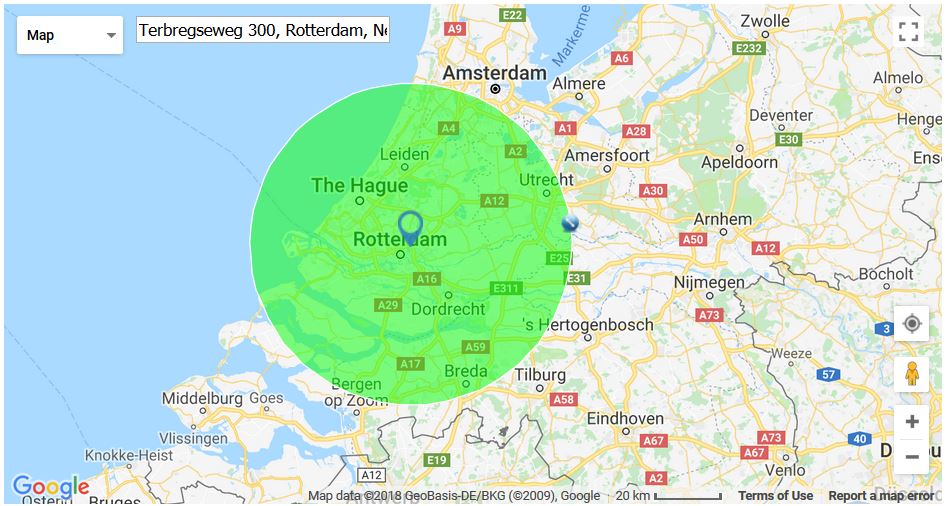
Before proceeding the analysis, a few important notices should be made. The first notice is that the delivery centers are placed very concentrated in area's where a lot of traffic jams take place. This is a very strategically way to deal with the demands in very population dense area's. A second notice is that because the distribution centers are placed in the strategic way it is done now, analyzing an extreme where the truck has to delivery a package exactly 48 km in the direction of a high potential traffic jam is not possible. The reason for this is that the location from a distribution center can be done by an other distribution center. . the delivery in Utrecht also can be made by approximately 4 other distribution centers; Amsterdam, Den Haag But because Google maps doesn't include the average of traffic jams but instead takes the current traffic jam situation. This should be included in the conclusion. In the maps below is a circle drawn that is exactly 48 km To select a location that is exactly 48km crow flies is hard so we approximate by selecting a street that is near the edge of the 48 km circle.
The beehive
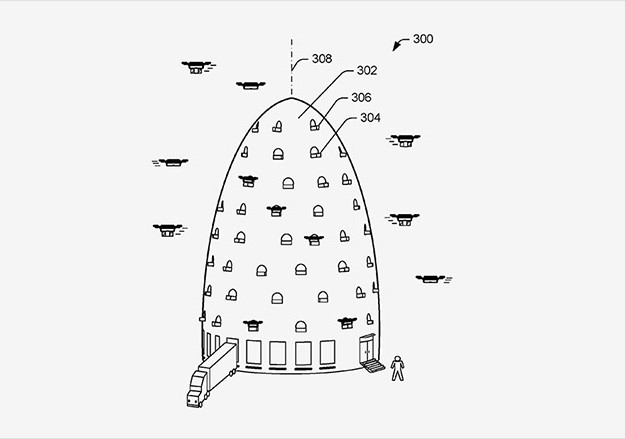
To be able to deploy delivery drones from distribution centres and warehouses, one must come with a smart design so drone deployment and truck deliveries don’t interfere. Today’s distribution centres and warehouses are typically large-volume single-floor buildings, located on the outskirts of the cities. But since drones are not restricted to the ground floor, it could efficiently fly from higher levels. Combining this possibility with the distribution centres results in the beehive.
The beehive is a multi-level fulfilment centre for the delivery drones to take off and land. The beehive facilities would be built vertically so truck deliveries can be deployed from the ground floor while the drones can be deployed from higher levels. In this way the drones are already at a higher level in the sky and therefor restrict the danger of contact with pedestrians. Inside the beehive robots move goods around and conduct maintenance on the drones. And since the facilities are so high, the delivery drones could fly inside as well. Another advantage of the multi-level facility is that the drone activities largely take place on the upper levels, therefor minimizing the noise for surrounding areas. Since the building has multiple levels, it could have a considerably smaller footprint, therefor allowing the beehive to be build closer to city centres. By locating the beehives within or closer to the cities, items may be more quickly delivered to the growing population of people that live in the cities, as well as the large population of people who work in the cities.
The beehives could be used to fulfil thousands of orders a day, in part relying on a large volume of drones that continually pick up deliveries and can recharge their batteries at the site. The beehive has the possibility for a command centre to control flight operations, comparable with a flight control tower at the airport.
Limitations of the drone’s flying radius
To understand the use and implementation of the beehive, it is important to look into the possibilities of the delivery drones. To be able to analyse the situation, the Amazon prima air delivery drone is used. In their current research status, these drones can cover a total distance of 32 kilometres. This means that the drones can fly within a radius of 16 km from the distribution centre on a full battery. Therefor one beehive can cover up a surface of (π * r2=) 803.84 km2. To cover up the entire Netherlands its surface (42.000 km2), this results in a demand of over 52 distribution centres. Comparing this to the current number of distribution centres of PostNL which is 6 centres through the entire Netherlands[[3]], a proposed increase of 875% on distribution centres is necessary. This would be the only way to deliver a package on the maximum distance of 16 km within 30 min. And for every delivery one drone is occupied for a maximum of 90 minutes, taking into account that recharging takes half an hour.
A possible solution for this would be to install wireless charging pads throughout the Netherlands, for example on lampposts. This would increase the distance one drone can cover with 200% since the first time the drone can fly straight for 32 km, before fully charging and then cover another 16km so it can still return to the charging pad. This would mean one distribution centre can cover up a radius of 48 km and therefor a surface of 7234 km2. This would mean that about 6 distribution centres could cover up the entire Netherlands, if ideally distributed over the country. In this case a drone maximally takes about 75 minutes for one delivery and another 75 minutes to return and another 30 min to recharge again, resulting in a total time of 180 minutes. It is a possibility to change the battery of the drone once it is back to the beehive, which can save up the last 30 min with just one action.
However, the Netherlands is not a perfect shape so the surfaces will not align with 6 beehives. Furthermore the distribution centres out optimally over the Netherlands. Currently the furthest distance to the closest distribution centre in the north is about 140 km. A clear overview of the centres of PostNL throughout the Netherlands can be seen in the figure above. The figure aside of it shows a favourable distribution of the beehives with respect to covering the most area. Currently, the centre of the Netherlands can be reached quite well with sometimes more than one distribution centre in range. The outer parts of the Netherlands are actually out of reach, even with the solution of wireless charging pads. Even when applying a second charge moment in the flight, extending the range with another 32 km, not every part of the Netherlands can be reached. And due to this extra charge the total flying time increased with 90 minutes and the delivery time is extended to 135 minutes, causing one drone to be occupied for about 5 hours before be ready for the next delivery.
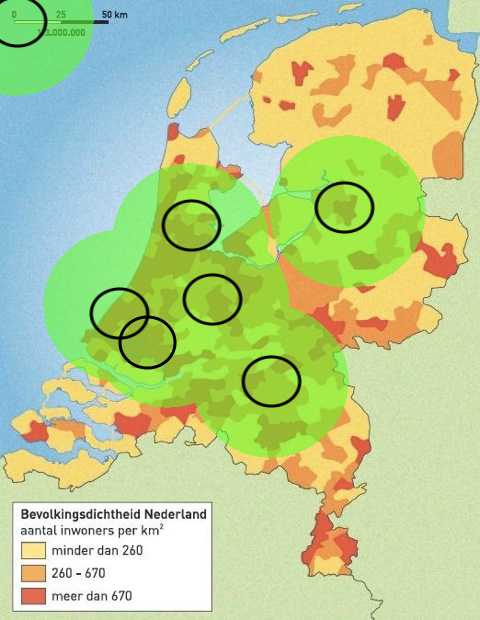
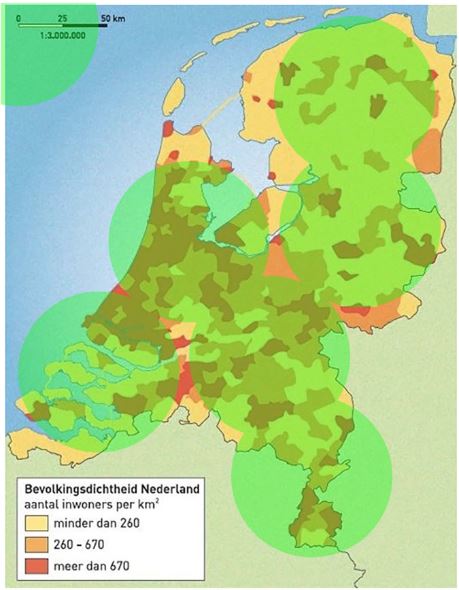
It can be concluded that spreading out 6 beehives throughout the Netherlands is not going to be enough to deliver packages with drones throughout the entire Netherlands within a profitable time. A better implementation for the placements of the beehives would be to look into the population density. To see if PostNL has its distribution centres on favourable places, its warehouses are compared to the population density in the Netherlands. And around these distribution centres, the radius of the drone’s flying distance is drawn, as seen the figure below. The figure aside of it shows a favourable distribution of the beehives throughout with respect to the population density. A few notions can be made when comparing the distribution of distribution centres of PostNL compared to the distribution with respect to population density:
- Currently the distribution centres seem to mainly cover the most densely populated areas. Therefor leaving out a big part of the Netherlands.
- The map that respects the population density still doesn't cover the entire area of the Netherlands
- There shouldn't be a reason for PostNL not to place distribution centres in the northern part of the Netherlands existing of Friesland, Groningen and Drenthe.
Implementation of the beehives
Truck-drone combination
A truck-drone combination is another possible solution. The main idea of this concept is to deploy a number of drones from a stationary truck. By using a strategic position for the placement of the truck, the distance covered by the drones is minimized, hence the delivery time can be reduced. Implementing this method creates a number of difficulties that have to be tackled. First, the capacity of a truck has to be approximated. The amount of drones per truck and the amount of packets per truck have to be determined. To investigate the efficiency, the calculations can be repeated for different numbers of drones and packets per truck. D is the number of drones varying from 5-15 per truck and P is the number of packets varying from 10-50 (ASSUMPTION).
Another important problem is that of the placement of the truck. In this delivery method it is assumed that 1 truck is placed in Eindhoven for all the deliveries at that time. To optimize this placement, different techniques can be used. The two most appealing are:
1) Determine the geographic midpoint.
2) Determine the centre of minimum connecting distance (aka Steiner point).
For the first, the benefit is that the maximal distance from the truck to a destination is minimal. This way it can be prevented that an empty truck is extensively delayed by a single drone that is still enroute to/from the furthest delivery destination. This method is optimal when D is significant compared to P. For the second, the benefit is that the total distance travelled by the drones is minimized. Therefore when D is very small compared to P, the total time can also be optimized.
To compare this method with a traditional parcel delivery, an example scenario is worked out.
The distribution company has P = 10 number of packets that they have to deliver in the city of Eindhoven.
The locations at which they have to deliver are (random locations) shown in Table I.
Calculating the geographic midpoint results in: 51.448193, 5.464556
Calculating the centre of minimum distance results in: 51.443398, 5.465531
The comparison between the traditional delivery system and the truck-drone is computed. Since the distribution centre closest to Eindhoven is located at De Herven in Den Bosch, this means that the vehicle will be approaching from the North. With this in mind, the shortest route for the traditional delivery can be planned, starting at Kerkdorp Acht. The travel time from the distribution centre to Kerkdorp Acht is approximately 25 mins. The delivery route followed from there on is shown in the figure on the right.
This accounts for an additional 1h 17mins for the delivery of all 10 packages. In total this results in a delivery-travel time, for the last package, of 1h 42mins.
Now this can be compared with the truck-drone method.
First of all, the truck has to drive to the geographic midpoint, this takes approximately 30 mins.
From there, the drones will be deployed.
A deployment strategy for the drones is crucial to optimally use both the resources and the time available.
By measuring the total distance from the geographic midpoint to the delivery destinations, we can compute the minimal number of drones required to deliver the 10 packets without recharging.
The distances towards each point are shown in Table I.
| Delivery destinations | |||||||||||||||||||||||||||||||||
|---|---|---|---|---|---|---|---|---|---|---|---|---|---|---|---|---|---|---|---|---|---|---|---|---|---|---|---|---|---|---|---|---|---|
|
Now with a total flight distance of 47410m we know that a minimum of 2 drones is required to deliver all packets without recharging (assuming a total range of 32km for each drone). Table II shows the order of delivery and the (cumulative)time it takes for each delivery. It is chosen to first go for the furthest points, this way at the end of the complete delivery cycle, the latency will be as low as possible.
| Delivery destinations ordered | |||||||||||||||||||||||||||||||||||||||||||||||||||||||
|---|---|---|---|---|---|---|---|---|---|---|---|---|---|---|---|---|---|---|---|---|---|---|---|---|---|---|---|---|---|---|---|---|---|---|---|---|---|---|---|---|---|---|---|---|---|---|---|---|---|---|---|---|---|---|---|
|
So for the truck-drone combination, the drone travel time is 1903.2s, or approximately 32 mins. With all results gathered, Table III shows the final comparison of the traditional method and the truck-drone method.
| Summary | ||||||||||||
|---|---|---|---|---|---|---|---|---|---|---|---|---|
|
Zeppelin distribution centres
Coaching Questions
Simulation model to analyse delivery efficiency
GOAL: Determine the time gain by using drones for the 'last-mile-delivery' instead of using cars/vans.
APPROACH: A number of random locations within a dutch city are picked. These locations are assumed to be destinations for packets to be delivered. Then for both methods the time spent on 'last-mile-delivery' is estimated using simulations.
METHODS: 1) Delivery is done by a typical delivery car or van. The main restrictions taken into account are the speed limits. To start off, delay due to busy traffic isn't explicitly implemented yet in this simulation(this might be done later on). An assumption for this method is that only 1 vehicle is used to deliver all packets within that city (Max 10 packets). For now, the actual delivery (parking the vehicle, getting out, get the package to the receiver) is approximated by a constant that can be altered (1-5mins).
2) Delivery is done by drones. The main restrictions are: cruise speed, obstacles (airfields, power lines, windmills) and max range. Later on, if enough time is left, more complex factors can be simulated such as wind(speeds), changing the travel time and range. Multiple drones can be used for a single city. Can be altered to study efficiency relation. All of these drones are deployed from a single location in the city (place where the truck is stopped). For now, the actual delivery is approximated by a constant that can be altered (30s-2mins).
Determining optimal point for drone deployement
For the drone delivery to be as optimal as possible, the optimal deployment points for the drones needs to be determined. These points can be determined by for instance taking all the delivery locations, then drawing circles with a radius of 16 km around these points. Next the areas with the largest amounts of overlapping circles have to be determined, the optimal route for the truck is then through the points which yield the least amount of driving distance but still make all the deliveries possible. Several things have to be considered here, one of those things is that the truck only has a limited amount of drones inside, so areas with more overlapping circles than the amount of drones present are not more useful than areas with just the right amount of overlapping circles. Also it has to be taken into account that some deliveries to one house may consist of multiple packages. Next to that deliveries only have to be made once, so the circles of already planned deliveries should be ignored while determining other points.
Another approach to determine where to deploy the drones is done by using either the Steiner point or the Centre of mass. Let's say N locations are destinations for delivery of packages. Connecting these N locations in the corresponding Steiner point allows for the smallest total distance of the network. With this property, the delivery time for M drones (where N>M) is lower compared to other points of deployment.
However, if the amount of drones equals the amount of destination locations for a specific deployment area, then using the centre of mass will be more efficient. This is because the max distance to the furthest destination is lower for the centre of mass than for the steiner point.
A script that calculates the steiner point in longitude/latitude coordinates for 3 destination points has been constructed. However its accuracy is not fully on point, enhancing this will be done for the next meeting.
State of the art
Questionnaire
1. Ben je een man of vrouw?
2. Hoe oud ben je? (categorieen geven)
3. Hoogst voltooide opleiding? (basisschool, MAVO,HAVO,VWO,MBO,HBO,WO, anders:..)
4. In wat voor soort omgeving woon je? (stad, dorp, platteland)
5. In welk type huis woon je? (flat, vrijstaand huis, twee onder een kap, rijtjeshuis)
6. Maak je gebruik van de mogelijkheid om online pakketten te bestellen? Zo niet, ga door naar vraag 4. Zo ja, ga door naar vraag 5.
7. Waarom maak je geen gebruik van deze dienst? (meerdere opties kunnen geven)
• de leveringssnelheid van het pakket is niet hoog genoeg
• wil het product liever in de werkelijkheid kunnen beoordelen/zien/aanraken
• niet betrouwbaar
• teveel bezorgkosten
• hinderlijk dat je thuis moet zijn op het moment van bezorgen
• hinderlijk dat je het pakket moet ophalen bij een pick up point
• de Track & Trace van het pakket is niet accuraat genoeg
• het is moeilijk en tijdrovend om een pakket te retourneren of te ruilen
• ik ben bang dat mijn persoonlijke gegevens voor andere doeleinden worden gebruikt
• het voelt als privacy schending dat mensen weten wat ik bestel
• de klantenservice is slecht
• ik kan geen specifieke vragen stellen over het product als ik dit online bestel
• het onjuiste product kan worden opgestuurd
• ik ben bang dat mijn pakket op de verkeerde locatie wordt afgeleverd
• ik vind het personeel onvriendelijk
• ik weet het niet
• anders namelijk:
8. Ben je tevreden over de huidige bezorgmethode? (helemaal niet tevreden, niet tevreden, neutraal, tevreden, heel tevreden)
9. Hoe vaak bestel je gemiddeld een pakketje op jaarbasis (meerdere opties geven)? (0-5,5-10,10-15,15-20,20-25,25-30, meer dan 30)
10. Welke dag bestel je meestal? (werkdag, zaterdag of zondag)
11. Op welk deel van de dag bestel je meestal? (ochtend (6:00-12:00), middag(12:00-18:00), avond (18:00-23:59), nacht (0:00-6:00))
12. Geef met cijfers van 0 t/m 10 aan hoe groot je irritatie is bij de volgende gevallen (van geen tot veel irritatie):
• De leveringssnelheid van het pakket is niet hoog genoeg
• Ik kan het product niet in de werkelijkheid beoordelen/zien/aanraken
• Online bestellen is voor mijn gevoel niet altijd betrouwbaar
• De bezorgkosten van de pakketten zijn te hoog
• Het voelt als privacy schending dat de medewerkers kunnen zien wat ik bestel
• De klantenservice is slecht
• Ik kan geen specifieke vragen stellen over het product als ik dit online bestel
• Het onjuiste product wordt opgestuurd
• Mijn pakket wordt op de verkeerde locatie afgeleverd
• Het personeel is onvriendelijk
• Het is moeilijk en tijdrovend om een pakket te retourneren of te ruilen
• Mijn persoonlijke gegevens zijn bij het bestellen van een pakket voor andere doeleinden worden gebruikt
• Thuis moeten zijn om een pakket te kunnen ontvangen
• Wanneer je niet thuis bent op het moment van bezorgen, moet je het pakket ophalen bij de buren of een pick up point
• Wanneer je thuis bent en het pakket geleverd wordt, is contact met de bezorger onvermijdelijk (bijvoorbeeld wanneer je in je in je pyjama zit, op de wc zit of net de douche in wilt stappen)
• Het tijdsinterval waarop mijn pakket geleverd kan worden is te groot
• De locatie van mijn pakket, die ik via Track & Trace kan volgen, is niet nauwkeurig genoeg.
13. Heb je er problemen mee wanneer je pakketten voortaan door een drone geleverd worden in plaats van door een menselijke bezorger? (ja/nee, waarom:..) (antwoord=nee -> ga naar vraag 10, dan naar 12)(antwoord=ja -> ga naar vraag 10,11,12)
14. Het bezorgen van pakketten met drones kan mogelijk veel voordelen leveren. Geef bij iedere stelling aan of dit voor jou een toegevoegde waarde zou zijn:
• Mijn pakket kan sneller worden geleverd
• Het pakket kan worden geleverd op de locatie waar ik op dat moment ben
• De bezorgkosten van het pakket kunnen verlaagd worden
• Er is meer privacy omdat de bezorger is vervangen door een drone
• Het pakket kan niet meer op de verkeerde locatie worden geleverd
• Er is geen contact met de bezorger meer omdat deze is vervangen door een drone
• Het is makkelijker en sneller om een pakket te retourneren of te ruilen
• Het tijdsstip, waarop mijn pakket wordt geleverd, kan exacter worden aangegeven
• Je kan live zien waar je pakket zich bevindt, dus de Track & Trace verbeterd
15. Stel dat het bezorgen van pakketten met drones de vaste bezorgmethode wordt, zou je dan extra geld betalen voor een menselijke bezorger?
