PRE2016 3 Groep1: Difference between revisions
| (107 intermediate revisions by 6 users not shown) | |||
| Line 11: | Line 11: | ||
=='''Project Description'''== | =='''Project Description'''== | ||
The world population is growing very fast <ref>https://ourworldindata.org/world-population-growth/</ref>. It is expected that the world population will reach 11.2 billion people by the year 2100. Nowadays, around 800 million people will go to bed without a proper meal <ref>http://www1.wfp.org/zero-hunger</ref>. This problem will only grow when the world population increases, since there won't be any space left to grow crops. To tackle this problem, precision agriculture and robotics can be a solution. Precision agriculture is way to reduce the amount of fertilizer, water, seeds and fuel used and increase the overall yield per hectare | The world population is growing very fast <ref>https://ourworldindata.org/world-population-growth/</ref>. It is expected that the world population will reach 11.2 billion people by the year 2100. Nowadays, around 800 million people will go to bed without a proper meal <ref>http://www1.wfp.org/zero-hunger</ref>. This problem will only grow when the world population increases, since there won't be any space left to grow crops. To tackle this problem, precision agriculture and robotics can be a solution. Precision agriculture is a way to reduce the amount of fertilizer, water, seeds and fuel used and to increase the overall yield per hectare so less resources and ground will be needed. | ||
Besides the global impact which precision agriculture and robotics can have on the ecology and the food production, it may of course also be a very interesting investment for farmers to decrease the costs and increase the production without having to expand their fields. | Besides the global impact which precision agriculture and robotics can have on the ecology and the food production, it may of course also be a very interesting investment for farmers to decrease the costs and increase the production without having to expand their fields. | ||
A user-friendly interface will be presented in which the impact of drones on the yield of the farmer will be displayed. This impact will be based on the nitrate level and the precise regulation per subsection of this level when drones are being used. In this model only fields where potatoes are cultivated will be able to be analyzed. The farmer will be able to recreate the field and fill in all the values for every subsection. Then, based on the outputs of the model | A user-friendly interface will be presented in which the impact of drones on the yield of the farmer will be displayed. This impact will be based on the nitrate level and the precise regulation per subsection of this level when drones are being used. In this model only fields where potatoes are cultivated will be able to be analyzed. The farmer will be able to recreate the field and fill in all the values for every subsection. Then, based on the outputs of the model, an advice can be made on whether the usage of drones will be profitable for this field. | ||
=='''Use Aspects'''== | =='''Use Aspects'''== | ||
It is important to check what the USE aspects are when | It is important to check what the USE aspects are when trying to locate possible problems and trying to counter those. The use of this model can have impact in the following USE related topics: | ||
Positive USE aspects | Positive USE aspects | ||
*Societal problem of hunger in combination with the growing world population | *Societal problem of hunger in combination with the growing world population | ||
*Cheaper food for consumers | *Cheaper food for consumers | ||
*Make | *Make the cultivation crops more profitable | ||
The use of this model is directly related to the use of drones in | The use of this model is directly related to the use of drones in agriculture. When it becomes clear (out of the model) that it might be profitable for farmers to use drones, they might be more willing to actually adapt drone technology. This then leads to higher yield with probably a more efficient use of fertilizers. In this way, more food is produced on the same amount of area. This will help to create enough food for the generations to come. When enough food is available this also ensures that prices of food won't rise or will even be lowered due to the market forces. This also helps to make sure that food will become and remain available for all of the world population. A more direct and short-term effect of the use of drones in agriculture is the fact that farming might become more profitable. The use of our model and drones will give farmers a better insight in their production. This insight will reduce inspection time of the farmer, increase the yield and decrease the amount fertilizer which has to bought. This all results in a more profitable company. | ||
Negative USE aspects | Negative USE aspects | ||
| Line 32: | Line 32: | ||
This model and therefore the use of drones won't always have a positive effect on the people who are involved. The main reason to automate things is the reduce costs by replacing men by machines. This is | This model and therefore the use of drones won't always have a positive effect on the people who are involved. The main reason to automate things is the reduce costs by replacing men by machines. This is also the case with the usage of drones in agriculture. When drones take over inspection tasks, less people are needed. There will, however, be more jobs available for drone servicing and data processing. But, these jobs require different skills and knowledge. Some employees might be willing and have the capabilities to get additional education and switch jobs. A thorough search for other jobs has to be done for the employees who can't or won't get additional education. Another possible problem is the rise in investments. When drones are widely adopted, farmers without drones might not produce efficient enough to survive in the market. Therefore it becomes 'obligatory' to use and thus invest in drones. This might result in too high initial investments for new farms. Which in its turn results in a market with only a few big farms that survive, which is a bad thing for the economical landscape. | ||
The following USE-agents are chosen for this project: | The following USE-agents are chosen for this project: | ||
| Line 39: | Line 39: | ||
*Primary users: The primary users for the models are the farmers. They are going to work with the technology as a tool to optimize the food production. | *Primary users: The primary users for the models are the farmers. They are going to work with the technology as a tool to optimize the food production. | ||
*Secondary user: Consultancies and contractors. Consultancies and contractors might start using the model to inform their customers about the possibilities of using drones. | *Secondary user: Consultancies and contractors. Consultancies and contractors might start using the model to inform their customers about the possibilities of using drones. | ||
*Society: Everyone in society might be influenced by this model, because it can lead to | *Society: Everyone in society might be influenced by this model, because it can lead to a higher quantity (and quality) and a lower price of food. | ||
*Enterprise: The companies who produce the drones and software. | *Enterprise: The companies who produce the drones and software. | ||
=='''Project Planning'''== | =='''Project Planning'''== | ||
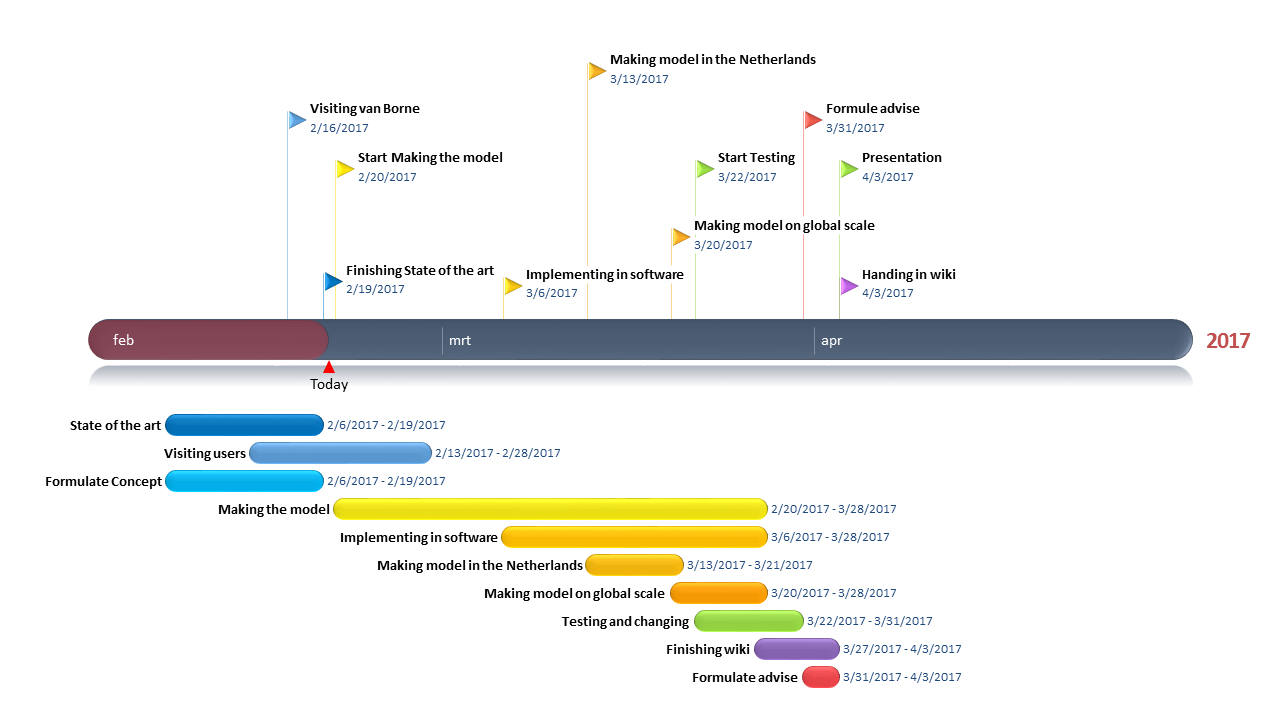
Below are the planning per week and the responsibility division presented. The planning was made at the beginning of the project to provide a guideline to finish the project in a proper manner. The planning was made with the idea to build a solid basis on which the interface/model would be expanded during the project. Of course, the first two weeks were designated to gain knowledge about the field of our project. So, we wanted to explore the current state of the art of robotics in agriculture. Week three was dedicated to contact users and gain insight in the problems of farmers. In this way we could specify our project to the needs of farmers and create a real valuable project. With the information from the farmers we could decide what the exact problem would be that was going to be tackled in the project and thus make a start with the model. Week four and five would be used to implement a model which was suitable for a farm in the Netherlands. Week six was dedicated to extend the model so that it would be suitable on a global scale. Every model needs a lot of testing and tweaking before it is solid enough to present, that's why week seven was dedicated to do that. The model would be finished by week seven, so that week eight could be used to clean up the wiki and prepare the final presentation. | |||
==='''Week Planning'''=== | ==='''Week Planning'''=== | ||
The general approach to create a | The general approach to create a successful project is: | ||
*Research state of the art | *Research state of the art | ||
| Line 114: | Line 117: | ||
==='''Responsibilities'''=== | ==='''Responsibilities'''=== | ||
The following responsibility division was made to streamline the entire project. | |||
[[File:Taakverdeling.png| 600px]] | [[File:Taakverdeling.png| 600px]] | ||
---- | |||
We were able to stick to the project planning for the first three weeks of the project. But after that circumstances forced us to deviate from the original planning. What circumstances caused this and how we continued with the project can be found in section 7 'Models'. | |||
=='''Previous work'''== | =='''Previous work'''== | ||
To create a good overview of what kind of research | To create a good overview of what kind of research has already been done or is going on at the moment a literature study is conducted. This is done for multiple knowledge fields. A more general literature study of what kind of robots are available for agriculture can be found in the Appendix. Besides that, there has been looked into the topic 'Robotics in agriculture' with an eye on the economic impact. Finally, a specific search on the feasibility of drones in agriculture has been done. | ||
==='''Robotics in agriculture'''=== | ==='''Robotics in agriculture'''=== | ||
===='''Graetz, G. & Micheals G.'''==== | ===='''Graetz, G. & Micheals G.'''==== | ||
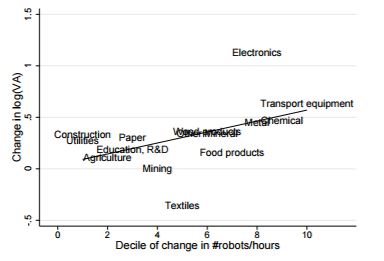
A study by George Graetz and Guy Micheals is called 'Robots at Work'<ref>http://eprints.lse.ac.uk/61155/1/__lse.ac.uk_storage_LIBRARY_Secondary_libfile_shared_repository_Content_Centre_for_Economic_Performance_Discussion_papers_dp1335.pdf</ref>. It discusses the economical impact of industrial robots in general. However, one of the subsections they are talking about are field like mining and agriculture. The research is mainly focused on the impact which robotics has on the economics as it is nowadays. It doesn't predict what the future holds and in what fields it might be more profitable to use robotics and / or drones. The mathematical empirical model they present predicts the following: | |||
# A fall in robot prices leads to an increase in robot density. | # A fall in robot prices leads to an increase in robot density. | ||
# An increase in robot density leads to an increase in average labor productivity in the robot-using sector. | # An increase in robot density leads to an increase in average labor productivity in the robot-using sector. | ||
Robotics in agriculture can't really add a lot of value to the | Robotics in agriculture can't really add a lot of value to the products, which makes the impact of robotics in agriculture minimal according this study. The relation between the added value versus the relative time a robot is used can be seen in the plot underneath. In this plot it can be seen that agriculture has one of the lowest values. | ||
[[File:valueadded_change.JPG|300px]] | [[File:valueadded_change.JPG|300px]] | ||
| Line 135: | Line 145: | ||
===='''Fountas, S. & Pedersen, S. '''==== | ===='''Fountas, S. & Pedersen, S. '''==== | ||
Another interesting work is Agricultural robots-System analysis and economic feasibility<ref>https://www.researchgate.net/profile/Spyros_Fountas/publication/225527407_Agricultural_robots-System_analysis_and_economic_feasibility/links/00b49528e6ebce9eda000000/Agricultural-robots-System-analysis-and-economic-feasibility.pdf</ref>. This paper provides feasibility studies for three different applications: robotic weeding, crop scouting and grass cutting. The study | Another interesting work is 'Agricultural robots-System analysis and economic feasibility'<ref>https://www.researchgate.net/profile/Spyros_Fountas/publication/225527407_Agricultural_robots-System_analysis_and_economic_feasibility/links/00b49528e6ebce9eda000000/Agricultural-robots-System-analysis-and-economic-feasibility.pdf</ref>. This paper provides feasibility studies for three different applications: robotic weeding, crop scouting and grass cutting. The study especially looks into the possible cost reductions in the different scenarios. | ||
The | The scenario of using drones / automated fertilization isn't included in the study. The study only looks at labor intensive tasks and how to save money on that by automating those tasks. This study doesn't include the better growth (and thus higher yield) of proper weeding for instance. And the growth is especially important for our model. | ||
==''' | ===='''Sorensen, C. & Madsen, N.'''==== | ||
In the study 'Organic Farming Scenarios: Operational Analysis and Costs of implementing Innovative Technologies' a research is done to investigate the profitability of weeding robots <ref>http://ac.els-cdn.com/S1537511005000498/1-s2.0-S1537511005000498-main.pdf?_tid=2cc40cfa-1523-11e7-b820-00000aacb35e&acdnat=1490862827_2df60b2f3be11ff61520be60237058c9</ref>. Based on the price of approximately 27000 euros for a weeding robot, the costs of weeding can be reduced to 85 euro per acre. This cost reduction holds when a contractor is hired. This reduction will range from 47 to 56 percent when the weeding efficiency is 75 percent instead of 100. | |||
---- | |||
The above articles are only the tip of the iceberg regarding the articles written about automated agriculture. A conclusion can be drawn that robotics aren't used a lot in agriculture now. Therefore, they haven't contributed a lot to the current turnover in agriculture. There is, however, a lot of research and development going on nowadays. Studies like that of Fountas & Pedersen or Sorensen & Madsen show that when the prices drop and automation becomes more mainstream, robotics in agriculture will probably be profitable. Practically all the tasks which come with growing crops can be automated. Think of seeding, weeding, pesticide control and harvesting. This results in higher yields and more effective farming. | |||
The | |||
==='''Drones in agriculture'''=== | |||
====''' | ===='''Accenture'''==== | ||
The commercial company Accenture is busy creating a Precision Agriculture Service <ref>https://www.accenture.com/_acnmedia/Accenture/Conversion-Assets/DotCom/Documents/Global/PDF/Digital_3/Accenture-Digital-Agriculture-Point-of-View.pdf</ref>. This service includes environmental sensors in the field, NDVI images of drones, sensors mounted on field equipment, weather forecast data and soil databases. This information is combined to produce an harvesting advice for instance. The company ran a pilot with 2000 farmers. An average of 15 percent rise in crop productivity was obtained. | |||
This | This isn't directly linked to the usage of drones, but as drones were a part of the whole system, they contributed to the result. | ||
===='''Informa Economics and Measure'''==== | |||
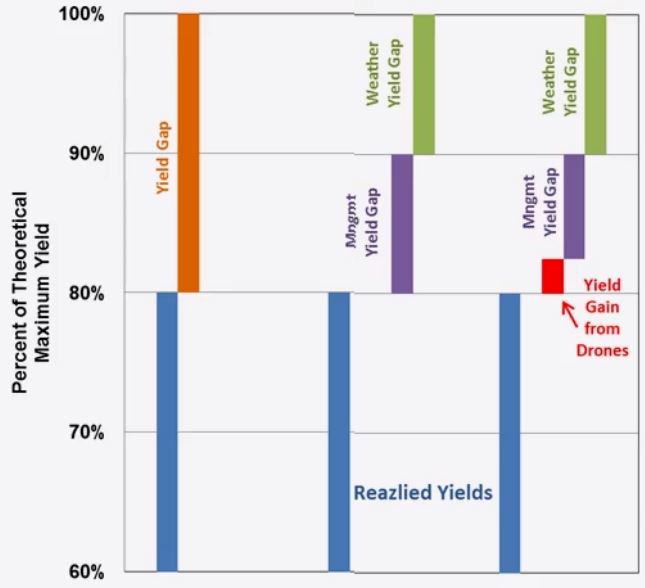
A report of 'Informa Economics and Measure' looked at the profitability of drones in agriculture <ref>http://www.desmoinesregister.com/story/money/agriculture/2015/07/21/drones-farm-savings-agriculture-millions/30486487/</ref>. The research assumes that around 20% of the ideal yield isn't reached. Partly because of weather factors and partly because of management factors. A drone could reduce the yield gap that is formed by the management gap, as can be seen the picture below. | |||
[[File:yieldgap.JPG|300px]] | |||
By giving the farmer a better insight about the condition of the crops, he has more control in the growth of his crops and therefore a better yield will be obtained. It is calculated that the return of investment (ROI) is the highest for corn. This would be 12 dollar per acre. This results in a 2.5% yield gain. Soybeans and wheat are also mentioned, which will create a return of investment of approximately 2.6 and 2.3 dollar per acre. This results in respectively 2.5 and 3.3 % yield gain. These prices are especially interesting for farmers with a lot of land, for instance in the USA. That's also the country where the study is conducted. How these ROI numbers are calculated couldn't be found. | |||
---- | ---- | ||
The thing that became clear when doing the literature study of drones in agriculture was that the potential is big. However there are limitations to the current drone technology and profitability models. Legislation is restricting the use of drones and therefore also the development. The technology isn't streamlined yet, which results in the fact that farmers experience more workload. The data that is obtained by drones isn't a clear advise yet. The farmer still has to do a lot of manual data processing, which is very labor intensive. That is why drones are only profitable on very big farms (>=2000 acres). Predictions about the future and profitability of drones in agriculture are still very rough or give too little information about how the results are obtained. | |||
=='''Potato'''== | |||
==='''Production'''=== | |||
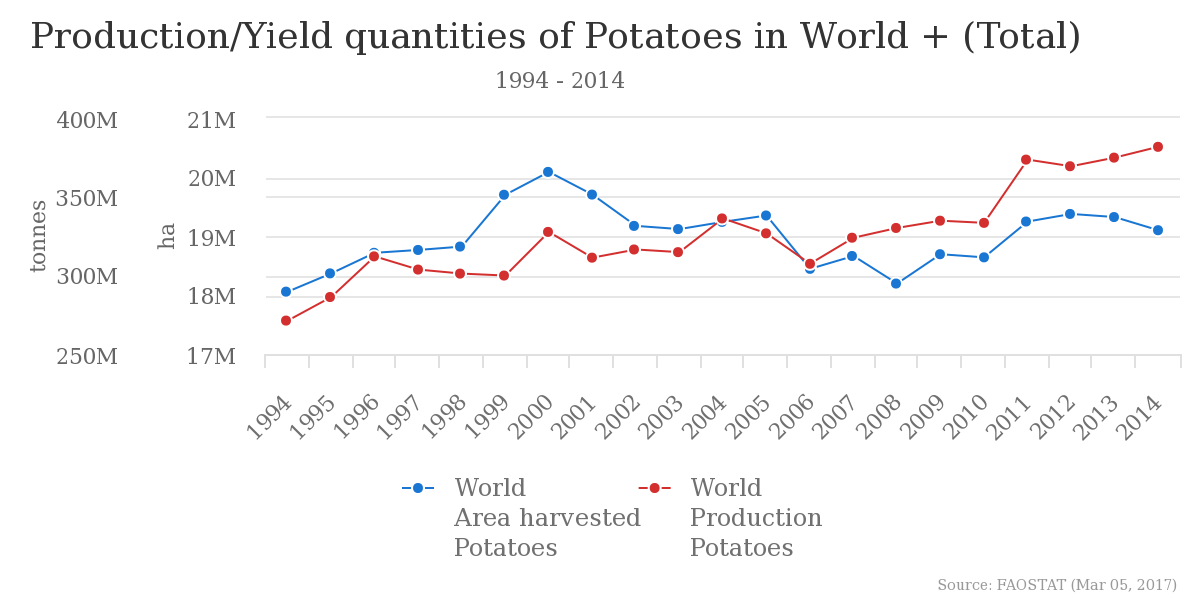
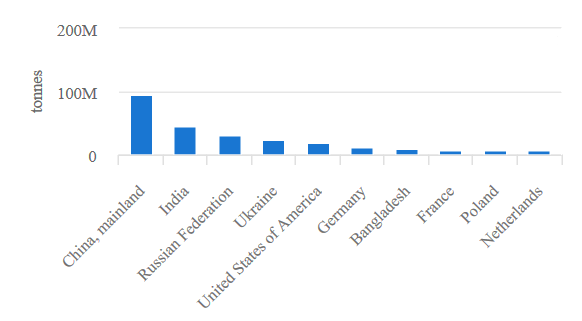
In 2014 the countries with the highest potato production were China and | In 2014 the countries with the highest potato production were China and India (95 and 46 million tonnes relatively)<ref name=fao_visualize>http://www.fao.org/faostat/en/#data/QC/visualize</ref>. The Netherlands ranks 10th, however considering the population of said countries this is quite impressive. With the highest production per head being in Europe. The list is as follows according to “Food and Agriculture Organization of the United Nations”<ref name=fao_home>http://www.fao.org/home/en/</ref>: | ||
{| class="wikitable" border="1" | {| class="wikitable" border="1" | ||
|- | |- | ||
! Country | ! Country | ||
! Production (tonnes) | ! Production (million tonnes) | ||
|- | |- | ||
| China | | China | ||
| | | 95.5 | ||
|- | |- | ||
| India | | India | ||
| | | 46.4 | ||
|- | |- | ||
| | | Russia | ||
| | | 31.5 | ||
|- | |- | ||
| Ukraine | | Ukraine | ||
| | | 23.7 | ||
|- | |- | ||
| | | USA | ||
| | | 20 | ||
|- | |- | ||
| Germany | | Germany | ||
| 11. | | 11.6 | ||
|- | |- | ||
| | | Bangladesh | ||
| 9.0 | |||
|- | |||
| France | |||
| 8.0 | | 8.0 | ||
|- | |||
| Poland | |||
| 7.7 | |||
|- | |- | ||
| Netherlands | | Netherlands | ||
| 7.1 | | 7.1 | ||
|} | |} | ||
[[File:Chart_potatoes_yield.png| 400px]]<ref name=fao_visualize/> | [[File:Chart_potatoes_yield.png| 400px]]<ref name=fao_visualize/> | ||
[[File: | [[File:Chart_Potatoe_Top10_2014.PNG| 400px|]] | ||
The average world farm yield for potatoes was 17.4 tonnes per hectare, in 2010. (America 44.3 tonnes per hectare and some New Zealand farmers 60 to 80 tonnes per hectare) <ref name=fao_potato_cultivation>http://www.fao.org/potato-2008/en/potato/cultivation.html</ref> | |||
==='''The Plant'''=== | |||
The potato plant reaches a length of about 60 cm <ref>https://books.google.nl/books?id=QDrqL2J-AiYC&pg=PA209&dq=potato+plants+60+cm&redir_esc=y&hl=nl#v=onepage&q&f=false</ref> and can produce up to 300 seeds. There are over 4000 varieties of potatoes <ref>http://news.nationalgeographic.com/news/2002/06/0610_020610_potato.html</ref>, but the most cultivated species is Solanum tuberosum. Each potato holds about 322 kJ per 100g<ref>https://ndb.nal.usda.gov/ndb/search/list</ref> | The potato plant reaches a length of about 60 cm <ref>https://books.google.nl/books?id=QDrqL2J-AiYC&pg=PA209&dq=potato+plants+60+cm&redir_esc=y&hl=nl#v=onepage&q&f=false</ref> and can produce up to 300 seeds. There are over 4000 varieties of potatoes <ref>http://news.nationalgeographic.com/news/2002/06/0610_020610_potato.html</ref>, but the most cultivated species is Solanum tuberosum. Each potato holds about 322 kJ per 100g<ref>https://ndb.nal.usda.gov/ndb/search/list</ref> | ||
==='''Growth Process'''=== | |||
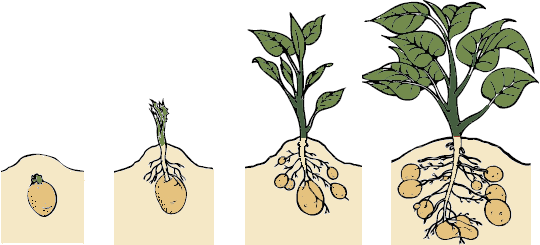
Growth takes place in five stages: | Growth takes place in five stages: | ||
| Line 282: | Line 236: | ||
| 3. Stolons grow (runners, new plants can emerge from these) (stops above 27C) | | 3. Stolons grow (runners, new plants can emerge from these) (stops above 27C) | ||
|- | |- | ||
| 4. Tuber bulking (at this moment these factors are critical: optimal soil moisture and temperature, soil nutrient availability and balance, and resistance to pest attacks) | | 4. Tuber bulking (at this moment these factors are critical: optimal soil moisture and temperature between 10°C and 30°C, soil nutrient availability and balance, and resistance to pest attacks)<ref name=fao_potato_cultivation/> | ||
|- | |- | ||
| 5. Maturation (sugars convert to starches) | | 5. Maturation (sugars convert to starches) | ||
|} | |} | ||
Potatoes are very sensitive to frost and can grow on any type of soil except saline and alkaline and preferably loose (pH 5.2 to 6.4 | Potatoes are very sensitive to frost and can grow on any type of soil except saline and alkaline and preferably loose (pH 5.2 to 6.4)<ref name=fao_potato_cultivation/>. | ||
[[File:Stages.gif| 400px]]<ref name=fao_potato_cultivation/> | [[File:Stages.gif| 400px]]<ref name=fao_potato_cultivation/> | ||
==='''Important growth factors'''=== | |||
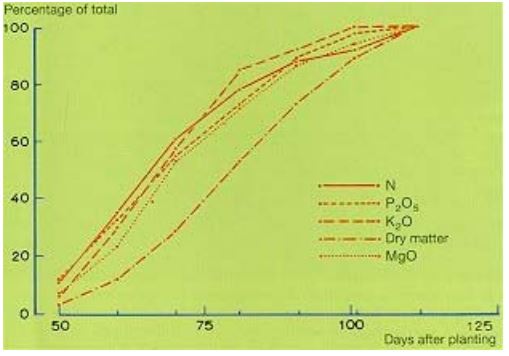
The most important | The most important minerals for potato plants are Nitrogen, Phosphate, Potassium and Magnesium <ref name=potato_cultivation_NL>http://www.aardappelpagina.nl/doc/potatoes_cultivation_netherlands.pdf</ref>. | ||
[[File:verband_opnamemineralen_tijd.JPG| 400px|Relation uptake minerals and days after planting ]]<ref name=potato_cultivation_NL/> | [[File:verband_opnamemineralen_tijd.JPG| 400px|Relation uptake minerals and days after planting ]]<ref name=potato_cultivation_NL/> | ||
| Line 300: | Line 254: | ||
'''Nitrogen''' is absorbed by the potato plant. The amount which is absorbed depends on the stage of the growth. The begin stage absorbs more nitrogen, so this is where nitrogen is the most important. The total amount of nitrogen in the plant when it's fully grown is around 1.5% to 2% of the total weight. This means that an amount of 1.5 to 2% of the weight of the potato plants should be in the soil as nitrogen (about 150-200 kg/ha). Nitrogen is an important element in protein synthesis. Nitrogen deficiency produces light greet plants with stiff leaves and a low yield. | '''Nitrogen''' is absorbed by the potato plant. The amount which is absorbed depends on the stage of the growth. The begin stage absorbs more nitrogen, so this is where nitrogen is the most important. The total amount of nitrogen in the plant when it's fully grown is around 1.5% to 2% of the total weight. This means that an amount of 1.5 to 2% of the weight of the potato plants should be in the soil as nitrogen (about 150-200 kg/ha). Nitrogen is an important element in protein synthesis. Nitrogen deficiency produces light greet plants with stiff leaves and a low yield. | ||
'''Phosphate''' is used in the entire growing | '''Phosphate''' is used in the entire growing process, but like nitrogen, it is absorbed the most in the beginning of the growth process. About 60 kg/ha of Phosphate is absorbed. About 0.7% of the total mass of a potato plant consists of Phosphate, so this amount has to be present in the soil. About 80% of the phosphate is concentrated in the stem of the plant. This amount is removed when the plants are harvested. The soil depends in which amount phosphate is absorbed, because phosphate is not absorbed very readily by the potato plant itself. More acid soils help to absorbed the phosphate. A low phosphate deficiency results in dirty green colored leaves and unsatisfactory growth. | ||
'''Potassium''' is | '''Potassium''' is mainly absorbed in the period when the plant emerges to the point were the stem reaches its maximum length. This is a fairly short period, as can be seen in the above graph. Low levels of potassium in the leaves doesn't have as much of a negative effect as low levels of nitrogen. About 350 kg/ha of potassium is absorbed, which is a lot more than for instance Phosphate. Potassium deficiency in the leaves results in dark green and bronze discolorations. In the long term the plant might become necrotic, which is a form of cell death. Potassium deficiency in the tubes results in easy bruising. | ||
'''Magnesium''' is not absorbed much, but | '''Magnesium''' is not absorbed as much, but it has a big influence in the growth. About 30 kg Mg/ha is absorbed, mainly before the main stem has reacted its full length. Thus the magnesium must be present before this length is reached. Potassium impedes magnesium absorption. So, excessive use of potassium often results in magnesium deficiency. Magnesium deficiency results in more necrotic veins at the oldest leaves. | ||
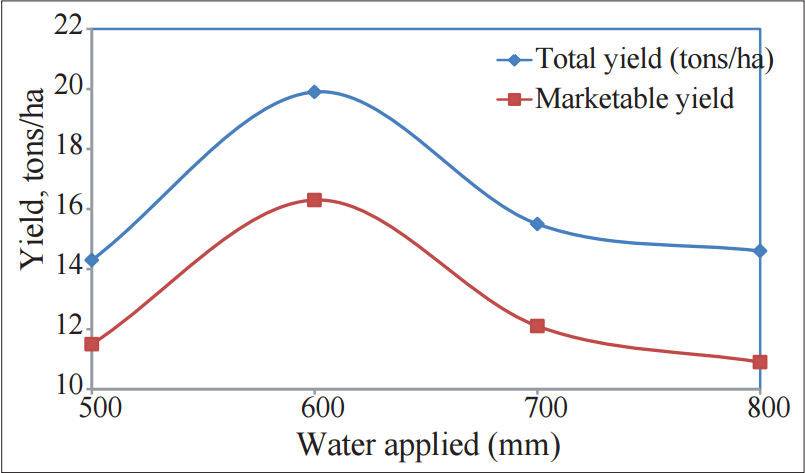
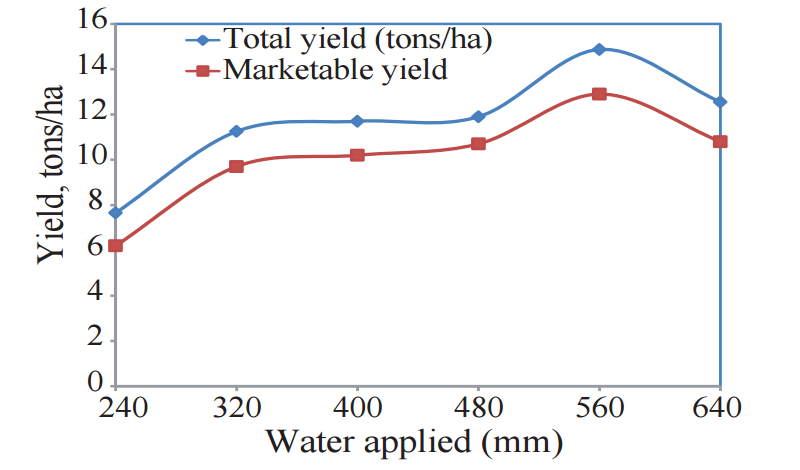
'''Water''' deficiency reduces the foliage growth and the efficiency of the photosynthesis. Furthermore, water deficiency stimulates maturity, which results in smaller tubes. Below are two graphs of the influence of water on the yield of potatoes in the season 2008/2009 (left) and 2009/2010 (right). | '''Water''' deficiency reduces the foliage growth and the efficiency of the photosynthesis. Furthermore, water deficiency stimulates maturity, which results in smaller tubes. Below are two graphs of the influence of water on the yield of potatoes in the season 2008/2009 (left) and 2009/2010 (right). | ||
| Line 313: | Line 267: | ||
<ref name=water_potato_1/> | <ref name=water_potato_1/> | ||
'''Soil | '''Soil pH''' influences the yield of potatoes directly. To show the effect, below is a table with results from a study that adapted the pH level of the soil to see the resulting yields, done over multiple years: | ||
[[File:Potato_ph_inf_1.png| 400px]] | [[File:Potato_ph_inf_1.png| 400px]] | ||
| Line 319: | Line 273: | ||
There are | There are more parameters that influence the growth of potatoes. Think about temperature, light intensity and air quality. These parameters can be measured with drones, but can't be adjusted by the farmer. So it is not useful, in the scope of this project, to look at the impact of those values. | ||
=='''Models'''== | |||
==='''Initial model'''=== | |||
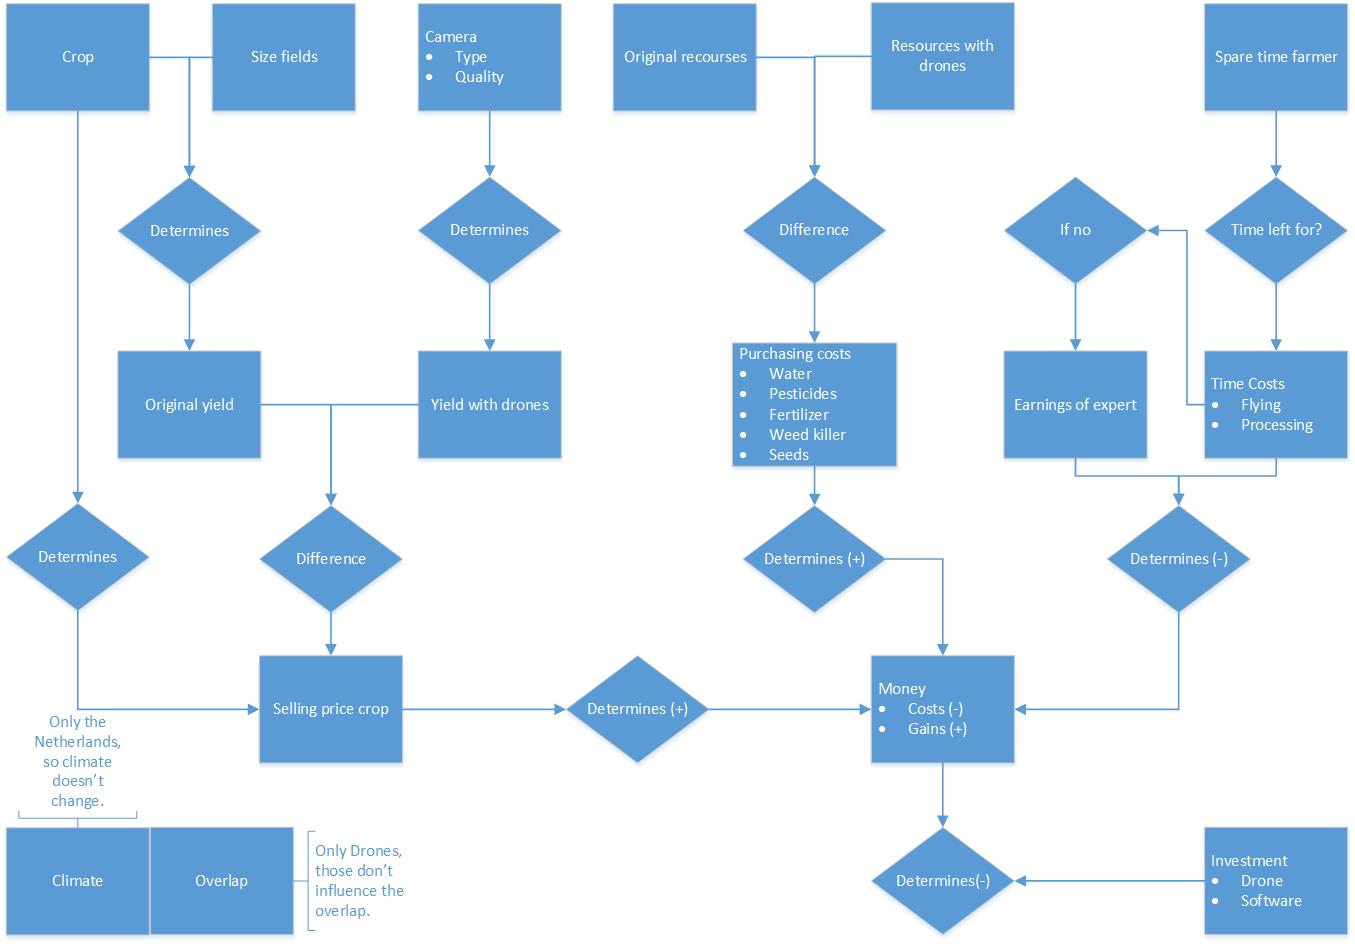
The initial setup for the model would consist of an ecological and economical impact precision agriculture would cause. The focus lay on drones and the use of image processing on the pictures drones can take of fields. This would include all parameters that the could be measured with this technique. Also, the idea was to do this for multiple crops in the Netherlands. A Visio chart was made to illustrate all the variables and relations were present, this chart can be seen below. | |||
[[File: | [[File:First draft model.jpg | 1000px]] | ||
==='''Simplifications'''=== | |||
It was seen quite soon that the idea we had was too big of a task for this project, hence we had to simplify the model so a result could be gotten in time. One of those simplifications was the use of only one crop instead of making the model for several crops. This crop has become potatoes, since the usage of drones is very likely to work on potato fields. This simplification was made since it seemed very hard to find relations between the several factors for growth and the resulting yield. This lead to another simplification, namely not taking into account all growth factors. Nitrogen has been chosen as the growth factor that the model is going to analyze. Nitrogen is chosen, because it is one of the most important nutrients for potatoes to grow and because it can already be measured quite good with the use of cameras with infrared and near-infrared. This already implicates that also only one sort of camera is used, namely one that has the standard RGB and an added infrared and near infrared. One of the other big simplifications that has been made is that the extra time it costs for the farmer to use all this new technology isn't taken into account. This was one of the choices that had to be made to change the focus from an exact economical gain to an estimated growth in yield as outcome. This change had to be made since an exact economical outcome seemed to be to difficult for the amount of time available. | |||
The | ==='''Final model'''=== | ||
===='''Input'''==== | |||
The input of the model will consist of some old data from the farmer and new data received from soil measurements. The data the farmer has to give to the model are the old yield of the land, the nitrogen levels belonging to this old yield and the current nitrogen level for every subsection, received from soil measurements. Finally the most important input given by the farmer, this is the shape of the land that has to be analyzed, this can be done by dragging the subsections (squares) in the model to form the (roughly) correct shape. | |||
===='''Processing the data'''==== | |||
For the processing the data some formulas are used, the main one being the one described in subsection "Nitrogen/growth-function", which is y = -0,0005x<sup>2</sup> + 0.297x + 5.9366. This formula won't of course hold for every field and every situation, that is why the first step of the model is to correct the formula according to the old yield and nitrogen levels the farmer set as an input. The formula will be made to return the old yields the farmer gave in when the old nitrogen levels are used as the x-value. Furthermore the top of the graph will be put on the optimal nitrogen level, which is calculated by the formulas seen in the table displayed below. | |||
The | |||
{| class="wikitable" border="1" | {| class="wikitable" border="1" | ||
|+ style="text-align: left;" | '''Formulas for the optimal nitrogen level, for potatoes'''<ref>http://www.kennisakker.nl/kenniscentrum/handleidingen/teelthandleiding-consumptieaardappelen-bemesting</ref> | |||
|- | |- | ||
! | ! scope="col" | Destination !! scope="col" | Guideline(kg N/ha) | ||
! | |||
! | |||
| | |||
|- | |- | ||
! | ! scope="row" | Consumption potatoes, clay ground | ||
| 285 - 1,1 * (N-mineral 0-60 cm) | |||
| | |||
| | |||
|- | |- | ||
! | ! scope="row" | Consumption potatoes, sand ground | ||
| 300 - 1,8 * (N-mineral 0-60 cm) | |||
| | |||
|- | |||
|} | |} | ||
<sup>a</sup> | In these formulas the input is the current nitrogen level in the first 60 centimeters of the soil. | ||
When the formula is set correctly the fertilization level in the case without precision agriculture will be calculated from the average nitrogen level of the field. This fertilization level is obtained from the equation in the table shown above again. The fertilization in this case is the same over all subsections, this leads to a difference in yield per subsection. All these yields will be calculated and the average of all those subsections will be taken as the yield in kg/ha. | |||
After this, the case in which precision agriculture would be used will be reviewed. Firstly the nitrogen level per subsection will be used to calculate the fertilization per subsection, again using the equations in the table above. This means that the nitrogen level at every place in the field will be the same, so the yield is the same for every subsection. The average yield of the case in which precision agriculture would be used is then the yield of one subsection in kg/ha. | |||
===='''Output'''==== | |||
The outputs of the model will be the average yields in the two cases, with and without precision agriculture. Another output of the model will be the amount of fertilizer used for each of the two cases. With this information a conclusion can be made about the use of precision agriculture on the field of this farmer. | |||
===='''Nitrogen / growth - function'''==== | |||
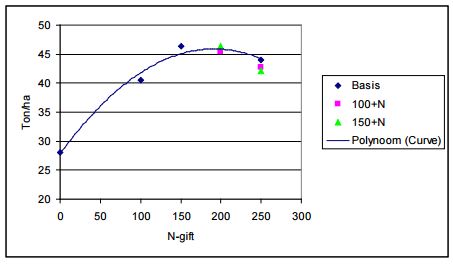
It is very complex to predict the growth of a potato plant. A lot of variables influence the quantity and the quality of the yield. To make the problem workable we will only look at the relation between nitrogen and the yield. A lot of research is done on this topic, but every research has other boundary conditions, such as species, soil, weather, etc. These conditions deviate a lot between different tests. To create a basis for the model we tried to choose an average research. The research "Geleide N-bemesting voor aardappelen op basis van gewasreflectie-metingen" of F. van Evert showed relation between the amount of nitrogen and the yield. The research consisted of multiple different sub-tests with other boundary conditions. After a thorough comparison we thought that the sub-test 'Rusthoeve 2010 Consumptieaardappel' was the best test to use. | |||
This sub-test consisted of multiple test fields near each other on which different amounts of nitrogen were applied. The species 'Victoria' was grown which is suitable for direct consumption or french fries. The test was conducted at farm 'Rusthoeve' in Colijnsplaat in Noord-beveland. The soil consisted of 1.7% organic material and the phosphorus conditions were good (PW 37; P-AL 51). | |||
At the end of the growing period the yield per sub-field was inspected. The result can be seen in the following plot. | |||
[[File:rusthoeveresultaten.JPG| 600px]] | |||
This graph gives the yield versus the amount of nitrogen added. For the model however, the relation between the yield and the total level of nitrogen is needed. To get this the y-values are increased with the base level of nitrogen for the field of the experiment. This base level is calculated by using the guideline formula in the table seen above. This table uses the optimum for the nitrogen level and so the optimum of this experiment should give the amount of nitrogen. The highest yield for this experiment is obtained with a nitrogen addition of 185 kg N/ha This results to the following equation: | |||
N-mineral 0-60cm = (285-185)/1.1 = 90.90 | |||
When this base level is added to the nitrogen addition in the data the following equation can be obtained from a fit: | |||
y = -0,0005x<sup>2</sup> + 0.297x + 5.9366 | |||
In which y is the yield [ton/ha] and x the amount of applied nitrogen [kg/ha]. This fitted function has a R<sup>2</sup> of 0,9717, which is an indication that the result is a good fit ( R<sup>2</sup> = 1 is a perfect fit). | |||
===='''Assumptions'''==== | |||
* The potato species chosen is Victoria, since the data used for the equation seen above was based on this species. | |||
* All the other parameters influencing the yield and the growth of the plants are assumed to be controlled and on a sufficient level. | |||
* The equation is based on an experiment on clay ground, it is however assumed that the relation can be used for sand as well as long as the offset is changed for the particular field based on the yield of earlier years. | |||
* The previous assumption is made for all the factors influencing the growth, so it is assumed that the equation holds for every situation and that only the location of the graph changes for different situations. | |||
===='''Software implementation of the model'''==== | |||
In order to get a working software implementation of the model firstly a platform is needed. HTML, CSS and JavaScript have been chosen to create a platform for the model to be implemented in. This also means the model can be viewed as a regular web page meaning there is no need for the user to download extra software to use it. The model requires inputs and outputs. Thus the site is divided in 2 blocks, the left being input and the right being output. The thing that drones are useful for is treating the land in multiple sections. So instead of bringing for example the average nitrogen level to the desired values drones can help to bring every subsection to the desired values. Therefor there is the need for a method to input values per subsection. A grid is designed, which allows each field to be turned on and off and a value will be able to be filled in in the active subsections. The website also allows for an image to be uploaded and re-scaled so it is easier for the farmer to select the fields which best define his land. | |||
==='''Manual'''=== | |||
The website can be visited at https://lkeijzer.nl/potatoe/. The website is currently tested and confirmed working with Firefox and Google Chrome. The website does not work on mobile platforms, users using mobile platforms will be warned when opening the site. | |||
The application has four stages: The parameter input stage, the drawing phase, the soil sample input stage and the calculation phase. Each phase is accompanied by a screen. The first three stages require user input, while the last stage uses these inputs to calculate the resulting difference in yield. | |||
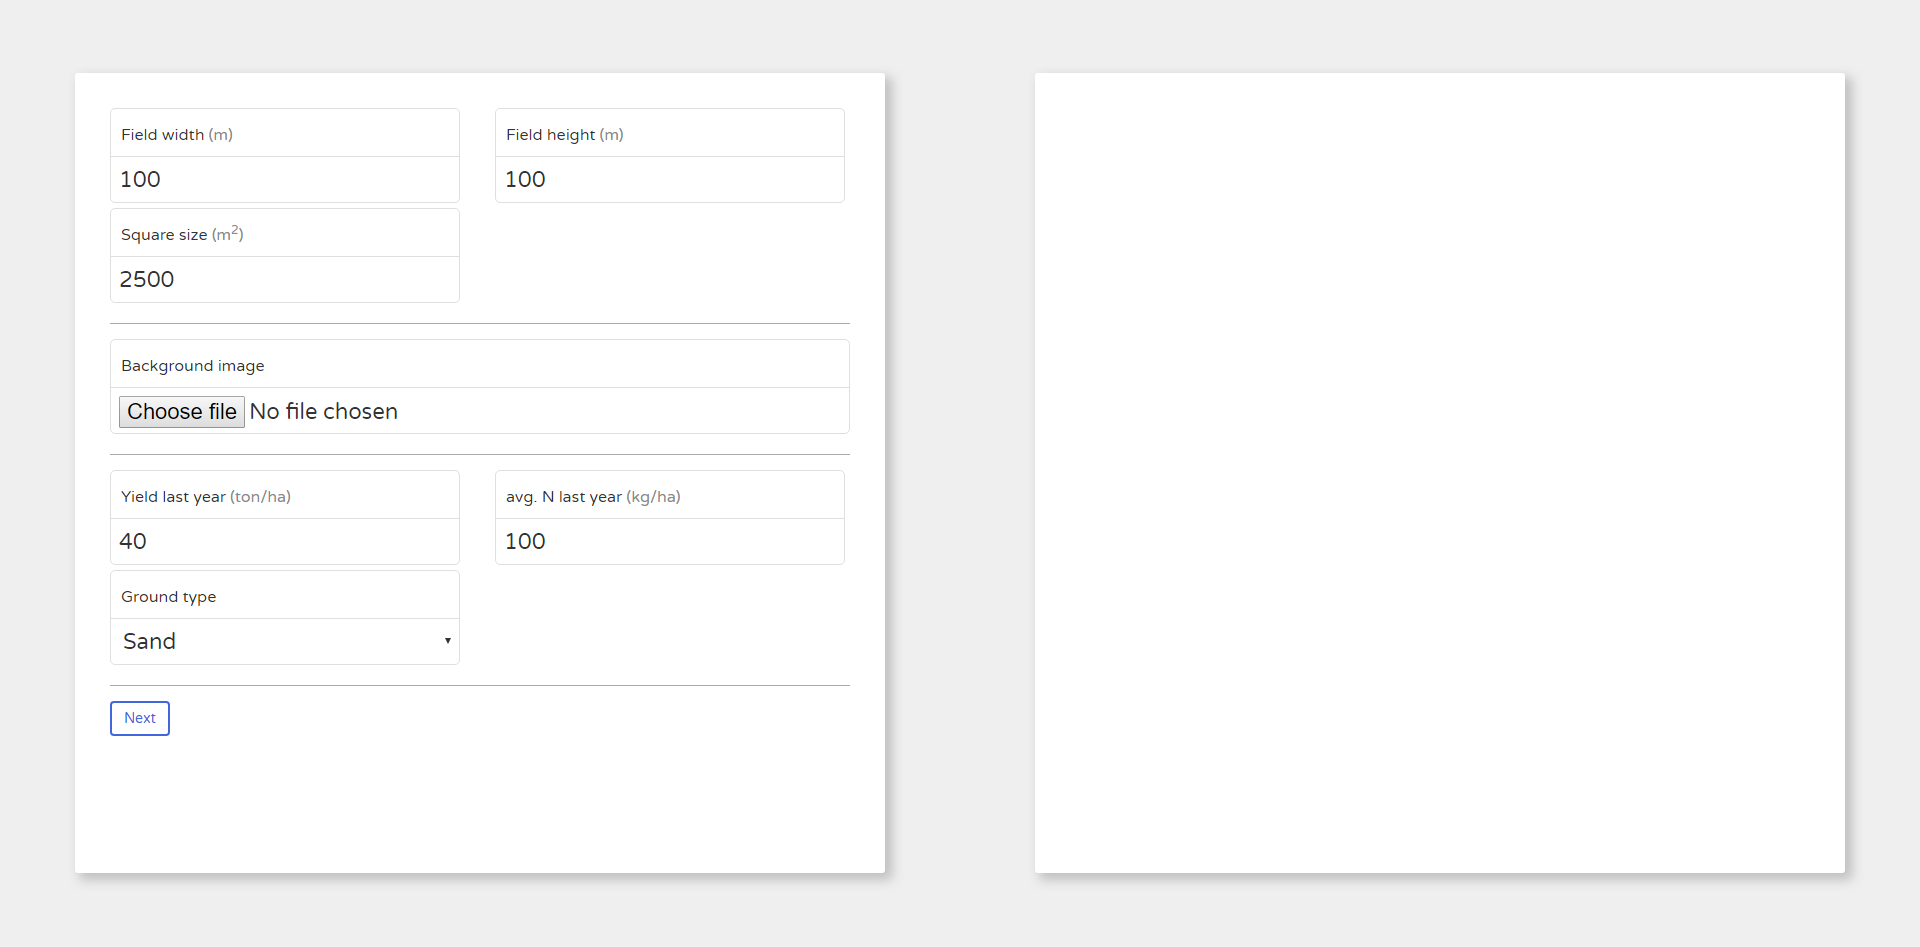
The first screen upon opening the website will appear as follows: | |||
[[File:CaptureS1.PNG| 600px|]] | |||
Here the user can input certain parameters for the application to use during the later drawing and calculation phase. | |||
The following parameters are present: | |||
* Field Width, Field Height and Square Area. These parameters should follow the measurements of the users field and the precision of the taken soil samples. | |||
* A background image can be uploaded for use as a guide during the drawing phase. Think of images such as maps of the farm or official cadastre. | |||
* The previous years total yield and Nitrate added to the field and the type of soil most common in the users fields. These are necessary to provide an accurate result, as explained in the modelling section. | |||
After the inputs are given the "Next" button can be clicked on to move to the drawing phase. For the example a field of dimensions 1000x1000 meters and a square size of 2500m^2 will be used. A simple farm map has also been uploaded. | |||
Thus the second screen will appear as follows | |||
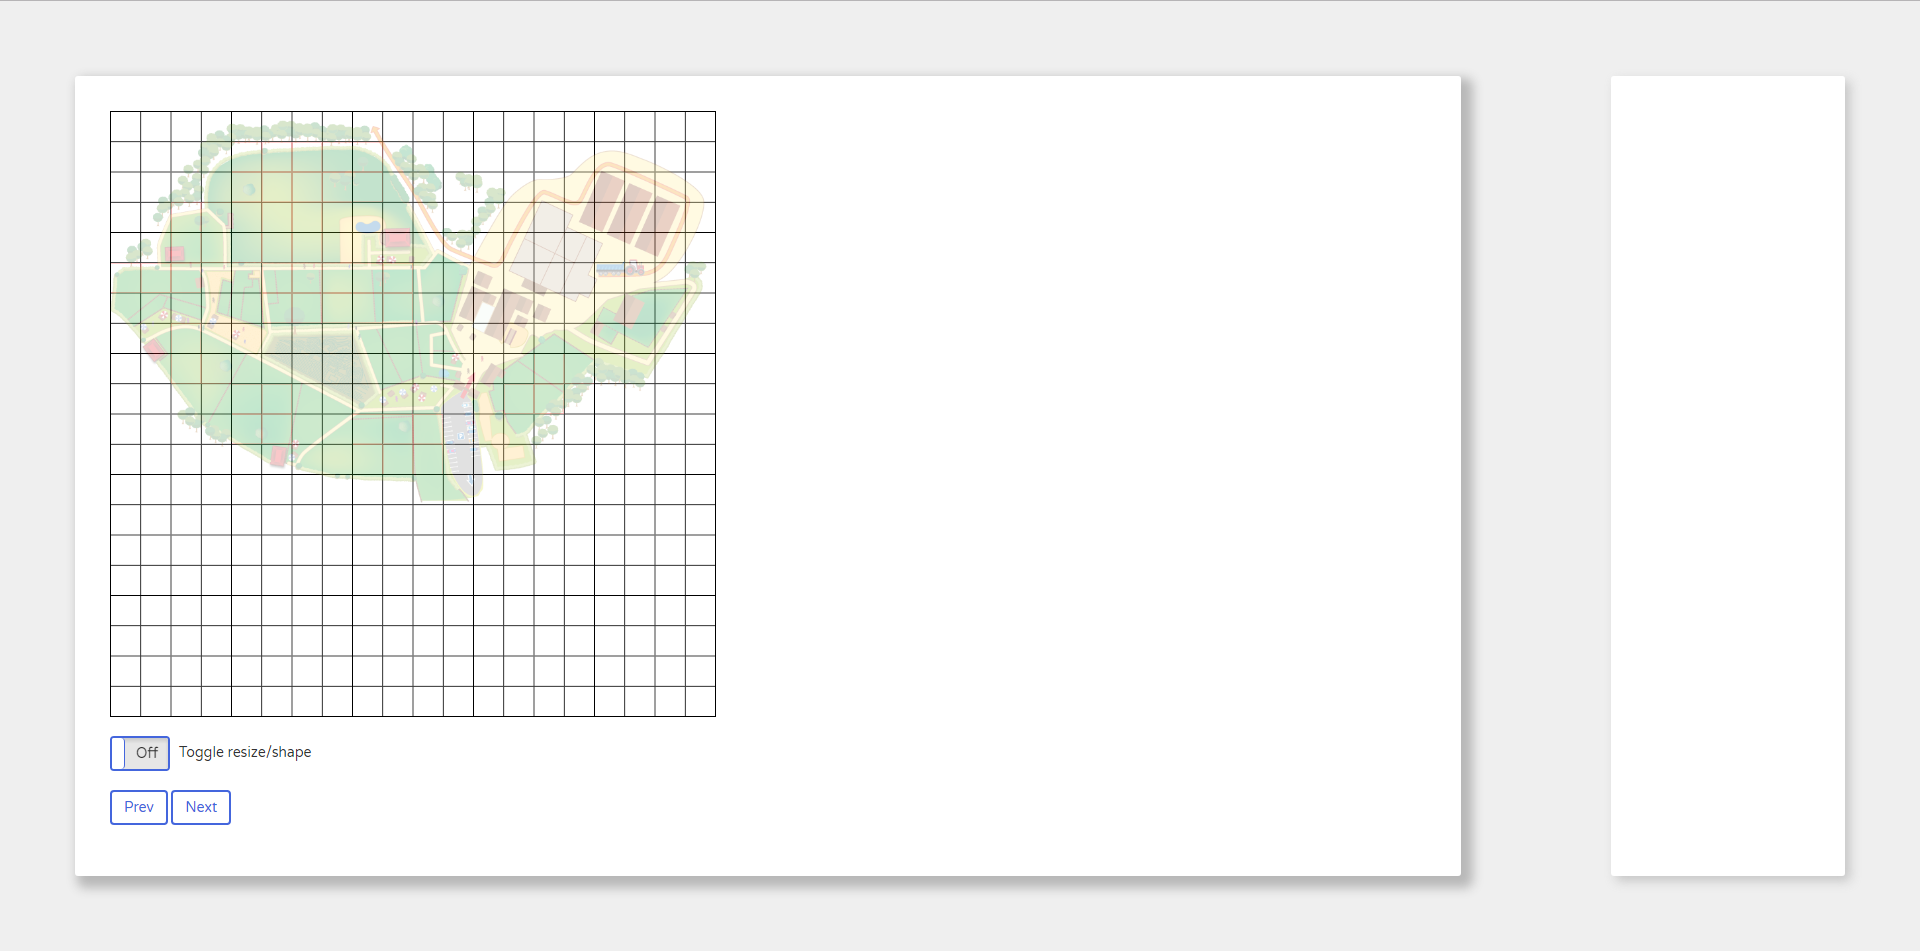
[[File:CaptureS2.PNG| 600px|]] | |||
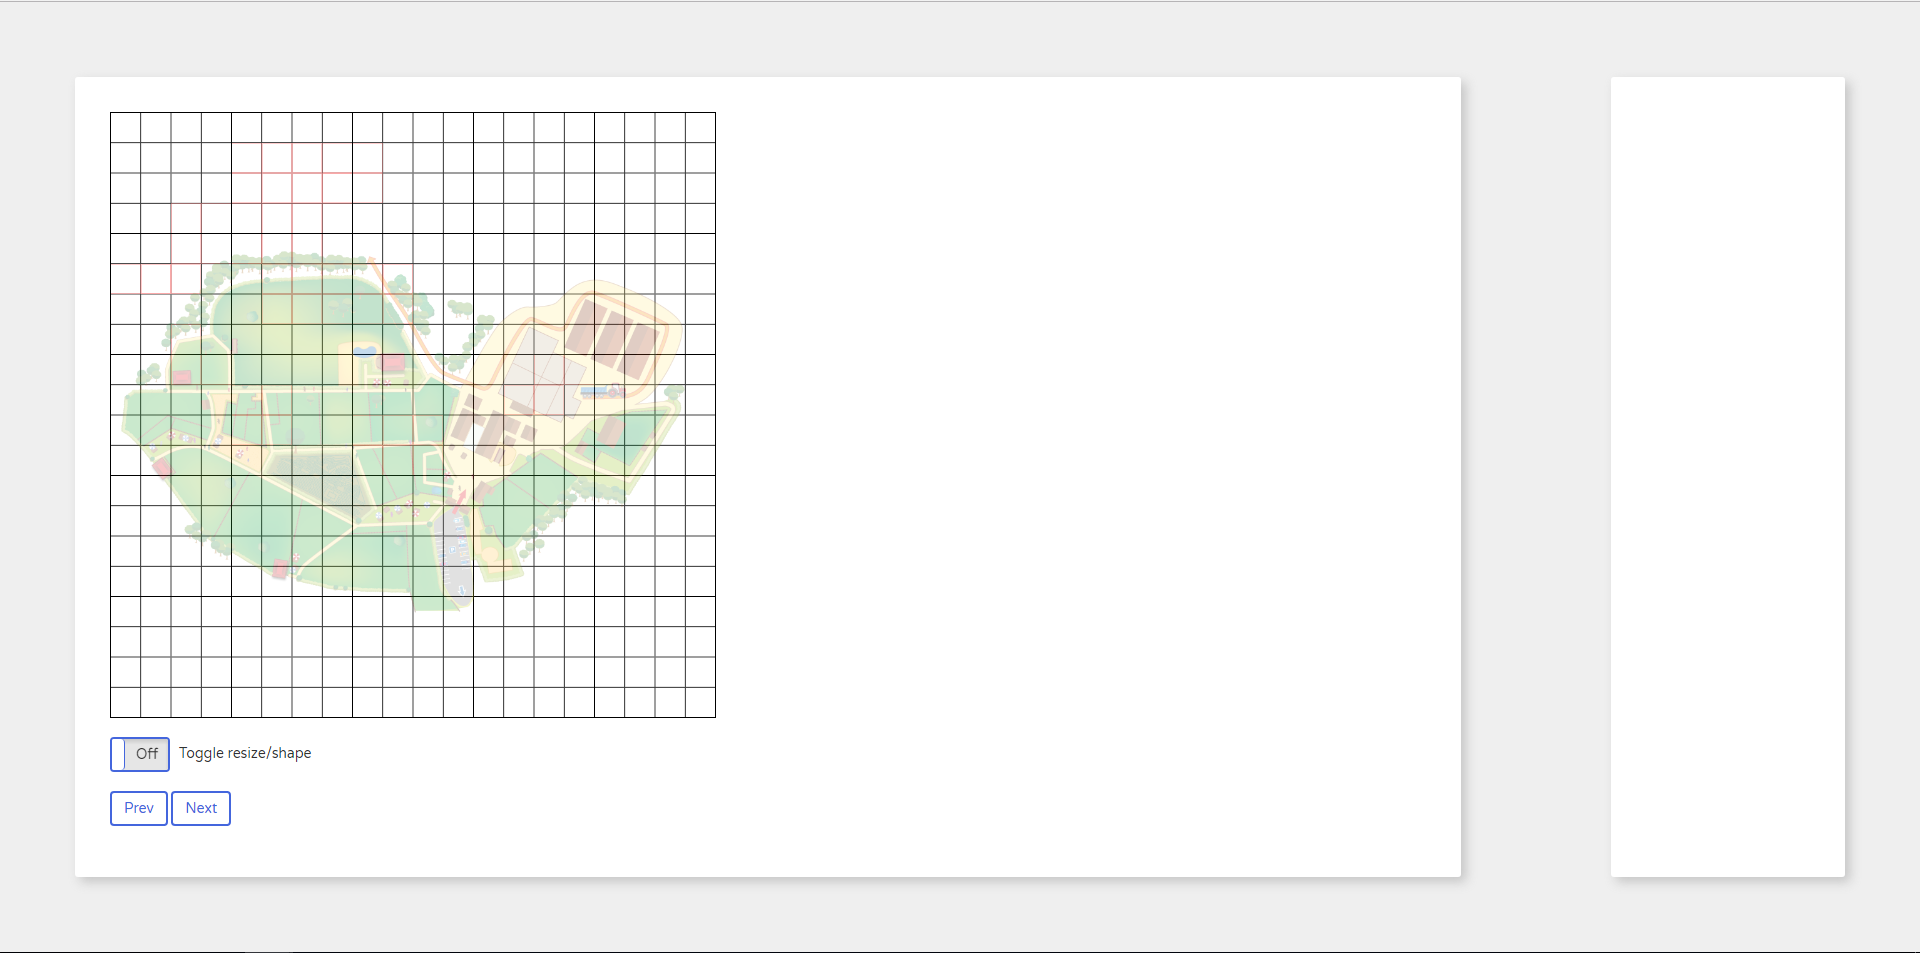
This is where the drawing phase has been entered. But before the drawing can be started, the image can be resized using the "Toggle resize/shape" option. When this toggle is set to off, the image can be freely moved and resized to fit the screen like this: | |||
[[File:CaptureS22.PNG| 600px|]] | |||
This can also be used to line up the squares better with the soil sample measurements. | |||
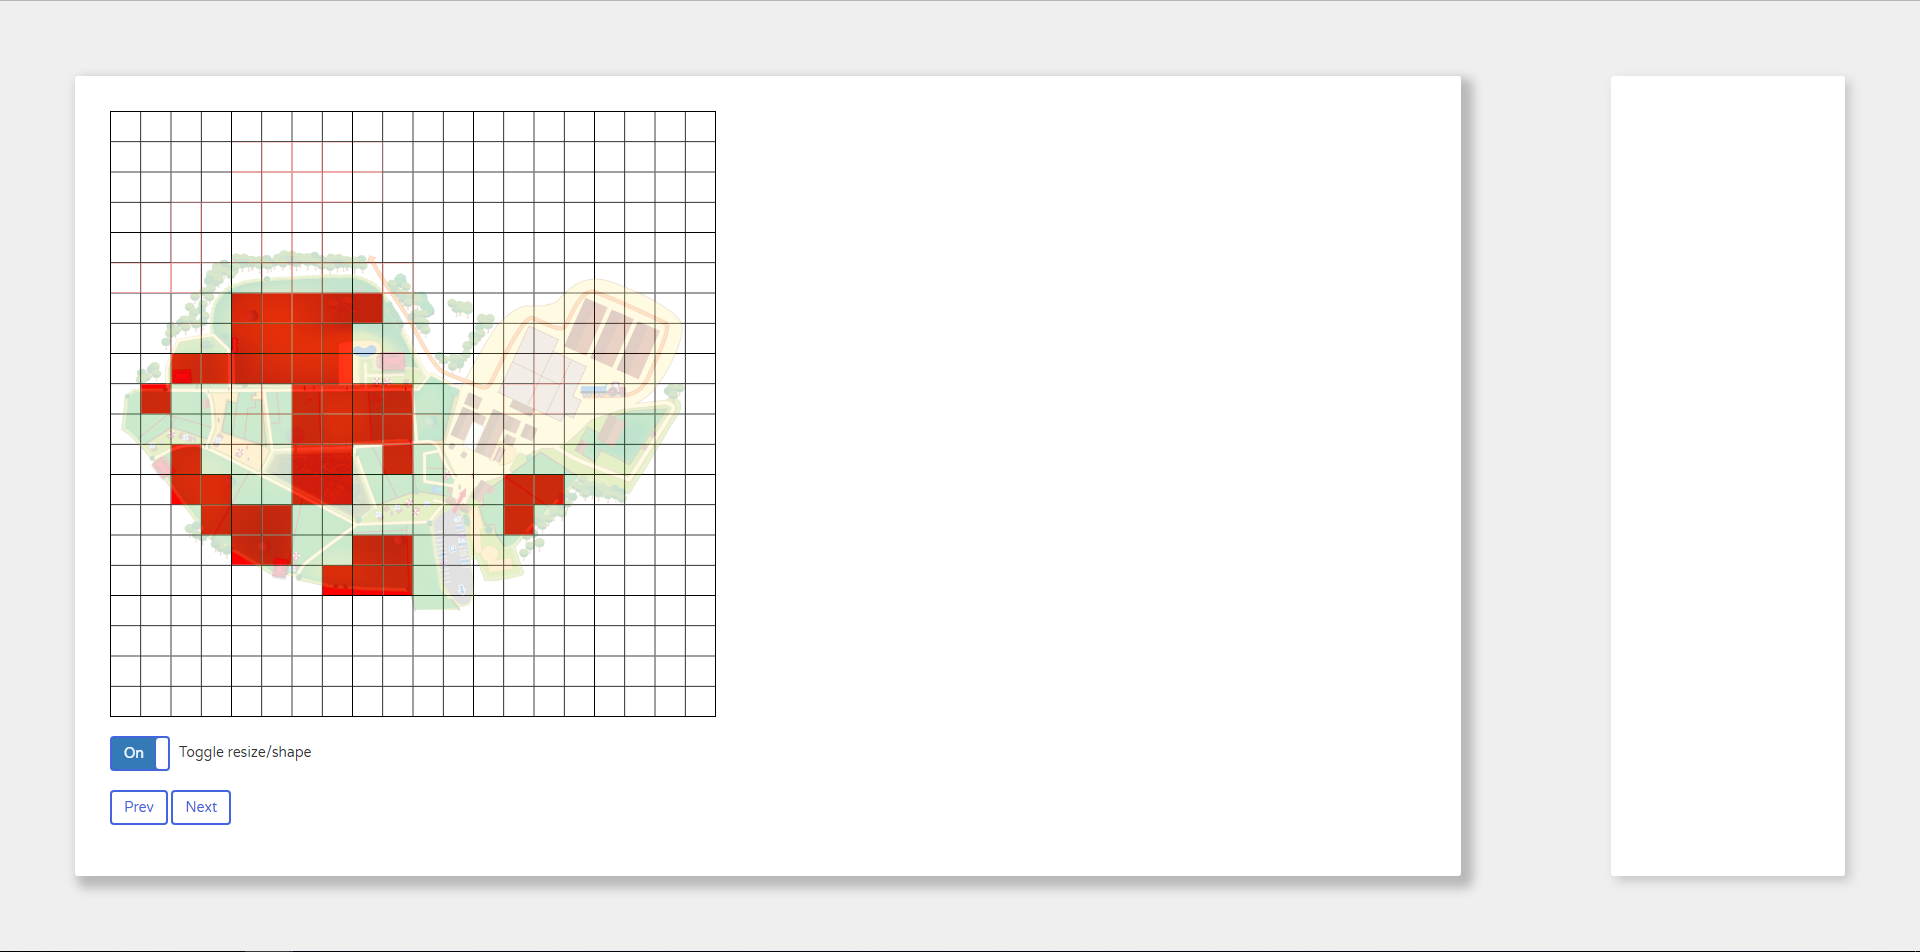
After locking the image again by toggling the "Toggle resize/shape" button to on, the drawing can be started. Drawing here is simply covering all the points where soil samples were taken by clicking on the squares on the screen. In the example the result would look like this: | |||
[[File:CaptureS23.PNG| 600px|]] | |||
After all the soil sample spots have been marked, the "Next" button can be clicked on again to move to the next phase. Alternatively, at any point during this phase the "previous" button could be clicked on to return to the previous phase, in case any mistakes were made regarding the initial parameters. | |||
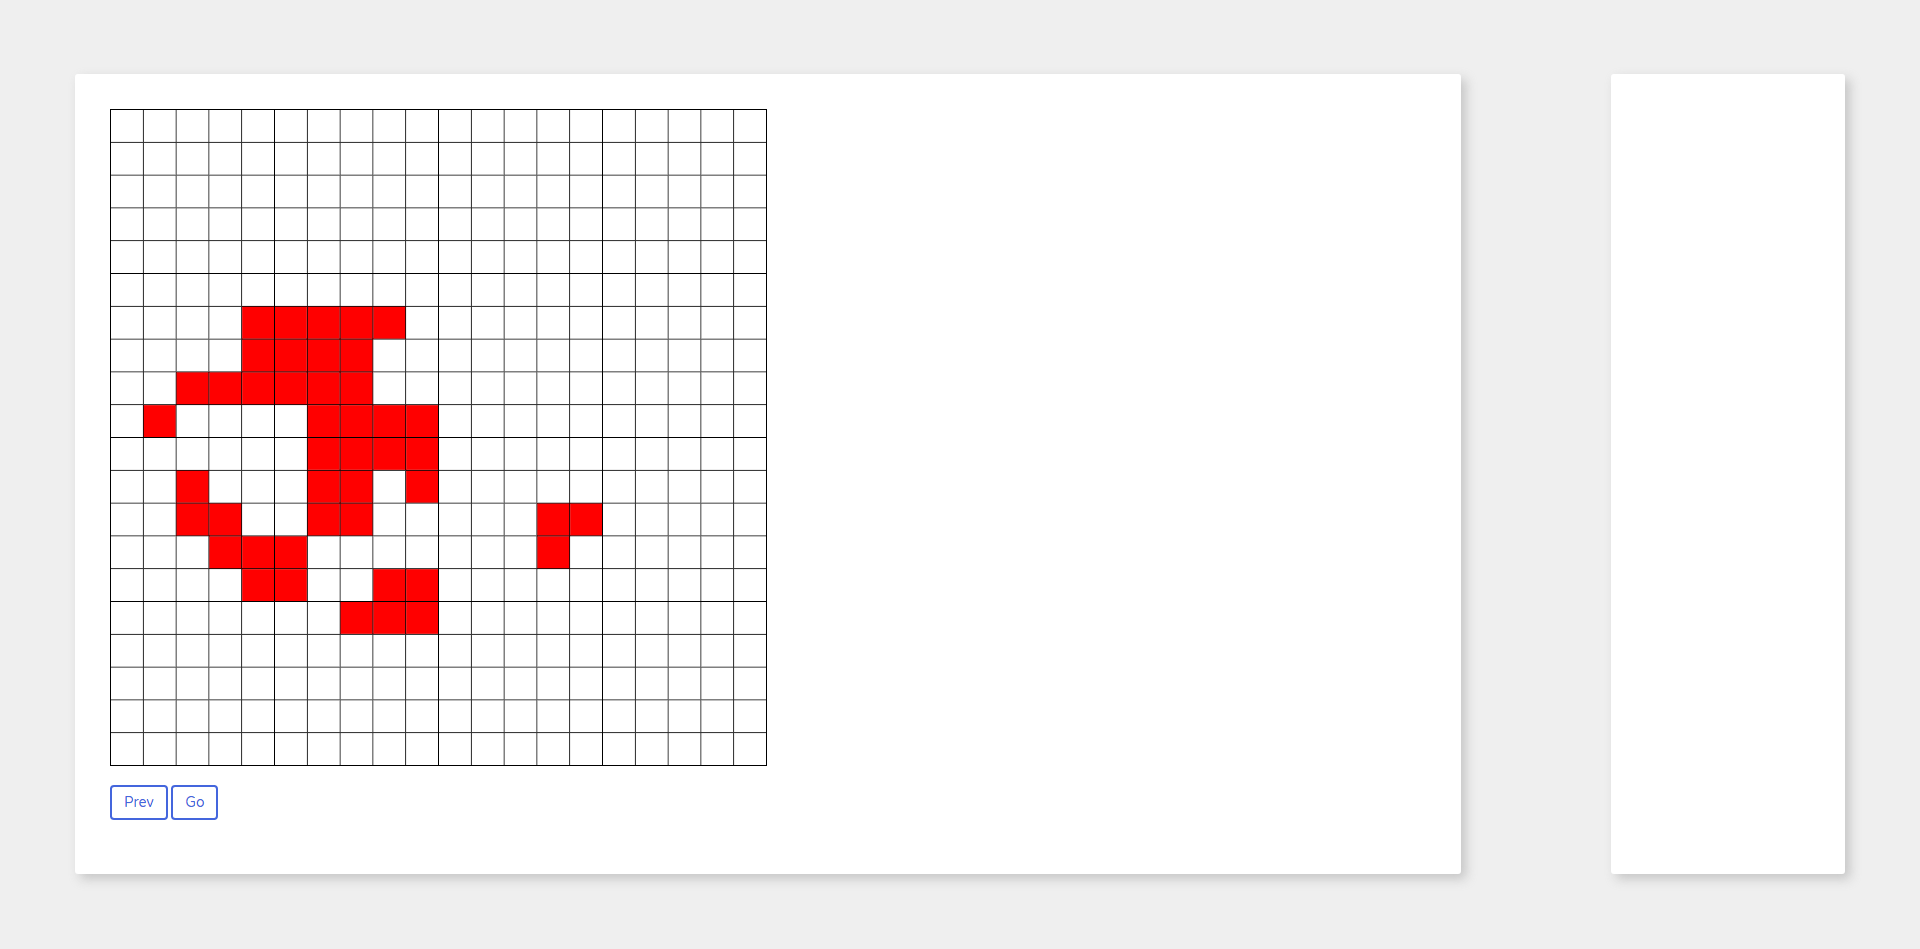
When the "Next" button is clicked on, the following screen appears: | |||
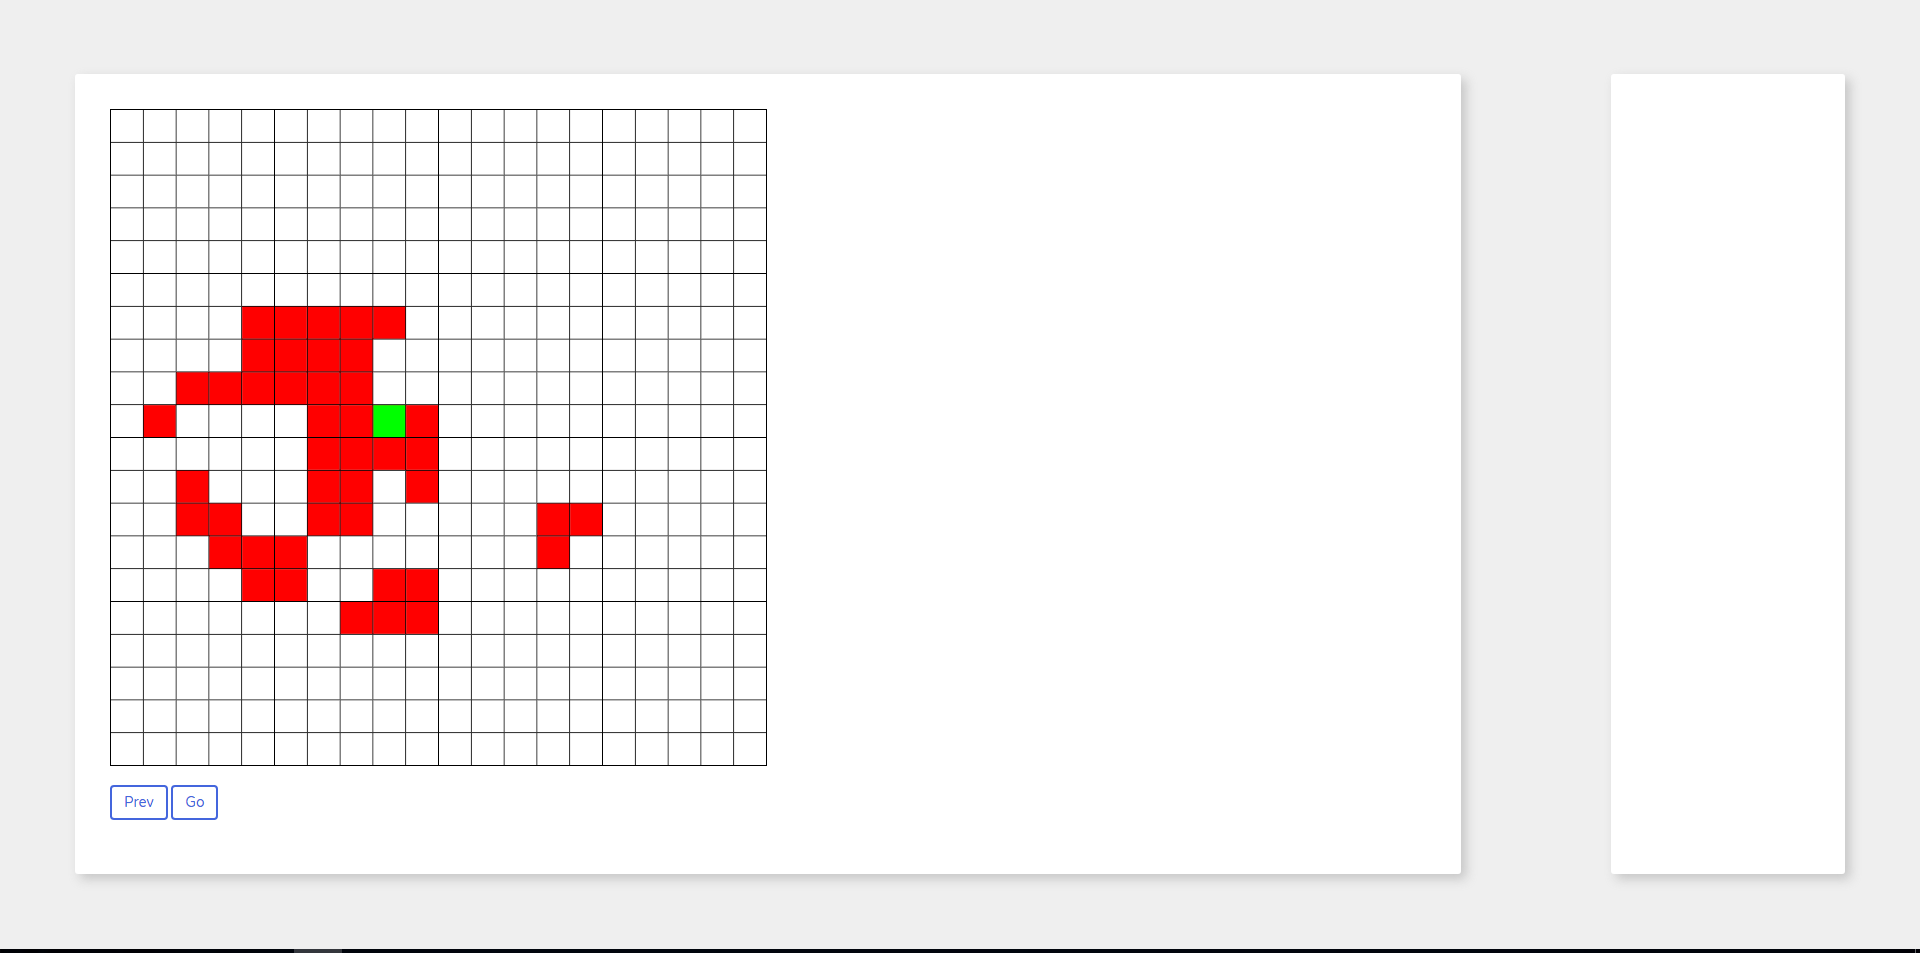
[[File:CaptureS3.PNG| 600px|]] | |||
Now any of the colored squares can be clicked on to input the value of the Nitrate measurements in the soil sample on that spot: | |||
[[File:CaptureS3.PNG| 600px|]] | |||
After a value has been input and submitted by pressing "Enter" on the keyboard, the square will turn green to indicate that a submission has been made. The user can still click on the square and change the given value at any time. The application will also warn users when trying to input values on unusable squares, those are the squares which have not been marked in the drawing phase. | |||
[[File:CaptureS33.PNG| 600px|]] | |||
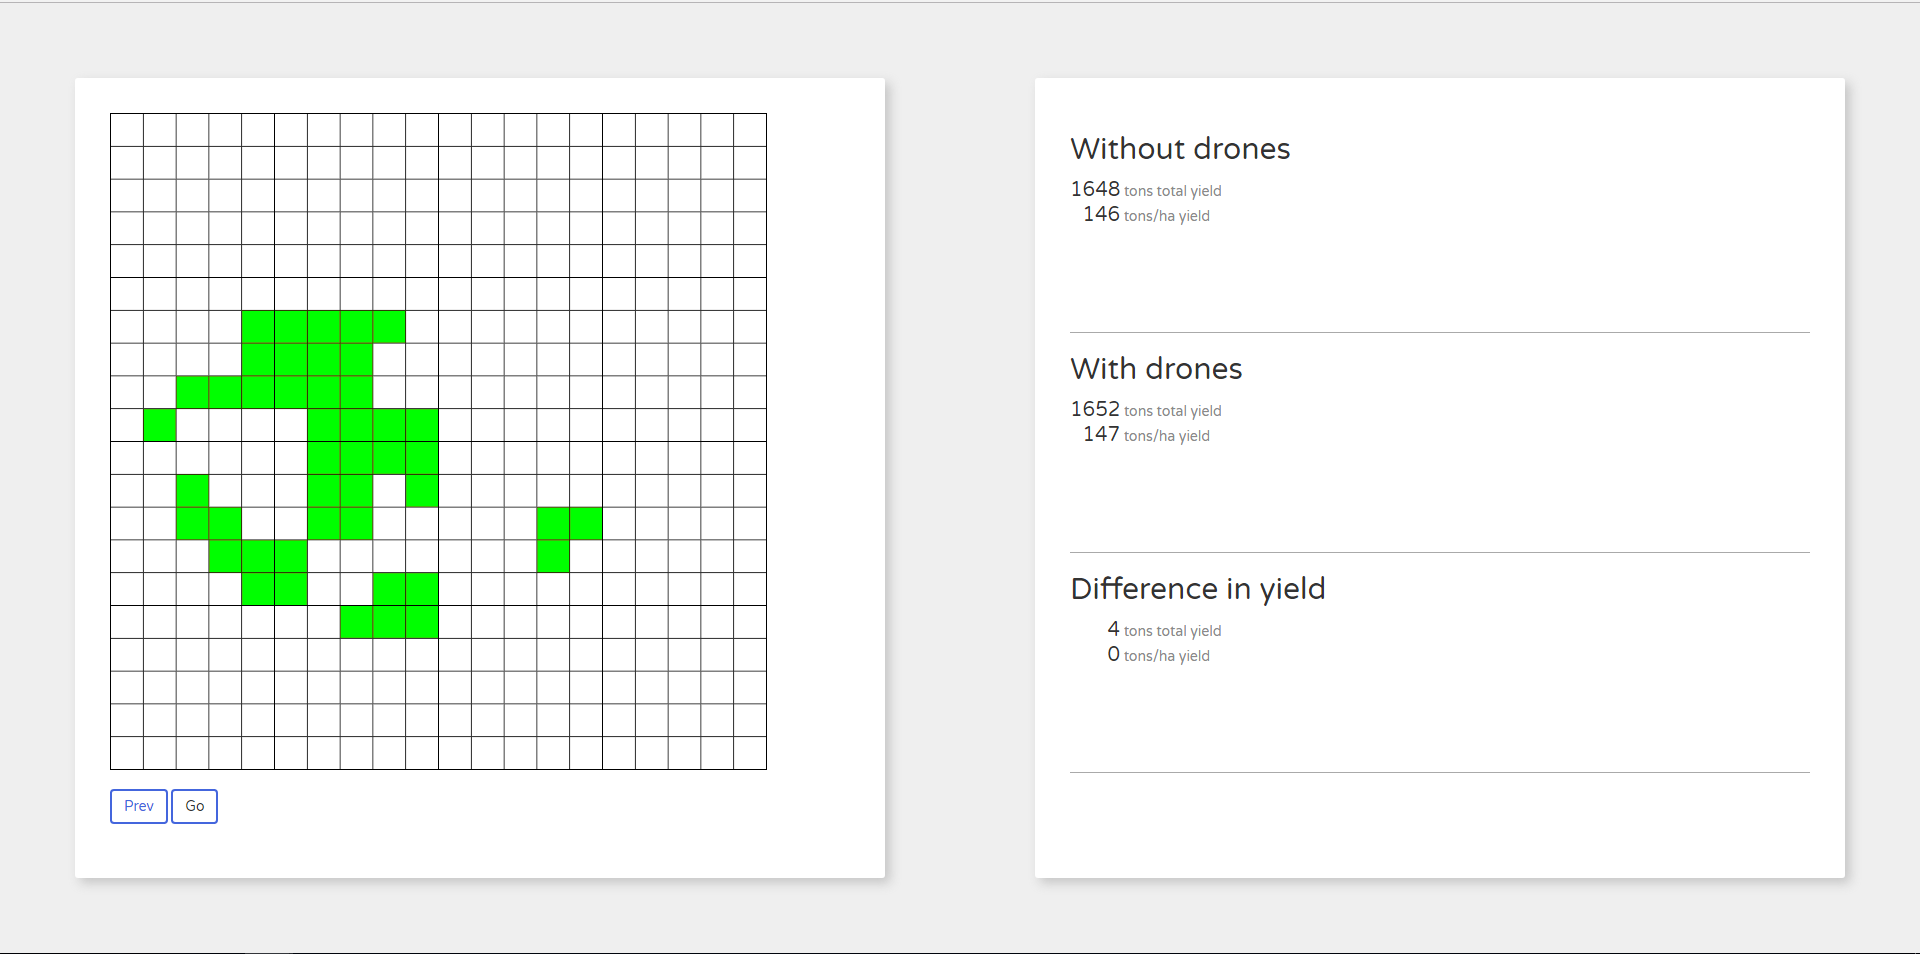
After a value for each square has been inputted the "Go" button can be clicked to start calculating the results. Again, at any time we can use the "previous" button to return to the drawing phase if we need to correct any mistakes. | |||
After pressing "Go", the application will calculate the results according to the model described in the "Final model" section. The output will be shown on the right side panel which will pop out: | |||
[[File: | [[File:CaptureS4.PNG| 600px|]] | ||
(Note: the numbers used in the example are randomly chosen and the output most likely does not reflect a real life scenario) | |||
This screen shows the resulting yield and the potential difference in yield when drones are used. | |||
This concludes the fourth and final phase in using the web application. | |||
The full source code of the website is publicly available at https://github.com/JurBartels/USEfullPotatoe. | |||
==''' | =='''Advice'''== | ||
As a result of | As a result of the model, an advice will be given to the user about the investment in drones. | ||
To give a good advice the costs and the value of the potatoes have to be taken into consideration. | |||
The following factors are important in calculating the profit: | |||
* The value of the crop: At the moment the potato species Victoria has a value between €22.00 and €24.00 per 100kg. <ref name=Potatoe_Value>http://www.boerderij.nl/Opmaat/Dashboard/</ref>. | |||
* The cost of the Drones are described below. | |||
* The costs for extra fertilizing: because the amount of fertilizer used changes, the costs change as well. At the moment fertilizer costs around €22.50 per 100kg. This fertilizer, named KAS 27, contains about 27% nitrogen. <ref name=Festilizer_costs>http://www.boerderij.nl/Opmaat/Dashboard/marktprijs/82/761/Farmers4all/Kunstmest/KAS-27-4-MgO-Noord/</ref> | |||
because the amount of | |||
==''' | =='''Drones'''== | ||
==='''Camera'''=== | ==='''Camera'''=== | ||
There are a few different camera's which can be used for drones in agriculture: | There are a few different camera's which can be used for drones in agriculture. The results of the images depends on the measurable band and kind of sensor on the drones: | ||
- The RedEdge MicaSens: which is able to make pictures in five bands: Blue, green, red, red edge | - The RedEdge MicaSens: which is able to make pictures in five bands: Blue, green, red, red edge and near IR. | ||
It is very useful to do a health analysis of plants. This price for this camera is somewhere around $4900. | |||
- Canon S110NIR: It can make pictures in the near infrared band. It is able to give information about biomass indication, growth monitoring, crop discrimination | - Camera's like the Canon S110NIR: It can make pictures in the near infrared band. It is able to give information about biomass indication, growth monitoring, crop discrimination and leaf area indexing. This camera is for example used for the eBee-Ag. | ||
- Canon S110RE: It can make pictures in the red | - Camera's like the Canon S110RE: It can make pictures in the red edge band. It is able to give information about plant stress assessment, chlorophyll indication, senescence analysis and drought assessment. | ||
- Canon S110RGB: It can make pictures in the visible spectrum. It is able to give information about real | - Camera's like the Canon S110RGB: It can make pictures in the visible spectrum. It is able to give information about real color 2D and 3D visual rendering, chlorophyll indication and drainage evaluation. | ||
- Airinov multispec 4C: It is a sensor specially customized for the eBee-Ag. It contains four separate sensors that are | - Airinov multispec 4C: It is a sensor specially customized for the eBee-Ag. It contains four separate sensors that are controlled by the autopilot. These acquire data across four highly precise bands, plus each sensor features a global shutter for sharp, undistorted images. The camera is able to give information about biomass, leaf area indexing, nitrogen recommendation and phenology. This camera again is specially used for the eBee-Ag. | ||
==='''Measurable values'''=== | ==='''Measurable values'''=== | ||
With the camera's | With the camera's described before it is possible to monitor the following things: | ||
- Health analysis: Because the frequent measurements with the drone, you are able to control the growth and health of the plants | |||
- Biomass: the camera's are able to look through the plant and measure the color. Therefore they are able to give a estimation about the biomass of the crop. The biomass is the total mass of the plant. This gives an estimation about the yield. | |||
- The cameras are able to give information about the drainage evaluation. | |||
- The cameras could give recommendations of the nitrogen | |||
- The cameras can measure the Chlorophyll, this tells something about the amount of green pigments in the plant. | |||
Chlorophyll makes it possible for the plant to use the energy from the sun for the photosynthesis. | |||
Marnix told that the information from the drones can be translated into nitrogen values really well. It is possible to give good recommendations about the amount of nitrogen in the crops. For our purpose a multi-spectral camera should be used. | |||
==='''Costs'''=== | |||
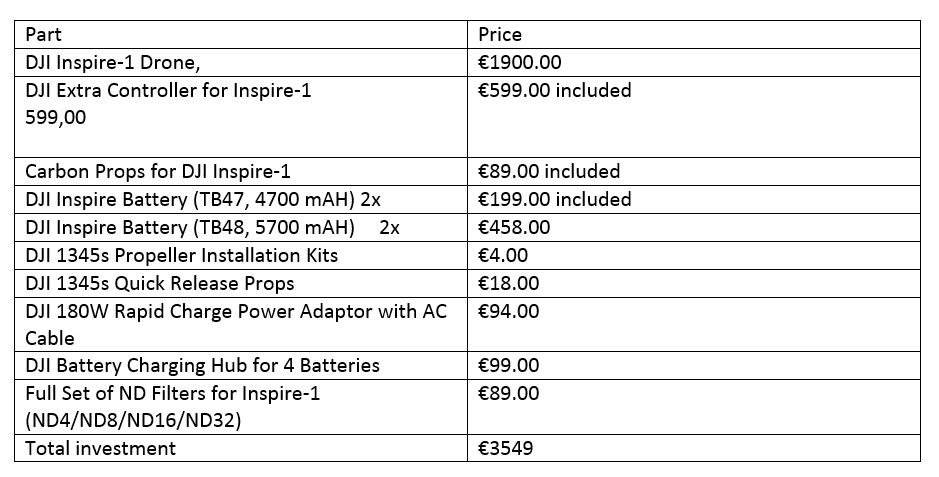
For examining if it would be interesting for farmers to buy a drone, the different costs for flying with drones has to be investigated as well. | |||
An active drone user made a web page on which the costs for all the parts needed to start using drones are described. Apart from these costs, when using drones for professional business, other costs like fly courses and insurance also have to be taken into account.<ref>https://www.dronewatch.nl/wet-en-regelgeving/</ref> | |||
Taking all those thing into account the following total costs can be estimated: | |||
===='''General costs'''==== | |||
Course (Exam) | |||
It is not required to have had such a course, but most insurance companies want to have a confirmation about the flying skills of the pilot before insuring the drone. | |||
The costs for a complete course are about €749.- ex VAT. | |||
Licenses: | |||
- Proof of registration (BvI): €73.- | |||
- Special Exemption Certificate of Air Skill (S-BvL): €63.- | |||
- Licence ROC-light: €234.- | |||
Insurance: | |||
If drones are used for professional use. The user needs to have a insurance. The cost of an insurance for the drone is about €360.- euros per year. | |||
===='''Actual Drone costs'''==== | |||
After being allowed to fly the hardware has to be bought. | |||
Underneath is a summation of the important parts and spare parts. <ref>http://www.hobbypiloot.nl/FAQ/Wat-kost-ut</ref> | |||
All of this is based on the DJI inspire 1. This is one of the drones Jacob van den Borne used when he started with this technology. | |||
[[File:kosten.jpg]] | |||
===='''Consultancies / outsourcing companies '''==== | |||
Another option to start using drones in agriculture is to outsource the drone usage, so things like licenses and drone parts don't have to be bought by the farmer. Outsourcing companies are an ideal way to reduce the costs and the time spent using drones. For this reason a research about existing outsourcing companies in the Netherlands has been done. | |||
The following outsourcing companies were found in this research: | |||
'''Loonbedrijf Thijssen Nieuwehorne''' | |||
This company uses soil sensors and an EBee drone to preform precision agriculture. They claim to that their services can reduce use of water, fertilizer and pesticides by 70%. The pixel size of the EBee drone is 10 cm, which creates detailed crop information maps. | |||
'''De Samenwerking BV Elsloo''' | |||
This company uses a lot of GPS to decrease overlap and increase efficiency, but they don't use drone image processing. They mainly equip their machines with GPS to be able to adjust the amount of different inputs depending on the location. However it might be very useful to contact to company to ask what their opinion is about the use of drones. | |||
'''PrecisionHawk''' | |||
PrecisionHawk is a company that offers drone solutions for all kinds of applications. One of these applications is agriculture. The company offers total packages which consist of the drone, service, apps and software. The user has to buy a license for the software annually. The cheapest and simplest packages which is offered is the 'Crop Scouting Package', which start from +- 1200 US dollar. The most complete package is the 'Lancaster Standard Kit'. This package start from 13000 US dollar. | |||
- | The software offers a wide variety of diagnostic tools to evaluate the soil and the crops. | ||
====''' | |||
Company Thijssen, based in Nieuwehorne, is the only drone outsourcing company found in The Netherlands. Contact with this company will ensure that some key parameters for the model are obtained. | |||
=='''Reflection'''== | |||
To make the work manageable for this project, the problem was scaled down. To do this, assumptions have been made. The model can be improved by removing assumptions. This makes the model usable for more farmers and creates a more accurate advise. It would be a great addition if more nitrogen/yield functions were added for different soils, potato species and other nutritions. This addition would make the outcome more accurate. To expand the model and make it usable for more farmers the model could be expanded with relations for maize and wheat or other crops. It would increase the functionality a lot, because these crops are among the most cultivated ones. | |||
The interface could also be upgraded. The user friendliness can be improved by making the drawing of the contour easier. A possible easy addition is to make it possible to sketch the contours in a loaded picture. A long-term goal is to make sure that the land of a farmer is recognized via image recognition. Another improvement for the user friendliness would be to let all the nitrogen levels of the subsections of the field be filled in automatically with the data gained from the soil research. | |||
=='''Conclusion'''== | |||
At the end of the project, the model is finished. The user is able to fill in the properties of the field like the size and sample size. On the second page he can upload a picture of his field and mark the measured squares. On the next page it is possible to fill in the amount of nitrogen per square. Finally the program will calculate the maximal possible profit that can be reached if the amount of nitrogen will be optimal. | |||
On this wiki the costs for starting to use drones for agriculture are also estimated. | |||
Therefore, by combining this information, the user is able to make an estimation of the profit for maximization of the yield and the cost of the drones. Eventually the user can determine whether or not it would be profitable in his specific circumstances to start using drones for optimization. | |||
As for the conclusion of the project, all goals finally set are met. The main goal was to make a model for farmers in which they can calculate how the yield can be improved by optimizing the nutritions, water and other important growth factors. Because of the complexity and the limited time available, the model is simplified. Eventually the model only takes into account the amount of nitrogen. So the initial main goal of the project is partially reached, but improvements can be made. | |||
=='''Contact with specialists'''== | |||
==='''Van den Borne'''=== | |||
We visited one of the most advanced precision farms in the Netherlands, where a lot of new techniques for precision agriculture are being used. The name of the farm is Van Den Borne Potatoes. | We visited one of the most advanced precision farms in the Netherlands, where a lot of new techniques for precision agriculture are being used. The name of the farm is Van Den Borne Potatoes. | ||
| Line 574: | Line 551: | ||
The only part that is difficult with the technology is that it is simple to measure all kinds of things, but it is difficult to process the 'raw data' to data you can work with. It will always stay hard to exactly tell, out of a picture, where you should change something for optimizing the grow process. | The only part that is difficult with the technology is that it is simple to measure all kinds of things, but it is difficult to process the 'raw data' to data you can work with. It will always stay hard to exactly tell, out of a picture, where you should change something for optimizing the grow process. | ||
The current project he is working with right now, is that of a building team that tries to build a new drone. And because of the legal restrictions he is observing the possibilities for using drones that fly with a fixed power cable. | The current project he is working with right now, is that of a building team that tries to build a new drone. And because of the legal restrictions he is observing the possibilities for using drones that fly with a fixed power cable. <ref>http://www.vandenborneaardappelen.com/</ref> | ||
[[File:UAV sensing 1.jpg| 400px|]] [[File:20170129143059 0 orig.jpg| 400px|]] | [[File:UAV sensing 1.jpg| 400px|]] [[File:20170129143059 0 orig.jpg| 400px|]] | ||
==='''Eline van den Haak'''=== | |||
We had a conversation with Eline about our project. We asked her about the procedure to do soil research and how the results are presented. | We had a conversation with Eline about our project. We asked her about the procedure to do soil research and how the results are presented. | ||
She showed us an example of an soil analysis. Eline advised us to find contact with an employee of Van den Borne named Marnix. | She showed us an example of an soil analysis. Eline advised us to find contact with an employee of Van den Borne named Marnix. | ||
We had contact with Marnix about the data analysis of Van den Borne. Marnix gave us data files from the potatoes of 2016, so we are able to check the data en try to find some relations between the nitrogen and the yield. | We had contact with Marnix about the data analysis of Van den Borne. Marnix gave us data files from the potatoes of 2016, so we are able to check the data en try to find some relations between the nitrogen and the yield. Furthermore we talked about the work she did. She explained us the difficulties. She told us where we could start with finding information for our model. | ||
==='''Wouter Kuijpers'''=== | |||
We also had contact with Wouter. He is PHD student and is doing research about grow models of tomatoes. | We also had contact with Wouter. He is PHD student and is doing research about grow models of tomatoes. | ||
Tomatoes behave like potatoes, but he could not really help us with finding information for the relation between nitrogen and yield. | Tomatoes behave like potatoes, but he could not really help us with finding information for the relation between nitrogen and yield. | ||
==='''Marnix van den Brande '''=== | |||
We had contact with Marnix. He was a coworker of Van den Borne. New he switched jobs, but is still the contact person for students. Eline van der Haak advised us to contact him. We did a lot of research for Van den Borne, to find relations between the measurements and the yield. He wrote a MSc-thesis. The thesis estimated the amount of nitrogen in the plant via sensor measurement. Furthermore Marnix helped us with some questions about the drones, the camera’s and the analyzing process. Last he advised us to go to the slot presentation from Puck Mulders. Puck is master student Data-Science and did investigation to find relations between the different measurable parameters. Last Marnix gave us some datasheets from Van den Borne, so we are able to find relations out of the data ourselves. | We had contact with Marnix. He was a coworker of Van den Borne. New he switched jobs, but is still the contact person for students. Eline van der Haak advised us to contact him. We did a lot of research for Van den Borne, to find relations between the measurements and the yield. He wrote a MSc-thesis. The thesis estimated the amount of nitrogen in the plant via sensor measurement. Furthermore Marnix helped us with some questions about the drones, the camera’s and the analyzing process. Last he advised us to go to the slot presentation from Puck Mulders. Puck is master student Data-Science and did investigation to find relations between the different measurable parameters. Last Marnix gave us some datasheets from Van den Borne, so we are able to find relations out of the data ourselves. | ||
==='''Puck Mulders'''=== | |||
After the contact with Marnix, Teun and Johan went to the presentation of Puck Mulders. She is a data science student who is searching for correlations between growing days and key potato plant parameters. The presentation was very interesting and she was very keen to help us. Unfortunately she had a meeting right afterwards so she couldn't help us face to face. But, there is an e-mail conversation going on. | |||
=='''References'''== | =='''References'''== | ||
<references/> | <references/> | ||
| Line 612: | Line 591: | ||
15. Machine-to-machine communication goo.gl/UVJDFS | 15. Machine-to-machine communication goo.gl/UVJDFS | ||
16. Framework for argicultural systems goo.gl/RGzsuo | 16. Framework for argicultural systems goo.gl/RGzsuo | ||
19. Bosch Weeding Robot: https://www.deepfield-robotics.com/en/Weeding.html | 19. Bosch Weeding Robot: https://www.deepfield-robotics.com/en/Weeding.html | ||
20. Drip Irrigation Of Row Crops: What Is The State Of The art? https://www.ksre.k-state.edu/sdi/abstracts/drip-irrigation-of-row-crops.pdf | 20. Drip Irrigation Of Row Crops: What Is The State Of The art? https://www.ksre.k-state.edu/sdi/abstracts/drip-irrigation-of-row-crops.pdf | ||
| Line 626: | Line 603: | ||
28. Influence of Ph value on the yield and marketable yield of potatoes. With concreet data which we can use http://www.usask.ca/agriculture/plantsci/vegetable/resources/journal/Impact_pH_scab.pdf | 28. Influence of Ph value on the yield and marketable yield of potatoes. With concreet data which we can use http://www.usask.ca/agriculture/plantsci/vegetable/resources/journal/Impact_pH_scab.pdf | ||
29. Influence of water on the yield of potatoes, inc data and graph representation http://www.agrojournal.org/20/02-11.pdf | 29. Influence of water on the yield of potatoes, inc data and graph representation http://www.agrojournal.org/20/02-11.pdf | ||
==='''Tasks'''=== | ==='''Tasks'''=== | ||
| Line 667: | Line 645: | ||
|Guus | |Guus | ||
|} | |} | ||
=='''Logbook'''== | =='''Logbook'''== | ||
| Line 757: | Line 662: | ||
|- | |- | ||
!Jur Bartels | !Jur Bartels | ||
| Brainstorming about the topic, finding resources and making a start with the wiki||Did state of the art research for robots in harvesting, updated wiki ||Researched previous work done in modelling impact of robotics in agriculture, created logbook and task list in the wiki || || || || || | | Brainstorming about the topic, finding resources and making a start with the wiki||Did state of the art research for robots in harvesting, updated wiki ||Researched previous work done in modelling impact of robotics in agriculture, created logbook and task list in the wiki || Research about different drones || Started work on the website || Work on implementing the model and interface of the website || Finish up website || Work on wiki, give final presentation | ||
|- | |- | ||
!Laurence Keijzer | !Laurence Keijzer | ||
| Brainstorming about robotics in agriculture + research. || Went to Van den Borne for the interview + state of the art research about use of robots in irrigation. || Done research about different crops we want to use in our model || Gathering more information about wheat and what water and fertilizer have on the growth rate of wheat || || || || | | Brainstorming about robotics in agriculture + research. || Went to Van den Borne for the interview + state of the art research about use of robots in irrigation. || Done research about different crops we want to use in our model || Gathering more information about wheat and what water and fertilizer have on the growth rate of wheat || Started working on implementing model in website || Working on implementing model in website || Working on implementing model in website || Clearing up wiki | ||
|- | |- | ||
!Bastiaan Wuisman | !Bastiaan Wuisman | ||
| Research about our topic and thinking about a topic. || Visited Van den Borne for an interview about his farm. Did a state of the art research about use of robots in pest control. || Researched potato growth || Researched the effect of water on crop growth. Also started the creation of the platform for the model || | | Research about our topic and thinking about a topic. || Visited Van den Borne for an interview about his farm. Did a state of the art research about use of robots in pest control. || Researched potato growth || Researched the effect of water on crop growth. Also started the creation of the platform for the model || Some more research, but mainly continued the implementation of the model || Model implementation || Model implementation || project finalization | ||
|} | |} | ||
='''Appendix'''= | |||
This appendix consists of all the information that is gathered over the weeks but is no longer relevant for the goals finally set. They still hold some informational value and therefor are still on the wiki. | |||
The first part is information that was gathered during the literature study, specifically a literature study to see what types of robots already existed in agriculture. The reason this is no longer relevant is because the goal of our project was adjusted to only include drones. Therefor there no longer was a need to have information about other robots. | |||
The second part is information about maize and wheat. This information was gathered because at some point during the project the goal was to look at three different crops; potatoes, maize and wheat. But because the eventual goal only includes potatoes, the information about maize and wheat is no longer needed for the project itself. | |||
=='''State of the art automated agriculture'''== | =='''State of the art automated agriculture'''== | ||
Information about the state of the art robots in agriculture. | |||
==='''Weeding'''=== | ==='''Weeding'''=== | ||
| Line 845: | Line 759: | ||
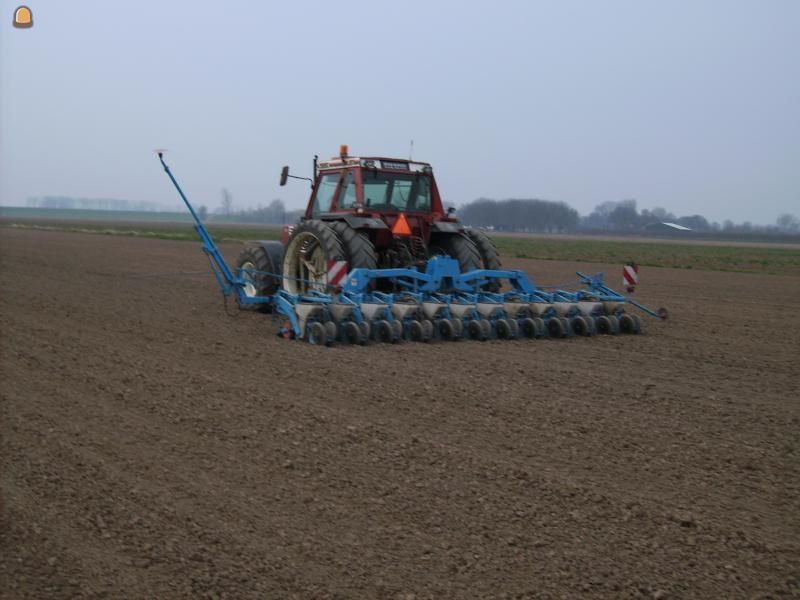
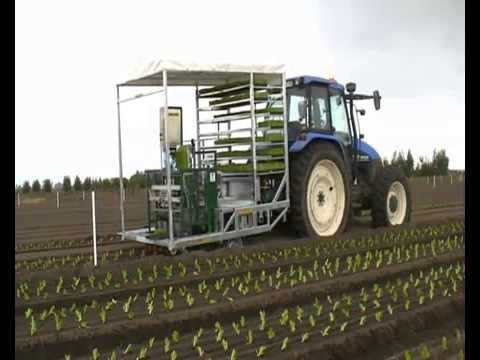
In 2006 an Australian company designed a machine that is able to plant 6 rows at a time. Eventually the machines have been sold to English and Dutch farmers as well. | In 2006 an Australian company designed a machine that is able to plant 6 rows at a time. Eventually the machines have been sold to English and Dutch farmers as well. | ||
[[File:Hqdefault.jpg| 400px|]] | [[File:Hqdefault.jpg| 400px|]] | ||
| Line 858: | Line 773: | ||
---- | ---- | ||
==='''Harvesting'''=== | ==='''Harvesting'''=== | ||
| Line 981: | Line 897: | ||
To get this working there are multiple technologies in the works. There are 3 main options at the moment. These being: computer vision, (near) infrared and scanning a sample size of plants using destructive methods. This last one not really being applicable to the situation, but is more aimed towards testing the harvested crops before selling them. The first 2 are more useful to growing plants. Computer vision more up close on a plant-by-plant basis while (near) infrared could be used with a drone on a slightly bigger scale (but possibly plant-by-plant if the resolution is high enough and you don’t fly the drone too high) | To get this working there are multiple technologies in the works. There are 3 main options at the moment. These being: computer vision, (near) infrared and scanning a sample size of plants using destructive methods. This last one not really being applicable to the situation, but is more aimed towards testing the harvested crops before selling them. The first 2 are more useful to growing plants. Computer vision more up close on a plant-by-plant basis while (near) infrared could be used with a drone on a slightly bigger scale (but possibly plant-by-plant if the resolution is high enough and you don’t fly the drone too high) | ||
---- | |||
=='''Crops'''== | |||
Information about different crops. | |||
==='''Maize'''=== | ==='''Maize'''=== | ||
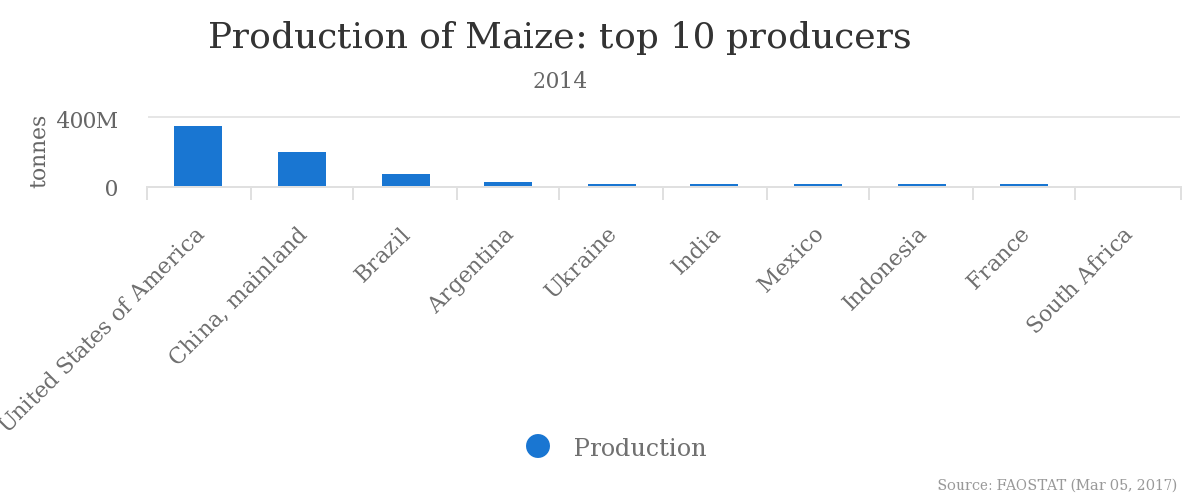
| Line 1,042: | Line 962: | ||
==='''Wheat'''=== | ==='''Wheat'''=== | ||
===='''Production'''==== | ===='''Production'''==== | ||
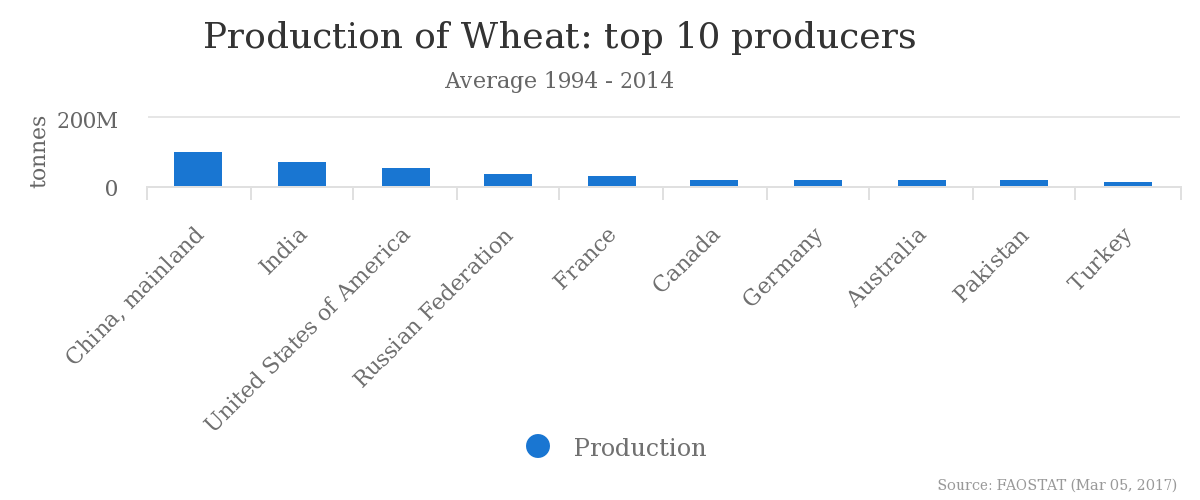
The production of wheat is the highest in the China and India (108 and 75 million tonnes respectively)<ref name=fao_visualize/> with the land efficiency being around 3.3 ton/ha in 2014 and a maximum of 10 ton/ha.<ref name=fao_home/> | The production of wheat is the highest in the China and India (108 and 75 million tonnes respectively)<ref name=fao_visualize>http://www.fao.org/faostat/en/#data/QC/visualize</ref> with the land efficiency being around 3.3 ton/ha in 2014 and a maximum of 10 ton/ha.<ref name=fao_home>http://www.fao.org/home/en/</ref> | ||
The list is as follows according to “Food and Agriculture Organization of the United Nations”<ref name=fao_visualize/>: | The list is as follows according to “Food and Agriculture Organization of the United Nations”<ref name=fao_visualize/>: | ||
| Line 1,083: | Line 1,003: | ||
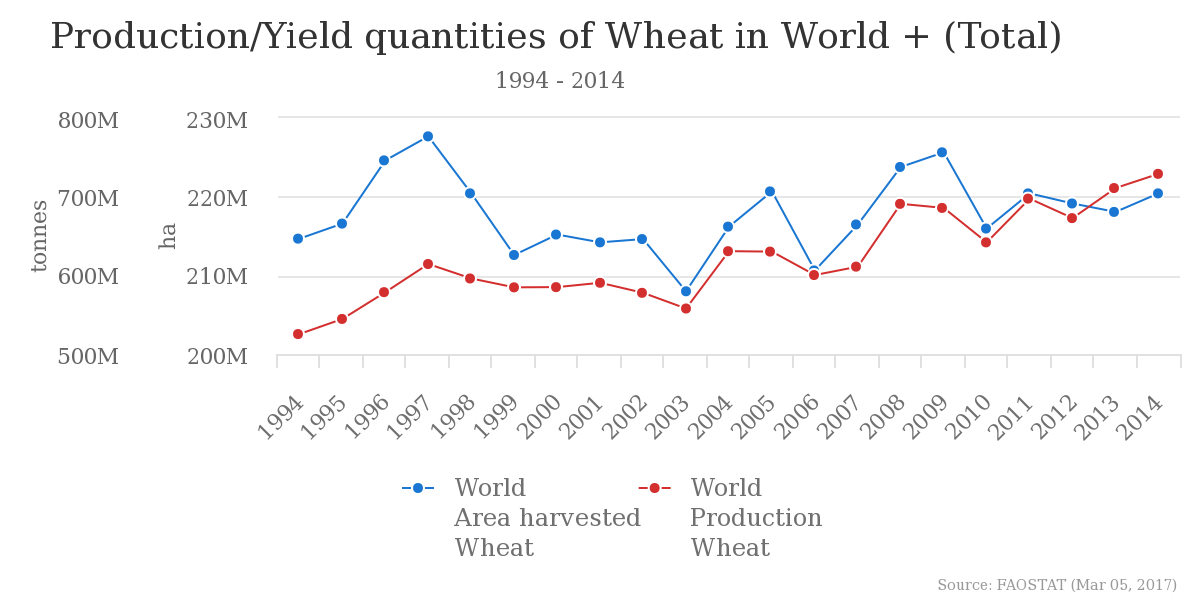
[[File:Chart_wheat_yield.png| 400px]]<ref name=fao_visualize/> | [[File:Chart_wheat_yield.png| 400px]]<ref name=fao_visualize/> | ||
[[File:Chart_wheat_top_10.png| 400px|]] | [[File:Chart_wheat_top_10.png| 400px|]] | ||
===='''Growth Process'''==== | ===='''Growth Process'''==== | ||
| Line 1,106: | Line 1,025: | ||
During this stage the plant goes from having some flowers to a fully developed plant. The central part of the plant is where the anthesis begins and continues towards the basal and apical parts during a three- to five-day period<ref name=fao_wheat/>. After this the endosperm cells and amyloplasts are formed<ref name=fao_wheat/>. | During this stage the plant goes from having some flowers to a fully developed plant. The central part of the plant is where the anthesis begins and continues towards the basal and apical parts during a three- to five-day period<ref name=fao_wheat/>. After this the endosperm cells and amyloplasts are formed<ref name=fao_wheat/>. | ||
===='''Influence of Water'''==== | |||
There are two major processes that are involved with the usage of water: the first is the water absorption by the plant itself. The second is the crop evapotranspiration. This depends on net radiation, vapor pressure deficit, the crop ground cover and stomatal conductance<ref name=fao_wheat/>. | |||
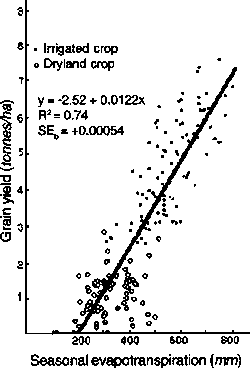
Plant evapotranspiration (ET) is positively and linearly related to grain yield in C3 plants<ref name=fao_wheat/>. Because of this reason water shortage will decrease grain yield. See figure below: | |||
<i>Relationship of grain yield to seasonal evapotranspiration for irrigated and dry-land wheat crops</i> | |||
[[File:Linear_grain_yield_water_wheat.gif]]<ref name=fao_wheat/> | |||
Next is the influence of water shortage on the different growth stages explained earlier. | |||
====='''Germination to emergence'''===== | |||
The negative impact on seed growth in this stage can be reduced if the seeds are bigger<ref name=fao_wheat/>. Bigger seeds have a larger root mass and may help the plant of getting to the deeper water if there is less water available<ref name=fao_wheat/>. | |||
====='''Emergence to double ridge'''===== | |||
Drought during GS1 may result in an increase of the phyllochron of bread and durum wheat, but on the other hand leaf growth will suffer from a lack of water, especially if the water potentials are between -0.7 and -1.2 MPa<ref name=fao_wheat/>. | |||
The following table shows how less water influences the different stages of GS1: | |||
{| class="wikitable" border="1" | |||
|- | |||
! | |||
! Stress Period | |||
! Stress Period | |||
! Stress Period | |||
! Stress Period | |||
|- | |||
! Parameter | |||
! Control | |||
! Pre-anthesis | |||
! Anthesis | |||
! Grainfilling | |||
|- | |||
! Leaf area index at booting | |||
| 5.00 | |||
| 3.30 | |||
| 5.00 | |||
| 5.00 | |||
|- | |||
! Fertile tillers/m<sup>2</sup> | |||
| 513.00 | |||
| 658.00 | |||
| 434.00 | |||
| 485.00 | |||
|- | |||
! Grains/spike | |||
| 32.70 | |||
| 13.00 | |||
| 27.10 | |||
| 31.40 | |||
|- | |||
! 1 000 grain weight (g) | |||
| 56.30 | |||
| 55.20 | |||
| 53.70 | |||
| 49.20 | |||
|- | |||
! Grain yield (g/m<sup>2</sup>) | |||
| 779.00 | |||
| 559.00 | |||
| 498.00 | |||
| 658.00 | |||
|- | |||
! Harvest index | |||
| 0.52 | |||
| 0.50 | |||
| 0.53 | |||
| 0.53 | |||
|- | |||
! Sugar (g) | |||
| 0.64 | |||
| 0.41 | |||
| 0.78 | |||
| | |||
|- | |||
! WUE (kg grain/ha mm ET)<sup>a</sup> | |||
| 16.80 | |||
| 14.60 | |||
| 12.40 | |||
| 15.20 | |||
|} | |||
<ref name=fao_wheat/> | |||
<sup>a</sup>WUE = water-use efficiency; ET = evapotranspiration. | |||
====='''Double ridge to anthesis'''===== | |||
Because GS2 is a period of active growth, a mild to moderate water deficit will decrease cell growth and leaf area with a consequent decrease of photosynthesis per unit area<ref name=fao_wheat/>. If water deficiency occurs during the spike growth period, the grain number will decrease sharply<ref name=fao_wheat/>. The lowest yield will happen if the water deficiency starts from 10 days before spike emergence. | |||
====='''Anthesis to maturity'''===== | |||
Water deficiency close to anthesis will accelerate the development, but the eventual grain weight will decrease due to a shorter grain filling period<ref name=fao_wheat/>. | |||
====='''Water deficiency related to grain yield'''===== | |||
It is clear by now that a water deficiency leads to a lower grain yield, but how exactly is shown with the following formula: | |||
GY = T * TE * HI, where GY is grain yield, T is the product of transpiration, TE is the transpiration efficiency and HI is the harvest index<ref name=fao_wheat/>. | |||
===='''Water deficiency related to grain yield'''==== | |||
The reason that fertilizer is used to grow crops is because it adds nitrogen to the soil, which wheat needs to grow<ref>https://en.wikipedia.org/wiki/Fertilizer</ref>. After water, nitrogen is the biggest constraint to crop growth, it is especially needed for leaf growth<ref name=fao_wheat/>. | |||
The biggest yield gain to be gotten if the nitrogen is added right before the initiation of stem extension. The nitrogen concentration in the spike during the anthesis stage correlates closely with the grain yield of crop<ref name=fao_wheat/>. | |||
Around 25 kg of nitrogen is required in the fertilizer to produce 1 tonne of wheat<ref name=fao_wheat/>. The nitrogen can be added in two stages to increase the efficiency<ref name=fao_wheat/>. | |||
==='''Nutrients'''=== | ==='''Nutrients'''=== | ||
| Line 1,231: | Line 1,254: | ||
|} | |} | ||
=='''References Appendix'''== | |||
<references/> | |||
Latest revision as of 22:17, 13 April 2017
Group members
- Guus van Dongen 0960106
- Johan Somers 0876720
- Teun de Groot 0951139
- Jur Bartels 0885497
- Laurence Keijzer 0900387
- Bastiaan Wuisman 0884362
Project Description
The world population is growing very fast [1]. It is expected that the world population will reach 11.2 billion people by the year 2100. Nowadays, around 800 million people will go to bed without a proper meal [2]. This problem will only grow when the world population increases, since there won't be any space left to grow crops. To tackle this problem, precision agriculture and robotics can be a solution. Precision agriculture is a way to reduce the amount of fertilizer, water, seeds and fuel used and to increase the overall yield per hectare so less resources and ground will be needed. Besides the global impact which precision agriculture and robotics can have on the ecology and the food production, it may of course also be a very interesting investment for farmers to decrease the costs and increase the production without having to expand their fields.
A user-friendly interface will be presented in which the impact of drones on the yield of the farmer will be displayed. This impact will be based on the nitrate level and the precise regulation per subsection of this level when drones are being used. In this model only fields where potatoes are cultivated will be able to be analyzed. The farmer will be able to recreate the field and fill in all the values for every subsection. Then, based on the outputs of the model, an advice can be made on whether the usage of drones will be profitable for this field.
Use Aspects
It is important to check what the USE aspects are when trying to locate possible problems and trying to counter those. The use of this model can have impact in the following USE related topics:
Positive USE aspects
- Societal problem of hunger in combination with the growing world population
- Cheaper food for consumers
- Make the cultivation crops more profitable
The use of this model is directly related to the use of drones in agriculture. When it becomes clear (out of the model) that it might be profitable for farmers to use drones, they might be more willing to actually adapt drone technology. This then leads to higher yield with probably a more efficient use of fertilizers. In this way, more food is produced on the same amount of area. This will help to create enough food for the generations to come. When enough food is available this also ensures that prices of food won't rise or will even be lowered due to the market forces. This also helps to make sure that food will become and remain available for all of the world population. A more direct and short-term effect of the use of drones in agriculture is the fact that farming might become more profitable. The use of our model and drones will give farmers a better insight in their production. This insight will reduce inspection time of the farmer, increase the yield and decrease the amount fertilizer which has to bought. This all results in a more profitable company.
Negative USE aspects
- Less jobs available in agriculture
- Farming investments may become too expensive
This model and therefore the use of drones won't always have a positive effect on the people who are involved. The main reason to automate things is the reduce costs by replacing men by machines. This is also the case with the usage of drones in agriculture. When drones take over inspection tasks, less people are needed. There will, however, be more jobs available for drone servicing and data processing. But, these jobs require different skills and knowledge. Some employees might be willing and have the capabilities to get additional education and switch jobs. A thorough search for other jobs has to be done for the employees who can't or won't get additional education. Another possible problem is the rise in investments. When drones are widely adopted, farmers without drones might not produce efficient enough to survive in the market. Therefore it becomes 'obligatory' to use and thus invest in drones. This might result in too high initial investments for new farms. Which in its turn results in a market with only a few big farms that survive, which is a bad thing for the economical landscape.
The following USE-agents are chosen for this project:
- Primary users: The primary users for the models are the farmers. They are going to work with the technology as a tool to optimize the food production.
- Secondary user: Consultancies and contractors. Consultancies and contractors might start using the model to inform their customers about the possibilities of using drones.
- Society: Everyone in society might be influenced by this model, because it can lead to a higher quantity (and quality) and a lower price of food.
- Enterprise: The companies who produce the drones and software.
Project Planning
Below are the planning per week and the responsibility division presented. The planning was made at the beginning of the project to provide a guideline to finish the project in a proper manner. The planning was made with the idea to build a solid basis on which the interface/model would be expanded during the project. Of course, the first two weeks were designated to gain knowledge about the field of our project. So, we wanted to explore the current state of the art of robotics in agriculture. Week three was dedicated to contact users and gain insight in the problems of farmers. In this way we could specify our project to the needs of farmers and create a real valuable project. With the information from the farmers we could decide what the exact problem would be that was going to be tackled in the project and thus make a start with the model. Week four and five would be used to implement a model which was suitable for a farm in the Netherlands. Week six was dedicated to extend the model so that it would be suitable on a global scale. Every model needs a lot of testing and tweaking before it is solid enough to present, that's why week seven was dedicated to do that. The model would be finished by week seven, so that week eight could be used to clean up the wiki and prepare the final presentation.
Week Planning
The general approach to create a successful project is:
- Research state of the art
- Abstract from state of the art
- Contact with user
- Create model
- Analyze impact
Week 1
- Create presentation
- Determine concept idea of drones helping for agriculture
- Research about state of the art
Week 2
- Finish the state of the art [milestone]
- Weeding
- Seeding
- Fertilize
- Harvesting
- Irrigation
- Crop protection
- Contact with User
- Definition of the problem
- Visiting van den Borne [milestone]
- Create presentation
- Create planning
- Evaluate scenario
Week 3
- Contact with User
- Contact with 'Jan Staal adviesbureau' made (Has contact with many farmers)
- Contact with 'Johannes Strever' (Uses GPS a lot)
- Contact with University Team (Are developing a drone for van den Borne)
- Formulate concept [Milestone]
- Start of the model [Milestone]
- Search for essential information (data)
- Economical
- Ecological
- Company scale
- Global scale
- Software: what software are we going to use
- Update wiki
Week 4
- Implementing the model in software [Milestone]
- Update wiki
Week 5
- Finished model of application in the Netherlands [Milestone]
- Update wiki
Week 6
- Finished model global scale [Milestone]
- Update wiki
Week 7
- Testing the models [Milestone]
- Changing the models
- Update wiki
Week 8
- Finished Wiki [Milestone]
- Formulated advise [Milestone]
- Prepare Presentation
- Giving Presentation
Gantt chart
Responsibilities
The following responsibility division was made to streamline the entire project.
We were able to stick to the project planning for the first three weeks of the project. But after that circumstances forced us to deviate from the original planning. What circumstances caused this and how we continued with the project can be found in section 7 'Models'.
Previous work
To create a good overview of what kind of research has already been done or is going on at the moment a literature study is conducted. This is done for multiple knowledge fields. A more general literature study of what kind of robots are available for agriculture can be found in the Appendix. Besides that, there has been looked into the topic 'Robotics in agriculture' with an eye on the economic impact. Finally, a specific search on the feasibility of drones in agriculture has been done.
Robotics in agriculture
Graetz, G. & Micheals G.
A study by George Graetz and Guy Micheals is called 'Robots at Work'[3]. It discusses the economical impact of industrial robots in general. However, one of the subsections they are talking about are field like mining and agriculture. The research is mainly focused on the impact which robotics has on the economics as it is nowadays. It doesn't predict what the future holds and in what fields it might be more profitable to use robotics and / or drones. The mathematical empirical model they present predicts the following:
- A fall in robot prices leads to an increase in robot density.
- An increase in robot density leads to an increase in average labor productivity in the robot-using sector.
Robotics in agriculture can't really add a lot of value to the products, which makes the impact of robotics in agriculture minimal according this study. The relation between the added value versus the relative time a robot is used can be seen in the plot underneath. In this plot it can be seen that agriculture has one of the lowest values.
As the study isn't in particular about agriculture there isn't a clear conclusion to be drawn with respect to agriculture. Except the fact that robotics haven't contributed a lot in the economics of agriculture until now.
Fountas, S. & Pedersen, S.
Another interesting work is 'Agricultural robots-System analysis and economic feasibility'[4]. This paper provides feasibility studies for three different applications: robotic weeding, crop scouting and grass cutting. The study especially looks into the possible cost reductions in the different scenarios.
The scenario of using drones / automated fertilization isn't included in the study. The study only looks at labor intensive tasks and how to save money on that by automating those tasks. This study doesn't include the better growth (and thus higher yield) of proper weeding for instance. And the growth is especially important for our model.
Sorensen, C. & Madsen, N.
In the study 'Organic Farming Scenarios: Operational Analysis and Costs of implementing Innovative Technologies' a research is done to investigate the profitability of weeding robots [5]. Based on the price of approximately 27000 euros for a weeding robot, the costs of weeding can be reduced to 85 euro per acre. This cost reduction holds when a contractor is hired. This reduction will range from 47 to 56 percent when the weeding efficiency is 75 percent instead of 100.
The above articles are only the tip of the iceberg regarding the articles written about automated agriculture. A conclusion can be drawn that robotics aren't used a lot in agriculture now. Therefore, they haven't contributed a lot to the current turnover in agriculture. There is, however, a lot of research and development going on nowadays. Studies like that of Fountas & Pedersen or Sorensen & Madsen show that when the prices drop and automation becomes more mainstream, robotics in agriculture will probably be profitable. Practically all the tasks which come with growing crops can be automated. Think of seeding, weeding, pesticide control and harvesting. This results in higher yields and more effective farming.
Drones in agriculture
Accenture
The commercial company Accenture is busy creating a Precision Agriculture Service [6]. This service includes environmental sensors in the field, NDVI images of drones, sensors mounted on field equipment, weather forecast data and soil databases. This information is combined to produce an harvesting advice for instance. The company ran a pilot with 2000 farmers. An average of 15 percent rise in crop productivity was obtained.
This isn't directly linked to the usage of drones, but as drones were a part of the whole system, they contributed to the result.
Informa Economics and Measure
A report of 'Informa Economics and Measure' looked at the profitability of drones in agriculture [7]. The research assumes that around 20% of the ideal yield isn't reached. Partly because of weather factors and partly because of management factors. A drone could reduce the yield gap that is formed by the management gap, as can be seen the picture below.
By giving the farmer a better insight about the condition of the crops, he has more control in the growth of his crops and therefore a better yield will be obtained. It is calculated that the return of investment (ROI) is the highest for corn. This would be 12 dollar per acre. This results in a 2.5% yield gain. Soybeans and wheat are also mentioned, which will create a return of investment of approximately 2.6 and 2.3 dollar per acre. This results in respectively 2.5 and 3.3 % yield gain. These prices are especially interesting for farmers with a lot of land, for instance in the USA. That's also the country where the study is conducted. How these ROI numbers are calculated couldn't be found.
The thing that became clear when doing the literature study of drones in agriculture was that the potential is big. However there are limitations to the current drone technology and profitability models. Legislation is restricting the use of drones and therefore also the development. The technology isn't streamlined yet, which results in the fact that farmers experience more workload. The data that is obtained by drones isn't a clear advise yet. The farmer still has to do a lot of manual data processing, which is very labor intensive. That is why drones are only profitable on very big farms (>=2000 acres). Predictions about the future and profitability of drones in agriculture are still very rough or give too little information about how the results are obtained.
Potato
Production
In 2014 the countries with the highest potato production were China and India (95 and 46 million tonnes relatively)[8]. The Netherlands ranks 10th, however considering the population of said countries this is quite impressive. With the highest production per head being in Europe. The list is as follows according to “Food and Agriculture Organization of the United Nations”[9]:
| Country | Production (million tonnes) |
|---|---|
| China | 95.5 |
| India | 46.4 |
| Russia | 31.5 |
| Ukraine | 23.7 |
| USA | 20 |
| Germany | 11.6 |
| Bangladesh | 9.0 |
| France | 8.0 |
| Poland | 7.7 |
| Netherlands | 7.1 |
The average world farm yield for potatoes was 17.4 tonnes per hectare, in 2010. (America 44.3 tonnes per hectare and some New Zealand farmers 60 to 80 tonnes per hectare) [10]
The Plant
The potato plant reaches a length of about 60 cm [11] and can produce up to 300 seeds. There are over 4000 varieties of potatoes [12], but the most cultivated species is Solanum tuberosum. Each potato holds about 322 kJ per 100g[13]
Growth Process
Growth takes place in five stages:
| 1. Sprout and root growth |
| 2. Photosynthesis |
| 3. Stolons grow (runners, new plants can emerge from these) (stops above 27C) |
| 4. Tuber bulking (at this moment these factors are critical: optimal soil moisture and temperature between 10°C and 30°C, soil nutrient availability and balance, and resistance to pest attacks)[10] |
| 5. Maturation (sugars convert to starches) |
Potatoes are very sensitive to frost and can grow on any type of soil except saline and alkaline and preferably loose (pH 5.2 to 6.4)[10].
Important growth factors
The most important minerals for potato plants are Nitrogen, Phosphate, Potassium and Magnesium [14].
Nitrogen is absorbed by the potato plant. The amount which is absorbed depends on the stage of the growth. The begin stage absorbs more nitrogen, so this is where nitrogen is the most important. The total amount of nitrogen in the plant when it's fully grown is around 1.5% to 2% of the total weight. This means that an amount of 1.5 to 2% of the weight of the potato plants should be in the soil as nitrogen (about 150-200 kg/ha). Nitrogen is an important element in protein synthesis. Nitrogen deficiency produces light greet plants with stiff leaves and a low yield.
Phosphate is used in the entire growing process, but like nitrogen, it is absorbed the most in the beginning of the growth process. About 60 kg/ha of Phosphate is absorbed. About 0.7% of the total mass of a potato plant consists of Phosphate, so this amount has to be present in the soil. About 80% of the phosphate is concentrated in the stem of the plant. This amount is removed when the plants are harvested. The soil depends in which amount phosphate is absorbed, because phosphate is not absorbed very readily by the potato plant itself. More acid soils help to absorbed the phosphate. A low phosphate deficiency results in dirty green colored leaves and unsatisfactory growth.
Potassium is mainly absorbed in the period when the plant emerges to the point were the stem reaches its maximum length. This is a fairly short period, as can be seen in the above graph. Low levels of potassium in the leaves doesn't have as much of a negative effect as low levels of nitrogen. About 350 kg/ha of potassium is absorbed, which is a lot more than for instance Phosphate. Potassium deficiency in the leaves results in dark green and bronze discolorations. In the long term the plant might become necrotic, which is a form of cell death. Potassium deficiency in the tubes results in easy bruising.
Magnesium is not absorbed as much, but it has a big influence in the growth. About 30 kg Mg/ha is absorbed, mainly before the main stem has reacted its full length. Thus the magnesium must be present before this length is reached. Potassium impedes magnesium absorption. So, excessive use of potassium often results in magnesium deficiency. Magnesium deficiency results in more necrotic veins at the oldest leaves.
Water deficiency reduces the foliage growth and the efficiency of the photosynthesis. Furthermore, water deficiency stimulates maturity, which results in smaller tubes. Below are two graphs of the influence of water on the yield of potatoes in the season 2008/2009 (left) and 2009/2010 (right).
Soil pH influences the yield of potatoes directly. To show the effect, below is a table with results from a study that adapted the pH level of the soil to see the resulting yields, done over multiple years:
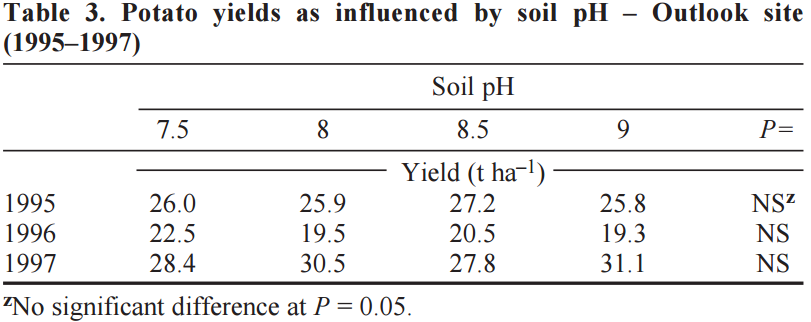 Cite error: Invalid parameter in
 <ref> tag
There are more parameters that influence the growth of potatoes. Think about temperature, light intensity and air quality. These parameters can be measured with drones, but can't be adjusted by the farmer. So it is not useful, in the scope of this project, to look at the impact of those values.
Models
Initial model
The initial setup for the model would consist of an ecological and economical impact precision agriculture would cause. The focus lay on drones and the use of image processing on the pictures drones can take of fields. This would include all parameters that the could be measured with this technique. Also, the idea was to do this for multiple crops in the Netherlands. A Visio chart was made to illustrate all the variables and relations were present, this chart can be seen below.
Simplifications
It was seen quite soon that the idea we had was too big of a task for this project, hence we had to simplify the model so a result could be gotten in time. One of those simplifications was the use of only one crop instead of making the model for several crops. This crop has become potatoes, since the usage of drones is very likely to work on potato fields. This simplification was made since it seemed very hard to find relations between the several factors for growth and the resulting yield. This lead to another simplification, namely not taking into account all growth factors. Nitrogen has been chosen as the growth factor that the model is going to analyze. Nitrogen is chosen, because it is one of the most important nutrients for potatoes to grow and because it can already be measured quite good with the use of cameras with infrared and near-infrared. This already implicates that also only one sort of camera is used, namely one that has the standard RGB and an added infrared and near infrared. One of the other big simplifications that has been made is that the extra time it costs for the farmer to use all this new technology isn't taken into account. This was one of the choices that had to be made to change the focus from an exact economical gain to an estimated growth in yield as outcome. This change had to be made since an exact economical outcome seemed to be to difficult for the amount of time available.
Final model
Input
The input of the model will consist of some old data from the farmer and new data received from soil measurements. The data the farmer has to give to the model are the old yield of the land, the nitrogen levels belonging to this old yield and the current nitrogen level for every subsection, received from soil measurements. Finally the most important input given by the farmer, this is the shape of the land that has to be analyzed, this can be done by dragging the subsections (squares) in the model to form the (roughly) correct shape.
Processing the data
For the processing the data some formulas are used, the main one being the one described in subsection "Nitrogen/growth-function", which is y = -0,0005x2 + 0.297x + 5.9366. This formula won't of course hold for every field and every situation, that is why the first step of the model is to correct the formula according to the old yield and nitrogen levels the farmer set as an input. The formula will be made to return the old yields the farmer gave in when the old nitrogen levels are used as the x-value. Furthermore the top of the graph will be put on the optimal nitrogen level, which is calculated by the formulas seen in the table displayed below.
| Destination | Guideline(kg N/ha) |
|---|---|
| Consumption potatoes, clay ground | 285 - 1,1 * (N-mineral 0-60 cm) |
| Consumption potatoes, sand ground | 300 - 1,8 * (N-mineral 0-60 cm) |
In these formulas the input is the current nitrogen level in the first 60 centimeters of the soil. When the formula is set correctly the fertilization level in the case without precision agriculture will be calculated from the average nitrogen level of the field. This fertilization level is obtained from the equation in the table shown above again. The fertilization in this case is the same over all subsections, this leads to a difference in yield per subsection. All these yields will be calculated and the average of all those subsections will be taken as the yield in kg/ha. After this, the case in which precision agriculture would be used will be reviewed. Firstly the nitrogen level per subsection will be used to calculate the fertilization per subsection, again using the equations in the table above. This means that the nitrogen level at every place in the field will be the same, so the yield is the same for every subsection. The average yield of the case in which precision agriculture would be used is then the yield of one subsection in kg/ha.
Output
The outputs of the model will be the average yields in the two cases, with and without precision agriculture. Another output of the model will be the amount of fertilizer used for each of the two cases. With this information a conclusion can be made about the use of precision agriculture on the field of this farmer.
Nitrogen / growth - function
It is very complex to predict the growth of a potato plant. A lot of variables influence the quantity and the quality of the yield. To make the problem workable we will only look at the relation between nitrogen and the yield. A lot of research is done on this topic, but every research has other boundary conditions, such as species, soil, weather, etc. These conditions deviate a lot between different tests. To create a basis for the model we tried to choose an average research. The research "Geleide N-bemesting voor aardappelen op basis van gewasreflectie-metingen" of F. van Evert showed relation between the amount of nitrogen and the yield. The research consisted of multiple different sub-tests with other boundary conditions. After a thorough comparison we thought that the sub-test 'Rusthoeve 2010 Consumptieaardappel' was the best test to use.
This sub-test consisted of multiple test fields near each other on which different amounts of nitrogen were applied. The species 'Victoria' was grown which is suitable for direct consumption or french fries. The test was conducted at farm 'Rusthoeve' in Colijnsplaat in Noord-beveland. The soil consisted of 1.7% organic material and the phosphorus conditions were good (PW 37; P-AL 51).
At the end of the growing period the yield per sub-field was inspected. The result can be seen in the following plot.
This graph gives the yield versus the amount of nitrogen added. For the model however, the relation between the yield and the total level of nitrogen is needed. To get this the y-values are increased with the base level of nitrogen for the field of the experiment. This base level is calculated by using the guideline formula in the table seen above. This table uses the optimum for the nitrogen level and so the optimum of this experiment should give the amount of nitrogen. The highest yield for this experiment is obtained with a nitrogen addition of 185 kg N/ha This results to the following equation:
N-mineral 0-60cm = (285-185)/1.1 = 90.90
When this base level is added to the nitrogen addition in the data the following equation can be obtained from a fit:
y = -0,0005x2 + 0.297x + 5.9366
In which y is the yield [ton/ha] and x the amount of applied nitrogen [kg/ha]. This fitted function has a R2 of 0,9717, which is an indication that the result is a good fit ( R2 = 1 is a perfect fit).
Assumptions
- The potato species chosen is Victoria, since the data used for the equation seen above was based on this species.
- All the other parameters influencing the yield and the growth of the plants are assumed to be controlled and on a sufficient level.
- The equation is based on an experiment on clay ground, it is however assumed that the relation can be used for sand as well as long as the offset is changed for the particular field based on the yield of earlier years.
- The previous assumption is made for all the factors influencing the growth, so it is assumed that the equation holds for every situation and that only the location of the graph changes for different situations.
Software implementation of the model
In order to get a working software implementation of the model firstly a platform is needed. HTML, CSS and JavaScript have been chosen to create a platform for the model to be implemented in. This also means the model can be viewed as a regular web page meaning there is no need for the user to download extra software to use it. The model requires inputs and outputs. Thus the site is divided in 2 blocks, the left being input and the right being output. The thing that drones are useful for is treating the land in multiple sections. So instead of bringing for example the average nitrogen level to the desired values drones can help to bring every subsection to the desired values. Therefor there is the need for a method to input values per subsection. A grid is designed, which allows each field to be turned on and off and a value will be able to be filled in in the active subsections. The website also allows for an image to be uploaded and re-scaled so it is easier for the farmer to select the fields which best define his land.
Manual
The website can be visited at https://lkeijzer.nl/potatoe/. The website is currently tested and confirmed working with Firefox and Google Chrome. The website does not work on mobile platforms, users using mobile platforms will be warned when opening the site.
The application has four stages: The parameter input stage, the drawing phase, the soil sample input stage and the calculation phase. Each phase is accompanied by a screen. The first three stages require user input, while the last stage uses these inputs to calculate the resulting difference in yield.
The first screen upon opening the website will appear as follows:
Here the user can input certain parameters for the application to use during the later drawing and calculation phase.
The following parameters are present:
- Field Width, Field Height and Square Area. These parameters should follow the measurements of the users field and the precision of the taken soil samples.
- A background image can be uploaded for use as a guide during the drawing phase. Think of images such as maps of the farm or official cadastre.
- The previous years total yield and Nitrate added to the field and the type of soil most common in the users fields. These are necessary to provide an accurate result, as explained in the modelling section.
After the inputs are given the "Next" button can be clicked on to move to the drawing phase. For the example a field of dimensions 1000x1000 meters and a square size of 2500m^2 will be used. A simple farm map has also been uploaded.
Thus the second screen will appear as follows
This is where the drawing phase has been entered. But before the drawing can be started, the image can be resized using the "Toggle resize/shape" option. When this toggle is set to off, the image can be freely moved and resized to fit the screen like this:
This can also be used to line up the squares better with the soil sample measurements.
After locking the image again by toggling the "Toggle resize/shape" button to on, the drawing can be started. Drawing here is simply covering all the points where soil samples were taken by clicking on the squares on the screen. In the example the result would look like this:
After all the soil sample spots have been marked, the "Next" button can be clicked on again to move to the next phase. Alternatively, at any point during this phase the "previous" button could be clicked on to return to the previous phase, in case any mistakes were made regarding the initial parameters.
When the "Next" button is clicked on, the following screen appears:
Now any of the colored squares can be clicked on to input the value of the Nitrate measurements in the soil sample on that spot:
After a value has been input and submitted by pressing "Enter" on the keyboard, the square will turn green to indicate that a submission has been made. The user can still click on the square and change the given value at any time. The application will also warn users when trying to input values on unusable squares, those are the squares which have not been marked in the drawing phase.
After a value for each square has been inputted the "Go" button can be clicked to start calculating the results. Again, at any time we can use the "previous" button to return to the drawing phase if we need to correct any mistakes.
After pressing "Go", the application will calculate the results according to the model described in the "Final model" section. The output will be shown on the right side panel which will pop out:
(Note: the numbers used in the example are randomly chosen and the output most likely does not reflect a real life scenario)
This screen shows the resulting yield and the potential difference in yield when drones are used.
This concludes the fourth and final phase in using the web application.
The full source code of the website is publicly available at https://github.com/JurBartels/USEfullPotatoe.
Advice
As a result of the model, an advice will be given to the user about the investment in drones. To give a good advice the costs and the value of the potatoes have to be taken into consideration.
The following factors are important in calculating the profit:
- The value of the crop: At the moment the potato species Victoria has a value between €22.00 and €24.00 per 100kg. [17].
- The cost of the Drones are described below.
- The costs for extra fertilizing: because the amount of fertilizer used changes, the costs change as well. At the moment fertilizer costs around €22.50 per 100kg. This fertilizer, named KAS 27, contains about 27% nitrogen. [18]
Drones
Camera
There are a few different camera's which can be used for drones in agriculture. The results of the images depends on the measurable band and kind of sensor on the drones:
- The RedEdge MicaSens: which is able to make pictures in five bands: Blue, green, red, red edge and near IR. It is very useful to do a health analysis of plants. This price for this camera is somewhere around $4900.
- Camera's like the Canon S110NIR: It can make pictures in the near infrared band. It is able to give information about biomass indication, growth monitoring, crop discrimination and leaf area indexing. This camera is for example used for the eBee-Ag.
- Camera's like the Canon S110RE: It can make pictures in the red edge band. It is able to give information about plant stress assessment, chlorophyll indication, senescence analysis and drought assessment.
- Camera's like the Canon S110RGB: It can make pictures in the visible spectrum. It is able to give information about real color 2D and 3D visual rendering, chlorophyll indication and drainage evaluation.
- Airinov multispec 4C: It is a sensor specially customized for the eBee-Ag. It contains four separate sensors that are controlled by the autopilot. These acquire data across four highly precise bands, plus each sensor features a global shutter for sharp, undistorted images. The camera is able to give information about biomass, leaf area indexing, nitrogen recommendation and phenology. This camera again is specially used for the eBee-Ag.
Measurable values
With the camera's described before it is possible to monitor the following things:
- Health analysis: Because the frequent measurements with the drone, you are able to control the growth and health of the plants
- Biomass: the camera's are able to look through the plant and measure the color. Therefore they are able to give a estimation about the biomass of the crop. The biomass is the total mass of the plant. This gives an estimation about the yield.
- The cameras are able to give information about the drainage evaluation.
- The cameras could give recommendations of the nitrogen
- The cameras can measure the Chlorophyll, this tells something about the amount of green pigments in the plant. Chlorophyll makes it possible for the plant to use the energy from the sun for the photosynthesis.
Marnix told that the information from the drones can be translated into nitrogen values really well. It is possible to give good recommendations about the amount of nitrogen in the crops. For our purpose a multi-spectral camera should be used.
Costs
For examining if it would be interesting for farmers to buy a drone, the different costs for flying with drones has to be investigated as well. An active drone user made a web page on which the costs for all the parts needed to start using drones are described. Apart from these costs, when using drones for professional business, other costs like fly courses and insurance also have to be taken into account.[19]
Taking all those thing into account the following total costs can be estimated:
General costs
Course (Exam) It is not required to have had such a course, but most insurance companies want to have a confirmation about the flying skills of the pilot before insuring the drone. The costs for a complete course are about €749.- ex VAT.
Licenses:
- Proof of registration (BvI): €73.-
- Special Exemption Certificate of Air Skill (S-BvL): €63.-
- Licence ROC-light: €234.-
Insurance: If drones are used for professional use. The user needs to have a insurance. The cost of an insurance for the drone is about €360.- euros per year.
Actual Drone costs
After being allowed to fly the hardware has to be bought. Underneath is a summation of the important parts and spare parts. [20] All of this is based on the DJI inspire 1. This is one of the drones Jacob van den Borne used when he started with this technology.
Consultancies / outsourcing companies
Another option to start using drones in agriculture is to outsource the drone usage, so things like licenses and drone parts don't have to be bought by the farmer. Outsourcing companies are an ideal way to reduce the costs and the time spent using drones. For this reason a research about existing outsourcing companies in the Netherlands has been done. The following outsourcing companies were found in this research:
Loonbedrijf Thijssen Nieuwehorne
This company uses soil sensors and an EBee drone to preform precision agriculture. They claim to that their services can reduce use of water, fertilizer and pesticides by 70%. The pixel size of the EBee drone is 10 cm, which creates detailed crop information maps.
De Samenwerking BV Elsloo
This company uses a lot of GPS to decrease overlap and increase efficiency, but they don't use drone image processing. They mainly equip their machines with GPS to be able to adjust the amount of different inputs depending on the location. However it might be very useful to contact to company to ask what their opinion is about the use of drones.
PrecisionHawk
PrecisionHawk is a company that offers drone solutions for all kinds of applications. One of these applications is agriculture. The company offers total packages which consist of the drone, service, apps and software. The user has to buy a license for the software annually. The cheapest and simplest packages which is offered is the 'Crop Scouting Package', which start from +- 1200 US dollar. The most complete package is the 'Lancaster Standard Kit'. This package start from 13000 US dollar.
The software offers a wide variety of diagnostic tools to evaluate the soil and the crops.
Company Thijssen, based in Nieuwehorne, is the only drone outsourcing company found in The Netherlands. Contact with this company will ensure that some key parameters for the model are obtained.
Reflection
To make the work manageable for this project, the problem was scaled down. To do this, assumptions have been made. The model can be improved by removing assumptions. This makes the model usable for more farmers and creates a more accurate advise. It would be a great addition if more nitrogen/yield functions were added for different soils, potato species and other nutritions. This addition would make the outcome more accurate. To expand the model and make it usable for more farmers the model could be expanded with relations for maize and wheat or other crops. It would increase the functionality a lot, because these crops are among the most cultivated ones.
The interface could also be upgraded. The user friendliness can be improved by making the drawing of the contour easier. A possible easy addition is to make it possible to sketch the contours in a loaded picture. A long-term goal is to make sure that the land of a farmer is recognized via image recognition. Another improvement for the user friendliness would be to let all the nitrogen levels of the subsections of the field be filled in automatically with the data gained from the soil research.
Conclusion
At the end of the project, the model is finished. The user is able to fill in the properties of the field like the size and sample size. On the second page he can upload a picture of his field and mark the measured squares. On the next page it is possible to fill in the amount of nitrogen per square. Finally the program will calculate the maximal possible profit that can be reached if the amount of nitrogen will be optimal. On this wiki the costs for starting to use drones for agriculture are also estimated. Therefore, by combining this information, the user is able to make an estimation of the profit for maximization of the yield and the cost of the drones. Eventually the user can determine whether or not it would be profitable in his specific circumstances to start using drones for optimization.
As for the conclusion of the project, all goals finally set are met. The main goal was to make a model for farmers in which they can calculate how the yield can be improved by optimizing the nutritions, water and other important growth factors. Because of the complexity and the limited time available, the model is simplified. Eventually the model only takes into account the amount of nitrogen. So the initial main goal of the project is partially reached, but improvements can be made.
Contact with specialists
Van den Borne
We visited one of the most advanced precision farms in the Netherlands, where a lot of new techniques for precision agriculture are being used. The name of the farm is Van Den Borne Potatoes. The biggest difference on this farm is that almost everything they do with the potatoes is done by precise machines. They are able to work with a precision of 6x6 meters.
We had a conversation with Jacob in which we talked about the pros and cons of precision farming and the usage of new technologies.
He explained to us that by using new technologies you will get more work, but it is worth it because of the higher yield gained. The investment in technologies costs a lot of money. But because of the precise measurement and management of the plant, you are able to reduce the overlap, meaning that there are less resources used. This saves a lot of money if you are a big farmer. The biggest problems he struggles with are the legal restrictions. There are many rules for flying with drones which makes it hard to work with this technology.
The cameras they are using are able to collect a lot of data. One of the cameras measures 5 different spectra, the standard RGB and the extra close-infrared and normal infrared. The pictures made with this camera are stitched together, so one big picture is gained. This picture is then analyzed. With the pictures of another drone with a normal camera, they are also able to make a 3d model of the farmland.
Jacob explained that the precision farming is mostly used with corn, wheat and grass. Van den Borne grows potatoes, because potatoes have a high efficiency. He also explained to us that if the bottom of your farming land exists of sand, you have to add liquid manure. When working with the precision agriculture concepts on sand the results are much better.
All machines that are required for executing the process of growing potatoes are designed for operating with GPS. Everything that happens on the land of van den Borne will be actuated by a computer.
The only part that is difficult with the technology is that it is simple to measure all kinds of things, but it is difficult to process the 'raw data' to data you can work with. It will always stay hard to exactly tell, out of a picture, where you should change something for optimizing the grow process.
The current project he is working with right now, is that of a building team that tries to build a new drone. And because of the legal restrictions he is observing the possibilities for using drones that fly with a fixed power cable. [21]
Eline van den Haak
We had a conversation with Eline about our project. We asked her about the procedure to do soil research and how the results are presented. She showed us an example of an soil analysis. Eline advised us to find contact with an employee of Van den Borne named Marnix. We had contact with Marnix about the data analysis of Van den Borne. Marnix gave us data files from the potatoes of 2016, so we are able to check the data en try to find some relations between the nitrogen and the yield. Furthermore we talked about the work she did. She explained us the difficulties. She told us where we could start with finding information for our model.
Wouter Kuijpers
We also had contact with Wouter. He is PHD student and is doing research about grow models of tomatoes. Tomatoes behave like potatoes, but he could not really help us with finding information for the relation between nitrogen and yield.
Marnix van den Brande
We had contact with Marnix. He was a coworker of Van den Borne. New he switched jobs, but is still the contact person for students. Eline van der Haak advised us to contact him. We did a lot of research for Van den Borne, to find relations between the measurements and the yield. He wrote a MSc-thesis. The thesis estimated the amount of nitrogen in the plant via sensor measurement. Furthermore Marnix helped us with some questions about the drones, the camera’s and the analyzing process. Last he advised us to go to the slot presentation from Puck Mulders. Puck is master student Data-Science and did investigation to find relations between the different measurable parameters. Last Marnix gave us some datasheets from Van den Borne, so we are able to find relations out of the data ourselves.
Puck Mulders
After the contact with Marnix, Teun and Johan went to the presentation of Puck Mulders. She is a data science student who is searching for correlations between growing days and key potato plant parameters. The presentation was very interesting and she was very keen to help us. Unfortunately she had a meeting right afterwards so she couldn't help us face to face. But, there is an e-mail conversation going on.
References
- ↑ https://ourworldindata.org/world-population-growth/
- ↑ http://www1.wfp.org/zero-hunger
- ↑ http://eprints.lse.ac.uk/61155/1/__lse.ac.uk_storage_LIBRARY_Secondary_libfile_shared_repository_Content_Centre_for_Economic_Performance_Discussion_papers_dp1335.pdf
- ↑ https://www.researchgate.net/profile/Spyros_Fountas/publication/225527407_Agricultural_robots-System_analysis_and_economic_feasibility/links/00b49528e6ebce9eda000000/Agricultural-robots-System-analysis-and-economic-feasibility.pdf
- ↑ http://ac.els-cdn.com/S1537511005000498/1-s2.0-S1537511005000498-main.pdf?_tid=2cc40cfa-1523-11e7-b820-00000aacb35e&acdnat=1490862827_2df60b2f3be11ff61520be60237058c9
- ↑ https://www.accenture.com/_acnmedia/Accenture/Conversion-Assets/DotCom/Documents/Global/PDF/Digital_3/Accenture-Digital-Agriculture-Point-of-View.pdf
- ↑ http://www.desmoinesregister.com/story/money/agriculture/2015/07/21/drones-farm-savings-agriculture-millions/30486487/
- ↑ 8.0 8.1 http://www.fao.org/faostat/en/#data/QC/visualize
- ↑ http://www.fao.org/home/en/
- ↑ 10.0 10.1 10.2 10.3 http://www.fao.org/potato-2008/en/potato/cultivation.html
- ↑ https://books.google.nl/books?id=QDrqL2J-AiYC&pg=PA209&dq=potato+plants+60+cm&redir_esc=y&hl=nl#v=onepage&q&f=false
- ↑ http://news.nationalgeographic.com/news/2002/06/0610_020610_potato.html
- ↑ https://ndb.nal.usda.gov/ndb/search/list
- ↑ 14.0 14.1 http://www.aardappelpagina.nl/doc/potatoes_cultivation_netherlands.pdf
- ↑ 15.0 15.1 http://www.agrojournal.org/20/02-11.pdf
- ↑ http://www.kennisakker.nl/kenniscentrum/handleidingen/teelthandleiding-consumptieaardappelen-bemesting
- ↑ http://www.boerderij.nl/Opmaat/Dashboard/
- ↑ http://www.boerderij.nl/Opmaat/Dashboard/marktprijs/82/761/Farmers4all/Kunstmest/KAS-27-4-MgO-Noord/
- ↑ https://www.dronewatch.nl/wet-en-regelgeving/
- ↑ http://www.hobbypiloot.nl/FAQ/Wat-kost-ut
- ↑ http://www.vandenborneaardappelen.com/
Sources
       1.Company that makes ground scans and 3D scans with drones: https://3dr.com/
       2.Drones made for agriculture: https://www.sensefly.com/applications/agriculture.html
       3.  Drones that also map the ground: http://www.precisionhawk.com/
       4.  Examples of agriculture robots: https://www.intorobotics.com/35-robots-in-agriculture/
       5.  Some facts and companies analyzed: https://www.therobotreport.com/news/ag-in-transition-from-precision-ag-to-full-autonomy
       6.  Benefits analyzed: https://www.geospatialworld.net/article/drones-and-robots-future-agriculture/
       7.  Professors etc. giving their views: http://fruitworldmedia.com/index.php/featured/robots-huge-potential-robotics-agriculture-industry/
       8.  Japanse company that founded a fully autonomous indoor farm: http://spread.co.jp/en/sustainable-farming/
       9.  Project of the EU for percision lifestock farming: http://www.eu-plf.eu/index.php/publications/
       10. eLeaf technology: http://www.eleaf.com/products-showcase-fruitlook#technology-pimapping
       11. Automated precision weeding: http://www.bluerivert.com/
       12. Case study of drones in argiculture https://blog.dronedeploy.com/case-study-ce39c9f44e48#.tsnfhikpp
       13. Mechanical weeding robot http://link.springer.com/article/10.1023%2FA%3A1015674004201?LI=true
       14. Seeding and fertilazation robot goo.gl/s2ehLC
       15. Machine-to-machine communication goo.gl/UVJDFS
       16. Framework for argicultural systems goo.gl/RGzsuo
       19. Bosch Weeding Robot: https://www.deepfield-robotics.com/en/Weeding.html
       20. Drip Irrigation Of Row Crops: What Is The State Of The art? https://www.ksre.k-state.edu/sdi/abstracts/drip-irrigation-of-row-crops.pdf
       21. State of the art - on irrigation farms. Edition 1  http://vro.agriculture.vic.gov.au/dpi/vro/vrosite.nsf/pages/lwm_state_art_irrigation_docs/$FILE/Stateoftheart_edition1_web_tagged_final.pdf
       22. State of the art - on irrigation farms. Edition 2  http://vro.agriculture.vic.gov.au/dpi/vro/vrosite.nsf/pages/lwm_state_art_irrigation_docs/$FILE/Stateoftheart_edition2_web_tagged_final.pdf
       23. Pesticide spraying robot: http://www.araa.asn.au/acra/acra2005/papers/sammons.pdf
       24. Soil Ph influence on the yield of ceirtain crops https://www.nrcs.usda.gov/Internet/FSE_DOCUMENTS/nrcs142p2_053293.pdf
       25. Extremely in-depth doc on how to control the Ph value of soil. Even the effects of a single type of nutrition in the soil on the Ph level http://extension.cropsciences.illinois.edu/handbook/pdfs/chapter08.pdf
       26. Contains data about what crop type needs what Ph level http://www.cropnutrition.com/efu-soil-ph
       27. Influence of nutrition supply on the crop yield http://www.eolss.net/Sample-Chapters/C10/E5-21-03.pdf
       28. Influence of Ph value on the yield and marketable yield of potatoes. With concreet data which we can use http://www.usask.ca/agriculture/plantsci/vegetable/resources/journal/Impact_pH_scab.pdf
       29. Influence of water on the yield of potatoes, inc data and graph representation http://www.agrojournal.org/20/02-11.pdf
Tasks
| Task divison week 3 | |
|---|---|
| Crops research | Bastiaan + Laurence |
| Edit wiki | Jur |
| Contacting users | Guus |
| Consultancies | Johan |
| Model specifications | Johan |
| Problem description | Johan |
| Overlap and drones research | Teun |
| Impact model study | Jur |
| Planning on wiki | Guus |
| Visio model | Teun |
| Create Logbook wiki | Jur |
| Farm data | Guus |
Logbook
| Week | 1 | 2 | 3 | 4 | 5 | 6 | 7 | 8 |
|---|---|---|---|---|---|---|---|---|
| Guus van Dongen | Brainstormed about the subject. Research on the topic of robotics for seeding. | Visited van den Borne. Prepared an interview and processed the results. Made a presentation, planning and gannt chart. | Had contact with Straver and Jan Staal but they had no time last week. Prepared Interviews. Collecting valuable information from 'Boerderij' and CBR. | Made a start on the complex model. Defined the concept of the model. Defined the input, | Have conversations with Eline and Wouter, contact with Marnix. | Defining new concept, find relations for the nitrogen, Analyse data from Van den Borne | ||
| Johan Somers | Brainstormed about the subject to research and did a general information search on the topic of robotics in agriculture. | Also went to Van den Borne, and prepared and gave the presentation. Also did a state of the art research to weeding robots. | Update the wiki and add parts of the model variables and the project description (2.5 hours), had a useful brainstorm with the group to make a start with the model, searched for consultancies and drone outsourcing companies. | |||||
| Teun de Groot | Brainstorming and finding useful sources about our topic, robotics in agriculture. | Went to Van den Borne for an interview. Did a state of the art research about use of robots in the fertilization process. Correcting wiki in grammar and syntax. | Made a first draft for the Visio chart for the economical model. | Cleaned up the wiki and checked everything on grammar and syntax. | ||||
| Jur Bartels | Brainstorming about the topic, finding resources and making a start with the wiki | Did state of the art research for robots in harvesting, updated wiki | Researched previous work done in modelling impact of robotics in agriculture, created logbook and task list in the wiki | Research about different drones | Started work on the website | Work on implementing the model and interface of the website | Finish up website | Work on wiki, give final presentation |
| Laurence Keijzer | Brainstorming about robotics in agriculture + research. | Went to Van den Borne for the interview + state of the art research about use of robots in irrigation. | Done research about different crops we want to use in our model | Gathering more information about wheat and what water and fertilizer have on the growth rate of wheat | Started working on implementing model in website | Working on implementing model in website | Working on implementing model in website | Clearing up wiki |
| Bastiaan Wuisman | Research about our topic and thinking about a topic. | Visited Van den Borne for an interview about his farm. Did a state of the art research about use of robots in pest control. | Researched potato growth | Researched the effect of water on crop growth. Also started the creation of the platform for the model | Some more research, but mainly continued the implementation of the model | Model implementation | Model implementation | project finalization |
Appendix
This appendix consists of all the information that is gathered over the weeks but is no longer relevant for the goals finally set. They still hold some informational value and therefor are still on the wiki. The first part is information that was gathered during the literature study, specifically a literature study to see what types of robots already existed in agriculture. The reason this is no longer relevant is because the goal of our project was adjusted to only include drones. Therefor there no longer was a need to have information about other robots.
The second part is information about maize and wheat. This information was gathered because at some point during the project the goal was to look at three different crops; potatoes, maize and wheat. But because the eventual goal only includes potatoes, the information about maize and wheat is no longer needed for the project itself.
State of the art automated agriculture
Information about the state of the art robots in agriculture.
Weeding
There are some quite exciting technological developments going on in the area of automated weeding. The most important technologies will be discussed below.
Deepfield Weeding Robot
The first far-developed technology is the Deepfield Weeding robot of Bosch, see below.
This robot has GPS navigation to move through the fields with a 90% electrical efficiency. A row of linear actuators is attached to the bottom of the robot. When the robot detects weed, it punches one of the actuators in the ground the destroy the little plant. The company claims that the positions accuracy is 2 mm and that it can remove 20 weeds per second. Given 40 weeds per square meter, the robot can process a hectare in three hours. The machine will cost about the same as a mid-sized tractor [1].
Advantages of this design:
- Herbicide-free farming
- Relative fast operation
Disadvantages of this design:
- Only suitable for small weeds
- Only suitable for field with small crops
There is also an other variant of this machine under development. This machine looks almost the same, but it does use herbicides. A greater working with of six to seven meters is possible with foldable booms. This machine will still lead to massive herbicide savings, but with a much bigger capacity potential.
LettuceBot
A company called Blue River created a robot which can identify weed and excess planted lettuce plants with the use of image recognition. When it is determined which plants need to be removed, the robot sprays a little amount of herbicide on it. This can result in a 90% reduction of use of pesticides. Currently the robot is towed behind a conventional tractor, but Blue River is working on an fully automated version of the LettuceBot.
While driving four miles per hour the precision is a quarter of an inch. The machine can process 40 acres per day and can cared for up to 5000 plants per minute. The machine also collects data about the plants when driving through the field to keep track of the growth and health of the plants.
Advantages of this design:
- It is already a fully functioning machine
- It is really fast
Disadvantages of this design:
- It can only be used on lettuce
- It isn't fully autonomous yet
Naïo Technologies
Naïo Technologies is a company that produces different types of weeding robots. They are suitable for different kinds of users and crops. The one thing that the different robots have in common is that they remove weeds by hoeing. This lets the robots stand out to the opposing companies and robots. The most important robots of Naïo technologies can be seen below.
The first robot is called 'Oz' and is suitable for smaller fields. The small battery driven robot has a maximum moving speed of 1.3 kilometers per hour. It follows the mounds via different optical sensors and RTK GPS. The robot can turn itself around to start independently with a new mound. It only uses about one euro worth of electricity to weed one hectare.
The second robot is created for bigger farms and uses the same techniques as the Oz robot.
The third robot is called 'Ted' and is used to weed vineyard. The maximum speed is four kilometer per hour and it can maintain a surface of about 25 hectares. This robot also shares the most techniques used in the other robots. The company is working on extending the capabilities of the robot with adding functionalities as mowing, leaf thinning and trimming.
Seeding Machine
There are two kinds of seeding machines, the normal one and the precision machine.
Normal seeding machine
A seeding machine is a device that is able to sow the seeds by metering out the individual ones. The machine positions the seeds in a soil and covers them to a certain average depth. The machines makes sure that the seeds are placed at equal distances and depths. Eventually the machine covers the seeds with soil so they can’t be eaten by birds.
Precision Agriculture
For the precision agriculture there is a new design for seeding machines. This model makes use of GPS. This makes it possible that the machine exactly knows where to drop the seeds.
Automated Seeding machines
In 2006 an Australian company designed a machine that is able to plant 6 rows at a time. Eventually the machines have been sold to English and Dutch farmers as well.
Field robot event
In 2016 there was a robot event in Hassfurt, Germany. One of the games they played there was a seeding game on the field. The robots have to operate on an area of 10 x 1 meters. The robot should take wheat seeds from a station and has to sow them on the area. There were no specific rules how the machines should complete the task. The robots had to distributes the seeds as even as possible and cover them with soil.
Other kinds of mini robot seeders:
Harvesting
There already are a few robots designed for the harvesting of crops. Due to the difference in the way certain crops should be picked, robots that harvest crops are often designed for one specific crop, such as bell pepper, cucumber or any other crop.
Sweeper[2]
The Wageningen University and Research center developed a robot for picking bell peppers in collaboration with a group of bell pepper growers. The robot is displayed below.
The robot picks the crops using a mechanical arm (The manipulator) and then places the crops into a container. To locate the peppers it uses multiple cameras to build a 3D picture, while trying to eliminate potential obstructions such as leaves. It has a special lighting rig to prevent bad light from being an issue. This robot was tested successfully in 2014, but was limited to slower speeds at that time due to fear that higher speeds may damage the crops.
MIT Robot Gardener
MIT developed its own gardening robot in 2009. The robot has a mechanical arm for picking the crops and a watering pump to water them. A difference with the usual approach here is that the robot does not contain any sensors to analyze the plants, the sensors are placed on the plants themselves. Using sensors that can detect soil humidity and other techniques borrowed from botanical science, the sensors broadcast the need per plant, giving this technique a high precision in picking and watering the plants.
Agrobot SW6010
The Agrobot SW6010 is a commercial berry picking robot. It features a rather large truck-like design, but is fully capable of autonomous harvesting of berries such as strawberries. To pick crops it utilizes a set of precision arms, with five arms on each side. Using the multiple arms, the robot can reach multiple plants and pick crops more efficiently. There is space for two passengers to check and sort berries that the machine collects. To identify the berries, the system uses the companies patented AGvision system, which supposedly determines the ripeness of the fruit by analyzing the color and form.
Cucumber harvester
Another project of the Wageningen University and Research center is a robot for cucumber harvesting, which utilized a double camera system and a mechanical manipulator arm to detect and harvest ripe cucumbers. They built and tested a prototype in 2001 and were able to detect 95% of the ripe cucumbers, and successfully picked 75% of those. The vision techniques developed by this robot can be found in multiple modern harvesting robots.
Flyer[3]
Berry Nice
This machine is a berry picking machine developed by the Japanese Shibuya corporation. It features robots that move on rails in contrast to most autonomous robots which use wheels. Using rails increases stability and speed, but makes adapting the system more difficult as the robot can only move to where the rails are. It also uses 3D stereo cameras to determine ripeness.
CROPS solution[4]
The CROPS solution is a modular adaptable robot to harvest ripe fruits, the project is sponsored by the European Union. The goal of the project is to develop a robot that can not only harvest one, but multiple types of crops easily. It uses FinRay fingers, which are adaptable grippers to hold a fruit, and a knife to cut the fruit off the plant. To detect ripeness, cameras and color and humidity sensors are used.
Fertilization
There are some different aspects in the fertilization process that are currently improved by the use of robots. Four of the main aspects are soil Electrical Conductivity mapping systems, GIS services, precision sampling and precision fertilization. Those four aspects will be discussed below.
soil Electrical Conductivity mapping systems
Soil Electrical Conductivity (EC) is a measurement that correlates to soil properties affecting crop productivity including soil texture, cation exchange capacity, drainage conditions, organic matter level, salinity (salt level) and subsoil characteristics. This information is used to make a fertilization plan. Soil EC is one of the simplest and least expensive ways of soil mapping for precision fertilization. Some examples of soil EC mapping systems are the EM38-MK2 sensor (left) and the Dualem 21s sensor (right).
Below, the result of a Soil EC measurement is given, this map is made by dragging the sensor across the field. The sensor measures how good the different patches of soil conduct electricity and the needed data can then be determined from this information.
GIS services
GIS is short for Geological Information System. GIS services use satellites to analyze all sorts of geological information. With the aid of GIS, maps of fields or farms are created with different layers (yield map, EC map, soil sampling, remote sensing, etc.), allowing the precise application of fertilizer (and other inputs) according to the variability of the field. Some examples of GIS services are Google Earth and esri.
Precision sampling=
Precision sampling is soil sampling with the use of global positioning system (GPS), which allows to precisely locate position in the field. First the field is mapped, after which a grid is placed over the field, dividing the field in smaller sections. In those grids sample sections are chosen, more sample sections means more accurate sampling, but also higher costs. GPS is then used to accurately take the samples, the accuracy of the GPS can be increased by using a correction signals. The accuracy can range from 500-1500cm to 1-2cm. Finally the soil is analyzed in a lab and the outcomes are displayed on a map.
Above is an example of a sampling grid. With this particular way of sampling the distribution of the sampling sections gives the most accurate outcome. It is called a diamond sampling pattern, since the sampling sections are in a diamond shape, as can be seen above.
Precision fertilization
There are a lot of machines for precise row fertilization. These machines inject the fertilizer into the ground in very precise quantities so that every spot gets the exact amount of fertilizer it needs. An example on the market is for instance the “precisiebemester”, this machine promises a simple and cheap way for precision fertilization. The amount of fertilizer given is regulated by the use of different gear combinations, for every situation a combination can be calculated. There are also some devices[5] for regulation available.
Another example is the machine of ‘Schoonen precisie bemesting’. For this machine special injection wheels are developed, that make tiny holes in which a little bit of fertilizer is injected. A big benefit of this technique is that the ground gets aerated as well. This also leads to an improved root system[6] for the plants.
Irrigation
Irrigation is a big part of agriculture, without enough water the plants cannot grow and the harvest is lost. It is easy to spray water everywhere, but if we know exactly where the water needs to be and how much, we can save a lot of water that is otherwise lost in the soil and doesn't go into the plants.
Drip Irrigation
When it comes to row crops, it is possible to install a system that is called drip irrigation. As the name already implies with such a system you can control how much water every row of plants get. Besides controlling the amount of water, it is also a more efficient way of watering plants because you only use water where it is needed, not on places where there are no plants. These drip strips can be applied at the surface of a row of plants or buried under ground down to about 0.45m[7]., depending on what is best for the crops it is used on. There are many different drip strips each with different properties and suitable for different crops and environments. They vary in diameter, wall thickness, emitter spacing and emitter flow rates[7]
Soil Moisture Monitoring
There currently exist equipment that can be used to measure the moisture levels of the soil. This is especially useful in combination with watering systems that can moisturize different parts of the field with different amounts of water. This equipment enables the farmer to exactly see how much water there still is and to determine if the crops need water or if they can wait for the next rainfall[9]. This has the advantage that the crops don’t get too much water if there is rain coming and also not too little if the time of the year is dryer than normal.
Automated Bay Outlets
If there is a source of water nearby a big section of land it can be an option to use bay outlets. These can control the flow of water and in turn be used to decide how much water a section of land needs to get. With automated bay outlets this can happen automatically, saving the farmer time[22]. Not only can it save time, it can also reduce the water usage with about 5% to 9%, depending on the soil type[9] . Because these systems use telemetry, they can also be used to share their data with a central system and/or receive data from a central system. This way working as a group instead of separate entities.
Center Pivot Irrigation
The idea behind center pivot irrigation is that there is a large machine that rotates around a center point (the pivot point) and sprinkles water on top of the crops it rotates above. The advantage of a center pivot irrigation system over classical irrigation systems is that it uses less water to moisturize the same amount of crops[12]. It also consumes less electricity than ordinary systems when water needs to be pumped up to the farm.
Pest control
Applying pesticide to the crops is an integral part to agriculture. It is a subject with a lot of public attention, mainly concerning drift. This ‘drift’ is when some of the pesticide gets carried by the wind, or the ground to a lesser extent, possibly spreading it to nearby houses. Pesticide is harmful to humans, thus it is reasonable for the public to be concerned. Another group of people that has high stakes in this subject are the workers that apply the pesticide. It can be dangerous to them because they are in direct contact with the pesticide. Lastly it obviously impacts the costs of agriculture as well. The more pesticide is needed, the more it will cost. A possible way of reducing all of the above problems is the spray more precisely by using robots. Preferably even on a plant specific level. There are currently robots being developed to handle pesticide spraying.
Pesticide Spraying Robot
An example is a robot created by an Australian team. This robot is meant for indoor usage only, but it does show a proof of concept that robots can eventually take this dangerous job on them and be more efficient with the pesticide. The latter being useful for all of the USE aspects.
Steps for Pest Control
Pesticide use relies on 2 aspects in order to make it automatic. We already have the above information about the spraying part, but that only gets us half way. That way we can remove the dangerous task of spraying from the workers, but it doesn’t do any of the other promised benefits. For these to work we need detection of insects, again preferably on plant level, so we can spray more precisely.
Pest Detection Technologies
To get this working there are multiple technologies in the works. There are 3 main options at the moment. These being: computer vision, (near) infrared and scanning a sample size of plants using destructive methods. This last one not really being applicable to the situation, but is more aimed towards testing the harvested crops before selling them. The first 2 are more useful to growing plants. Computer vision more up close on a plant-by-plant basis while (near) infrared could be used with a drone on a slightly bigger scale (but possibly plant-by-plant if the resolution is high enough and you don’t fly the drone too high)
Crops
Information about different crops.
Maize
Production
The production of maize is the highest in the USA and China (361 and 216 million tonnes respectively)[13] with the land efficiency being around 5.6 tonnes/ha in 2014[13]. The list is as follows according to “Food and Agriculture Organization of the United Nations”[13]:
| Country | Production (tonnes) |
|---|---|
| USA | 361.1 |
| China | 215.6 |
| Brazil | 79.9 |
| Argentina | 33.1 |
| Ukraine | 28.5 |
| India | 23.7 |
| Mexico | 23.3 |
| Indonesia | 19.0 |
| France | 18.3 |
| South Africa | 14.3 |
The Plant
Maize (meant for harvest) grows about 3m in height[14], however some natural varieties are able to grow to lengths of 12m[15].
Growth Process
In the milk stage pollination has taken place but starch hasn’t formed yet, this is when corn can be harvested to get sweet corn. Sufficient soil moisture is critical to the growth of corn. Further it is a very versatile crop when it comes to climate[16].
Drone Usability
Drones seem quite useful when it comes to maize. Most symptoms of problems seem to be related to color, uneven growth or geometric changes in the leafs[17]. These symptoms then often lead to the problem being something to do with the soil (dry, wet, cold, crusted), which is partially possible to solve (more/less water). Mainly the color symptoms can be related to diseases or insects, this last one solvable using pesticide.
As to using drones to detect these symptoms, color changes are easily detect from pretty high (thus allowing to scan more crops in less time). However uneven growth might need to be scanned for at a lesser height, and especially geometric changes in the leafs. This geometry needs some relatively close scans (with the current resolution cameras), this is not suited for entire scans. Checking the geometry should be done on a reasonable sample size of plants distributed over the entire plot.
Wheat
Production
The production of wheat is the highest in the China and India (108 and 75 million tonnes respectively)[13] with the land efficiency being around 3.3 ton/ha in 2014 and a maximum of 10 ton/ha.[18] The list is as follows according to “Food and Agriculture Organization of the United Nations”[13]:
| Country | Production (tonnes) |
|---|---|
| China | 107.9 |
| India | 75.1 |
| USA | 59.2 |
| Russia | 44.1 |
| France | 36.1 |
| Canada | 25.4 |
| Germany | 22.0 |
| Australia | 21.0 |
| Pakistan | 20.6 |
| Turkey | 19.6 |
Growth Process
Here we will explain a bit about the different growth stages (GS) of wheat. We later refer to some growth stages when discussing the influence of water and fertilizer on the growth of wheat. Wheat is a C3 plant[19].
Germination to Emergence (E)
During this stage, the plant grows from a seed[20]. In order for germination to start, the seeds need a water content of 35 to 45 percent by weight[19]. Besides the water content the temperature also needs to be within the maximum range of 4 to 37 degrees C and optimally within 12 to 25 degrees C[19].
Emergence to double ridge (GS1)
The is the stage where the plant goes from just after emergence to when floral differentiation occurs[19]. The flowering of wheat occurs after vernalization, and the double ridge stage is only reached after the chilling requirements are met[19]. There are two main types of wheat, spring and winter type. While spring type has a mild response to no response to vernalization, winter type needs a cold period because has a strong response to vernalization[19]. This winter type starts out with high resistance to frost, but loses this resistance during this growth stage.
Double ridge to anthesis (GS2)
During this growth stage a plant will go from having only four to eight leaves to a plant that has developed flowers. At the beginning the apex is only approximately 0.5mm[19]. But during the terminal spikelet stage, the amount of leaves has gone up to 7 to 12 and the apex has grown to 4mm[19]. After this a spike growth occurs, of which the intensity and the duration are dependent on the amount of radiation the plant receives and the temperature. The more radiation the more intense the growth spike and lower temperatures, not lower than 4.5C, the longer this growth spike lasts[19].
Anthesis to physiological maturity (GS3)
During this stage the plant goes from having some flowers to a fully developed plant. The central part of the plant is where the anthesis begins and continues towards the basal and apical parts during a three- to five-day period[19]. After this the endosperm cells and amyloplasts are formed[19].
Influence of Water
There are two major processes that are involved with the usage of water: the first is the water absorption by the plant itself. The second is the crop evapotranspiration. This depends on net radiation, vapor pressure deficit, the crop ground cover and stomatal conductance[19]. Plant evapotranspiration (ET) is positively and linearly related to grain yield in C3 plants[19]. Because of this reason water shortage will decrease grain yield. See figure below:
Relationship of grain yield to seasonal evapotranspiration for irrigated and dry-land wheat crops
Next is the influence of water shortage on the different growth stages explained earlier.
Germination to emergence
The negative impact on seed growth in this stage can be reduced if the seeds are bigger[19]. Bigger seeds have a larger root mass and may help the plant of getting to the deeper water if there is less water available[19].
Emergence to double ridge
Drought during GS1 may result in an increase of the phyllochron of bread and durum wheat, but on the other hand leaf growth will suffer from a lack of water, especially if the water potentials are between -0.7 and -1.2 MPa[19]. The following table shows how less water influences the different stages of GS1:
| Stress Period | Stress Period | Stress Period | Stress Period | |
|---|---|---|---|---|
| Parameter | Control | Pre-anthesis | Anthesis | Grainfilling |
| Leaf area index at booting | 5.00 | 3.30 | 5.00 | 5.00 |
| Fertile tillers/m2 | 513.00 | 658.00 | 434.00 | 485.00 |
| Grains/spike | 32.70 | 13.00 | 27.10 | 31.40 |
| 1 000 grain weight (g) | 56.30 | 55.20 | 53.70 | 49.20 |
| Grain yield (g/m2) | 779.00 | 559.00 | 498.00 | 658.00 |
| Harvest index | 0.52 | 0.50 | 0.53 | 0.53 |
| Sugar (g) | 0.64 | 0.41 | 0.78 | |
| WUE (kg grain/ha mm ET)a | 16.80 | 14.60 | 12.40 | 15.20 |
aWUE = water-use efficiency; ET = evapotranspiration.
Double ridge to anthesis
Because GS2 is a period of active growth, a mild to moderate water deficit will decrease cell growth and leaf area with a consequent decrease of photosynthesis per unit area[19]. If water deficiency occurs during the spike growth period, the grain number will decrease sharply[19]. The lowest yield will happen if the water deficiency starts from 10 days before spike emergence.
Anthesis to maturity
Water deficiency close to anthesis will accelerate the development, but the eventual grain weight will decrease due to a shorter grain filling period[19].
It is clear by now that a water deficiency leads to a lower grain yield, but how exactly is shown with the following formula: GY = T * TE * HI, where GY is grain yield, T is the product of transpiration, TE is the transpiration efficiency and HI is the harvest index[19].
The reason that fertilizer is used to grow crops is because it adds nitrogen to the soil, which wheat needs to grow[21]. After water, nitrogen is the biggest constraint to crop growth, it is especially needed for leaf growth[19]. The biggest yield gain to be gotten if the nitrogen is added right before the initiation of stem extension. The nitrogen concentration in the spike during the anthesis stage correlates closely with the grain yield of crop[19]. Around 25 kg of nitrogen is required in the fertilizer to produce 1 tonne of wheat[19]. The nitrogen can be added in two stages to increase the efficiency[19].
Nutrients
| Nutrient component: | Maize / Corn | Wheat | Potato | RDA |
|---|---|---|---|---|
| Water (g) | 10 | 13 | 79 | 3000 |
| Energy (kJ) | 1528 | 1369 | 322 | 2000–2500 |
| Protein (g) | 9.4 | 12.6 | 2.0 | 50 |
| Fat (g) | 4.74 | 1.54 | 0.09 | |
| Carbohydrates (g) | 74 | 71 | 17 | 130 |
| Fiber (g) | 7.3 | 12.2 | 2.2 | 30 |
| Sugar (g) | 0.64 | 0.41 | 0.78 | |
| Calcium (mg) | 7 | 29 | 12 | 1000 |
| Iron (mg) | 2.71 | 3.19 | 0.78 | 8 |
| Magnesium (mg) | 127 | 126 | 23 | 400 |
| Phosphorus (mg) | 210 | 288 | 57 | 700 |
| Potassium (mg) | 287 | 363 | 421 | 4700 |
| Sodium (mg) | 35 | 2 | 6 | 1500 |
| Zinc (mg) | 2.21 | 2.65 | 0.29 | 11 |
| Vitamin C (mg) | 0 | 0 | 19.7 | 90 |
| Vitamin B6 (mg) | 0.62 | 0.3 | 0.30 | 1.3 |
| Vitamin A (IU) | 214 | 9 | 2 | 5000 |
| Vitamin E (mg) | 0.49 | 1.01 | 0.01 | 15 |
| Vitamin K1 (μg) | 0.3 | 1.9 | 1.9 | 120 |
References Appendix
- ↑ http://www.dairyherd.com/news/german-company-demonstrates-automated-weeding-machine
- ↑ http://www.crops-robots.eu/index.php?option=com_content&view=article&id=22&Itemid=22
- ↑ http://www.wur.nl/upload_mm/5/5/7/c221711e-98da-4865-805a-8fc8531aa624_flyer_cucumber%20harvesting_robot_uk.pdf
- ↑ https://www.festo.com/cms/en_corp/14014.htm
- ↑ http://www.precisiebemester.nl/precisiebemester/index.html
- ↑ http://www.precisiebemesting.nl/techniek.html
- ↑ 7.0 7.1 https://www.ksre.k-state.edu/sdi/abstracts/drip-irrigation-of-row-crops.pdf
- ↑ https://en.wikipedia.org/wiki/Drip_irrigation
- ↑ 9.0 9.1 http://vro.agriculture.vic.gov.au/dpi/vro/vrosite.nsf/pages/lwm_state_art_irrigation_docs/$FILE/Stateoftheart_edition1_web_tagged_final.pdf
- ↑ http://vro.agriculture.vic.gov.au/dpi/vro/vrosite.nsf/pages/lwm_state_art_irrigation_ed1
- ↑ 11.0 11.1 http://vro.agriculture.vic.gov.au/dpi/vro/vrosite.nsf/pages/lwm_state_art_irrigation_ed2
- ↑ http://vro.agriculture.vic.gov.au/dpi/vro/vrosite.nsf/pages/lwm_state_art_irrigation_docs/$FILE/Stateoftheart_edition2_web_tagged_final.pdf
- ↑ 13.0 13.1 13.2 13.3 13.4 13.5 13.6 http://www.fao.org/faostat/en/#data/QC/visualize
- ↑ https://books.google.nl/books/about/Races_of_Maize_in_Mexico.html?id=tXxQAAAAMAAJ&redir_esc=y
- ↑ http://www.agron.missouri.edu/mnl/86/MNL86.pdf
- ↑ Fernandez-Armesto, Felipe (2011). "The World: A History", p. 470
- ↑ https://www.aganytime.com/dekalb/tools/Documents/CornDiagnosticGuide.pdf
- ↑ http://www.fao.org/home/en/
- ↑ 19.00 19.01 19.02 19.03 19.04 19.05 19.06 19.07 19.08 19.09 19.10 19.11 19.12 19.13 19.14 19.15 19.16 19.17 19.18 19.19 19.20 19.21 19.22 19.23 19.24 19.25 http://www.fao.org/docrep/006/Y4011E/y4011e06.htm
- ↑ https://en.wikipedia.org/wiki/Germination
- ↑ https://en.wikipedia.org/wiki/Fertilizer
