Input: Difference between revisions
No edit summary |
No edit summary |
||
| Line 6: | Line 6: | ||
== Brightness == | == Brightness == | ||
== Temperature == | The brightness is measured by a sensor inside the bedroom. In the simulation this will be represented by an integer light strength. The value is determined by superposing the sunlight that falls through the blinds and the light generated by our wake-up light. It is assumed there are no other light sources in the bedroom. It is also assumed | ||
== Temperature == | |||
The room is to be modeled as a 3x4x2.5m box filled with air, surrounded by outside air on one side and the house all other sides. This proved to be more difficult than thought, therefor we will start with a simpler, linear model for temperature change: | |||
<math>dT = k*(T - T_\infty)</math> | |||
with k a heat transition constant (estimated at k = -0.05), T the room temperature and T<sub>∞</sub> the temperature the room assumes when not regulated, 12°C. when the heating is on an additional term is introduced: | |||
<math>dT_{heating} = h*(T_r - T)</math> | |||
with h a convection constant (estimated at h = 0.02) and T<sub>r</sub> the radiator temperature at 50°C | |||
== Sleep model == | == Sleep model == | ||
The Sleep Cycle App provides graphs to the user that show his measured sleep behavior during that night. Here's an example: | The Sleep Cycle App provides graphs to the user that show his measured sleep behavior during that night. Here's an example: | ||
Revision as of 19:26, 28 February 2016
Back to main page: PRE2015_3_Groep4
To the code: Code
To the output: Output
Brightness
The brightness is measured by a sensor inside the bedroom. In the simulation this will be represented by an integer light strength. The value is determined by superposing the sunlight that falls through the blinds and the light generated by our wake-up light. It is assumed there are no other light sources in the bedroom. It is also assumed
Temperature
The room is to be modeled as a 3x4x2.5m box filled with air, surrounded by outside air on one side and the house all other sides. This proved to be more difficult than thought, therefor we will start with a simpler, linear model for temperature change:
[math]\displaystyle{ dT = k*(T - T_\infty) }[/math]
with k a heat transition constant (estimated at k = -0.05), T the room temperature and T∞ the temperature the room assumes when not regulated, 12°C. when the heating is on an additional term is introduced:
[math]\displaystyle{ dT_{heating} = h*(T_r - T) }[/math] with h a convection constant (estimated at h = 0.02) and Tr the radiator temperature at 50°C
Sleep model
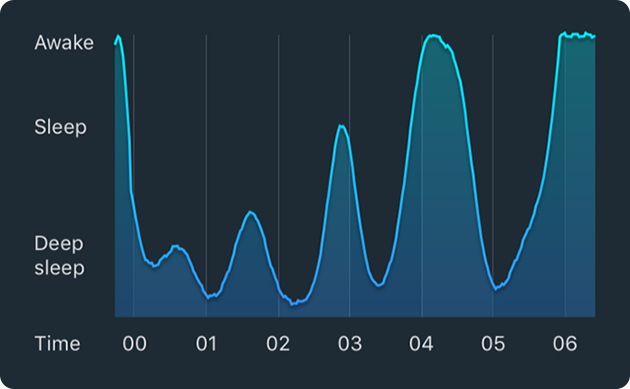
The Sleep Cycle App provides graphs to the user that show his measured sleep behavior during that night. Here's an example:
To model this pattern, we assumed that if the graph is split up in pieces with the peaks and valleys as cutting points, each piece will be sinusoidal with a random period and amplitude. Furthermore, we made the assumption that the period is normally distributed with mean 90 minutes or 5400 seconds (mean duration of one sleep cycle) and standard deviation 30 minutes or 1800 seconds. At first, we assumed that the amplitude is uniformly distributed, but people sleep deeper just after going to sleep and lighter just before waking up, so we had to come up with our own probability distribution. We decided to use the following probability density function:
[math]\displaystyle{ f(x) = rc \left( x - \frac{1}{2} \right) + 1 \qquad 0 \le x \le 1 \quad \and \quad -2 \le rc \le 2 }[/math]
[math]\displaystyle{ P(0 \le X \le x) = \int\limits_{0}^{x} f(x)dx = \frac{1}{2} rc \left( x^2 + \left( \frac{2}{rc} - 1 \right) x \right) }[/math]
So X is a fraction and the probability of X = x depends on the coefficient rc. How closer rc is to 2, how closer E[X] is to 1 and how closer rc is to -2, how closer E[X] is to 0. To get a random value for x, the second function needs to be rewritten, which gives:
[math]\displaystyle{ x = \frac{1}{2} - \frac{1}{rc} \pm \sqrt{ \frac{2}{rc} P(0 \le X \le x) + \frac{1}{rc^2} - \frac{1}{rc} + \frac{1}{4} } }[/math]
0 ≤ x ≤ 1, so for positive rc the ± becomes a + and for negative rc a -. If rc = 0, then this is a uniform distribution. If a value for P(0 ≤ X ≤ x) is taken from a uniform distribution with range [0,1], then a random value for x can be calculated.
globals [y
         Tgem
         start
         T
         p
         rc
         x
         R
         time
         stage
         test]

to Setup
  clear-all
  set y 100
  set Tgem (90 * 60)
  reset-ticks
end

to Go
  foreach [1 2] [
    set start y
    set T -1
    while [T < 0] [set T (random-normal Tgem 1800)]
    set p (random-float 1.0)
    set rc (4 / (1 + exp((ticks - (2.5 * Tgem)) / 20000)) - 2)
    ifelse rc > 0
      [set x (0.5 - (1 / rc) + sqrt((2.0 / rc) * p + (rc ^ -2) - (rc ^ -1) + 0.25))]
      [set x (0.5 - (1 / rc) - sqrt((2.0 / rc) * p + (rc ^ -2) - (rc ^ -1) + 0.25))]
    ifelse ? = 1
      [set R (x * start / 2)]
      [set R ((x - 1) * (100 - start) / 2)]
    set time (n-values (T / 2) [?])
    foreach time [
      set y (R * (cos (360 * ? / T)) + start - R)
      set stage ((y - (y mod 25)) / 25 - 3)
      set test (1 / (1 + exp(ticks)))
      tick
    ]
  ]
end
