Input: Difference between revisions
No edit summary |
No edit summary |
||
| Line 14: | Line 14: | ||
To model this pattern, we assumed that if the graph is split up in pieces with the peaks and valleys as cutting points, each piece will be sinusoidal with a random period and amplitude. Furthermore, we made the assumption that the period is normally distributed with mean 90 minutes or 5400 seconds (mean duration of one sleep cycle) and standard deviation 30 minutes or 1800 seconds. At first, we assumed that the amplitude is uniformly distributed, but people sleep deeper just after going to sleep and lighter just before waking up, so we had to come up with our own probability distribution. We decided to use the following probability density function: | To model this pattern, we assumed that if the graph is split up in pieces with the peaks and valleys as cutting points, each piece will be sinusoidal with a random period and amplitude. Furthermore, we made the assumption that the period is normally distributed with mean 90 minutes or 5400 seconds (mean duration of one sleep cycle) and standard deviation 30 minutes or 1800 seconds. At first, we assumed that the amplitude is uniformly distributed, but people sleep deeper just after going to sleep and lighter just before waking up, so we had to come up with our own probability distribution. We decided to use the following probability density function: | ||
<math>f(x) = rc \left( x - \frac{1}{2} \right) + 1 \qquad 0 \le x \le 1 \quad \and \quad -2 \le rc \le 2</math> | {{NumBlk|:|<math>f(x) = rc \left( x - \frac{1}{2} \right) + 1 \qquad 0 \le x \le 1 \quad \and \quad -2 \le rc \le 2</math>|{{EquationRef|1}}}} | ||
<math>P(0 \le X \le x) = \int\limits_{0}^{x} f(x)dx = \frac{1}{2} rc \left( x^2 + \left( \frac{2}{r} - 1 \right) x \right)</math> | <math>P(0 \le X \le x) = \int\limits_{0}^{x} f(x)dx = \frac{1}{2} rc \left( x^2 + \left( \frac{2}{r} - 1 \right) x \right)</math> | ||
So X is a fraction and the probability of X = x depends on the coefficient rc. How closer rc is to 2, how closer E[X] is to 1 and how closer rc is to -2, how closer E[X] is to 0. | So X is a fraction and the probability of X = x depends on the coefficient rc. How closer rc is to 2, how closer E[X] is to 1 and how closer rc is to -2, how closer E[X] is to 0. To get a random value for x, the second function needs to be rewritten: | ||
globals [y | globals [y | ||
Revision as of 18:56, 28 February 2016
Back to main page: PRE2015_3_Groep4
To the code: Code
To the output: Output
Brightness
Temperature
Sleep model
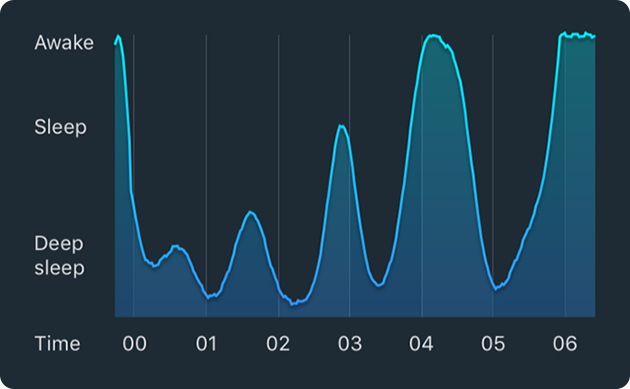
The Sleep Cycle App provides graphs to the user that show his measured sleep behavior during that night. Here's an example:
To model this pattern, we assumed that if the graph is split up in pieces with the peaks and valleys as cutting points, each piece will be sinusoidal with a random period and amplitude. Furthermore, we made the assumption that the period is normally distributed with mean 90 minutes or 5400 seconds (mean duration of one sleep cycle) and standard deviation 30 minutes or 1800 seconds. At first, we assumed that the amplitude is uniformly distributed, but people sleep deeper just after going to sleep and lighter just before waking up, so we had to come up with our own probability distribution. We decided to use the following probability density function:
[math]\displaystyle{ P(0 \le X \le x) = \int\limits_{0}^{x} f(x)dx = \frac{1}{2} rc \left( x^2 + \left( \frac{2}{r} - 1 \right) x \right) }[/math]
So X is a fraction and the probability of X = x depends on the coefficient rc. How closer rc is to 2, how closer E[X] is to 1 and how closer rc is to -2, how closer E[X] is to 0. To get a random value for x, the second function needs to be rewritten:
globals [y
         Tgem
         start
         T
         p
         rc
         x
         R
         time
         stage
         test]

to Setup
  clear-all
  set y 100
  set Tgem (90 * 60)
  reset-ticks
end

to Go
  foreach [1 2] [
    set start y
    set T -1
    while [T < 0] [set T (random-normal Tgem 1800)]
    set p (random-float 1.0)
    set rc (4 / (1 + exp((ticks - (2.5 * Tgem)) / 20000)) - 2)
    ifelse rc > 0
      [set x (0.5 - (1 / rc) + sqrt((2.0 / rc) * p + (rc ^ -2) - (rc ^ -1) + 0.25))]
      [set x (0.5 - (1 / rc) - sqrt((2.0 / rc) * p + (rc ^ -2) - (rc ^ -1) + 0.25))]
    ifelse ? = 1
      [set R (x * start / 2)]
      [set R ((x - 1) * (100 - start) / 2)]
    set time (n-values (T / 2) [?])
    foreach time [
      set y (R * (cos (360 * ? / T)) + start - R)
      set stage ((y - (y mod 25)) / 25 - 3)
      set test (1 / (1 + exp(ticks)))
      tick
    ]
  ]
end
